Pollution, bad-mouthing, and local marketing: The underground
of location-based social networks
Helen Costa
a, Luiz H.C. Merschmann
a, Fabrício Barth
b, Fabrício Benevenuto
c,⇑ aFederal University of Ouro Preto, Ouro Preto, BrazilbVAGAS Tecnologia Ltda, São Paulo, Brazil
cFederal University of Minas Gerais, Belo Horizonte, Brazil
a r t i c l e
i n f o
Article history:
Received 10 September 2013
Received in revised form 20 February 2014 Accepted 26 March 2014
Available online 19 April 2014
Keywords:
Location-based social network Social network
Tip spam Tip analysis
a b s t r a c t
Location Based Social Networks (LBSNs) are new Web 2.0 systems that are attracting new users in exponential rates. LBSNs like Foursquare and Yelp allow users to share their geo-graphic location with friends through smartphones equipped with GPS, search for interest-ing places as well as postinterest-ing tips about existinterest-ing locations. By allowinterest-ing users to comment on locations, LBSNs increasingly have to deal with new forms of spammers, which aim at advertising unsolicited messages on tips about locations. Spammers may jeopardize the trust of users on the system, thus, compromising its success in promoting location-based social interactions. In spite of that, the available literature is very limited in providing a deep understanding of this problem.
In this paper, we investigated the task of identifying different types of tip spam on a pop-ular Brazilian LBSN system, namely Apontador. Based on a labeled collection of tips pro-vided by Apontador as well as crawled information about users and locations, we identified three types of irregular tips, namely local marketing, pollution and, bad-mouth-ing. We leveraged our characterization study towards a classification approach able to dif-ferentiate these tips with high accuracy.
Ó2014 Elsevier Inc. All rights reserved.
1. Introduction
Location Based Social Networks (LBSNs) are new Web 2.0 systems that are attracting new users in exponential rates. Nearly one in five smartphone owners access this kind of service via their mobile devices[1]. LBSNs like Foursquare and Yelp allow users to share their geographic location with friends through smartphones equipped with GPS, search for interesting places as well as posting tips about existing locations.
In Brazil, a popular LBSN system is named Apontador,1and it includes the main features of systems like Foursquare and
Yelp. It allows users to search for places, register new locations and check-in in locations using smartphones. Additionally, Apontador contains one of the most interesting features of LBSNs, which is allowing users to post-tips to existing places. Due to these tips, with a smartphone and access to a LBSN, a user might not only find nearby places to visit, but also read
http://dx.doi.org/10.1016/j.ins.2014.03.108 0020-0255/Ó2014 Elsevier Inc. All rights reserved.
⇑Corresponding author. Tel.: +55 31 3409 5860.
E-mail addresses: [email protected] (H. Costa), [email protected] (L.H.C. Merschmann), [email protected] (F. Barth),
[email protected](F. Benevenuto).
1http://www.apontador.com.br/.
Contents lists available atScienceDirect
Information Sciences
suggestions about what to order, what to buy or even what to avoid on specific places. Thus, tips in LBSN work as crowdsourcing recommendations about specific locations.
Although appealing as a mechanism to enrich the user experience on the system, tips open opportunities for users to dis-seminate unsolicited messages. LBSNs increasingly have to deal with different forms of attacks, which aim at advertising unsolicited messages instead of true tips about locations. Most of studies in this field have focused in opinion spam
[13,14,16], a fake opinion that deliberately mislead readers by giving positive reviews to a place in order to promote it and/or by giving negative reviews in order to damage the place’s reputation. However, little is known about the activities of other types of opportunistic behavior in the context of LBSNs. As example, consider tips containing local advertisement or even tips containing irrelevant content that is unrelated or inappropriate to the place (e.g. links to pornography websites posted at schools). This kind of tips may also jeopardize the trust of users on the existing tips available in the system, thus compromising its success in promoting location-based social interactions. Furthermore, tip spam may compromise user patience and satisfaction with the system since users need to filter out spam from what is worth reading. In spite of that, the available literature is very limited in providing a deep understanding of this problem in an environment where places are the central object.
In this paper, we address the issue of identifying different forms of tip spam in LBSNs adopting a 3-step approach. First, we categorized tip spam into three different classes based on a labelled dataset of spam and non-spam tips. Second, we ana-lyzed a number of attributes extracted from the tips’ content and from the user behavior on the system aiming at under-standing their relative discriminative power to distinguish among the different classes of tip spam. Lastly, we investigated the feasibility of applying supervised machine learning methods to identify these tip spam classes. Our approach was not only able to correctly identify a significant part of the tips as spam or non-spam, but it was also able to differentiate tips from different spam classes. In this study, we identify three types of spam tips, namely (i)local marketing: tips containing local advertisement, sometimes about the current place or about a business related to it, (ii)pollution: tips with content unrelated to the place, and (iii)bad-mouthing: tips containing very aggressive comments about the places, their owners or other users who posted tips in the system.
The rest of the paper is organized as follows. Next section presents related efforts in this theme. Section3describes our strategy to categorize tip spam classes. Section4investigates a number of attributes and their ability to distinguish tips from different classes. Section5describes and evaluates our strategy to detect the three types of tip spam. Finally, Section6offers conclusions and directions for future work.
2. Related work
Spam detection has been observed in various social network systems, including YouTube[6], Twitter[5,11], Facebook
[10], and MySpace[15]. Particularly, Benevenuto et al.[5]approached the problem of detecting spammers on Twitter. By using a labeled collection of users manually classified, they applied a classification machine learning approach to differen-tiate spammer users from legitimate ones. Similarly, Lee et al.[15]created social honeypots to identify a set of spammers on MySpace and Twitter. In addition to showing that social honeypots are accurate in identifying spammers, they propose a machine learning method to detect spammers in these two systems. Although these methods inspired the approach we used here, our work is complementary to them as we investigate spam in a different environment, identifying the specific features that allow us to accurately differentiate classes of tip spam. In a recent effort, Vasconcelos et al.[18]crawled Foursquare to characterize the user behavior based on information oftips,donesandtoDos. Using an expectation maximization clustering algorithm, they clustered users into four groups, out of which one contained a large number of tip spammers. Thus, they presented the first evidence of spam in LBSNs.
In the context of reviews about products, Jindal and Liu[13]investigated the detection of opinion spam on product reviews, based on the analysis of reviews from amazon.com. Opinions spam are untruthful opinions that deliberately mis-lead readers by giving undeserving positive reviews to some target objects in order to promote the objects and/or by giving unjust or malicious negative reviews in order to damage the objects’ reputation. Thus, they proposed a model to detect harmful opinions, based on duplicate reviews (copies), which inspired a few metrics proposed in our work. Recently, Kakhki et al.[14]approached the problem where users create multiple identities and use these identities to provide positive ratings on their own content or negative ratings on others’ content. Then, they developed a system named Iolaus to mitigate the effect of rating manipulation in online content ratings services like tips in LBSNs. Different from these efforts, we explore other kinds of spam in LBSNs. Thus, our work is complementary to theirs.
who posted the tips, and to the social graph. Moreover, we focus our analyses and classification approach on tips instead of users, which is a fundamentally different problem, with different applications.
3. Tip test collection
In order to evaluate our proposed approach to detect and differentiate classes of tip spam, we need a test collection of tips pre-classified into different classes. However, to the best of our knowledge, no such collection is publicly available for any LBSN, thus requiring us to build one. To this end we used a data collection we obtained from Apontador, a Brazilian LBSN that contains more than seven million registered places and services. Our data collection consists of two sets of data, one contain-ing tips labelled as spam and non-spam tips, used in our previous study[9]. The other consists of data we crawled in order to enhance the features used to differentiate the classes of tips. Next, we describe both datasets.
3.1. Labeled dataset
Although spam presents different aspects on different environments, it is defined in most of its forms as unsolicited elec-tronic messages, especially advertising, sent indiscriminately to users. In LBSNs, spam mostly occurs in the form of tips that aim at spreading advertisement or simply polluting the list of tips of a place. We obtained from Apontador a dataset contain-ing tips about places manually labelled as spam or non-spam by three Apontador’s moderators. They manually inspected the tips posted during the month of September, 2011 and identified3668tips as spam. Apontador also provided all the other tips posted during the same period.
As Apontador’s manual classification relies on human judgement to decide whether a tip is spam or not, we investigate if one extra volunteer from our research group agrees with the labeling provided by Apontador’s moderators. Simultaneously, we used this manual evaluation to identify different types of tip spam. In this process, we asked the volunteer to manually verify all the spam tips and classify them as spam or non-spam. The volunteer classified 130 tips as non-spam and 3538 as spam. Despite the 3.5% of tips considered as non-spam, we noted a high level of agreement with the labelled performed by Apontador, which reflects a high level of confidence of this human classification process. Thus, we considered for our study the labelled dataset obtained from Apontador without the 130 tips that we classified as non-spam.
Our second step in the labeling process consisted of asking the volunteer to provide a name that would most describe a tip category. Based on these descriptions, we could identify three classes of tip spam: local marketing, pollution, and bad-mouthing. Local marketing are tips containing local advertisement, sometimes about the current place or about a business related to it. Pollution contains content unrelated with the place, or irrelevant content like sentences with no apparent meaning. Finally, bad-mouthing is characterized by aggressive comments about the places containing many attacks against a place or other users.Table 1summarizes how the labelled tips are distributed across these tip spam classes.
Aiming at using a balanced dataset, we randomly selected3538tips classified as non-spam. In summary, our labelled dataset contains7076labelled tips equally divided as spam and non-spam. And the spam tips have a second label, being 30.1% of them classified as local marketing, 48.5% as pollution, and 21.4% as bad-mouthing. These tips were posted by
4494unique users to5585different places.
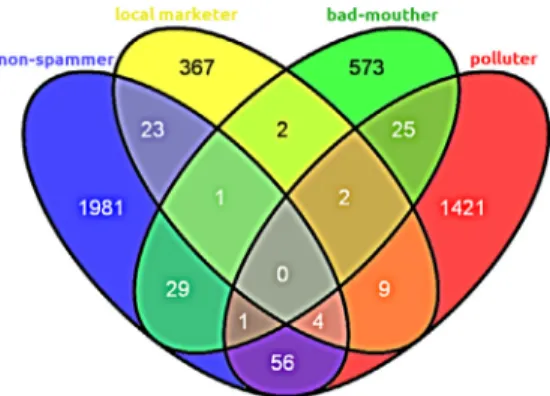
Fig. 1represents the sets of distinct users who have posted at least one tip classified into one of the classes we have in the dataset. We can see in the diagram that there are users who posted tips from different classes. For instance, the number of users who posted both local marketing and non-spam tips, bad mouthing and non-spam tips, pollution and non-spam tips are 23, 29, and 56, respectively, suggesting a dual behavior of a few spammers, who sometimes behave as a legitimate user. Based on this observation, we decided to focus our analyses and classification experiments on the detection of tips instead of users.
In addition to these labels, each tip obtained contains the following information: the tip content, timestamp, click counter in the link ‘‘This tip helped me’’, click counter in the link ‘‘Report abuse’’, the tip ID, the user ID, and the place ID.
3.2. Crawling Apontador
The labelled tips obtained from Apontador contain the unique ID of places, which allow us to gather further information about places from the Apontador API,2useful to allow us to explore other features able to differentiate the classes of tips. Each
Table 1 Tip spam classes.
Class Number of tips Percentage (%)
Local marketing 1063 30.1
Pollution 1716 48.5
Bad-mouthing 759 21.4
Total 3538 100
place entry on the Apontador API contains the following information: unique ID, name, description, counter click, number of tips, number of recommendations, category (e.g., restaurant, hotel, or hospital), address, phone, latitude, longitude, and infor-mation about the user who made the place registration on the system (i.e., the place owner). We developed a python crawler to gather this information for each place that appeared in the tips from the labelled dataset, which corresponds to 5585 places.3
In addition to places, we developed a second crawler that gathered information about the user’s social network (list of followers and followees) as well as all the tips posted by them. By gathering the list of followers and followees of a user, new users were discovered and also gathered. We executed this process recursively until all discovered users were gathered, which corresponds to an entire weakly connected component of the Apontador graph. From the 4494 unique users that appeared in the labelled dataset we discovered and crawled a social network graph containing 137,464 users. For each crawled user we gathered the following information: user name, number of places registered, number of tips posted, and number of photos posted.
4. Identifying behavior in LBSN
Unlike ordinary users of LBSNs, people who spam aim at commercial intent (e.g., advertising), self-promotion, and belit-tlement of ideas and reputation. Assuming that users who post non-spam tips or tips containing local marketing, pollution, or bad-mouthing have different goals in the system, we expect they also differ on how they behave (e.g., what they post, to which place they post) to achieve their purposes. Thus, to verify our conjecture, in this section we analyze a large set of attri-butes that reflect user behavior in the system aiming at investigating their relative discriminative power to distinguish each tip class from the others. We considered four attribute sets, namely, content attributes, user attributes, place attributes, and social attributes. Next, we describe each of them and evaluate the relative ability of the identified attributes to differentiate tips of each class.
4.1. Content attributes
Content attributes are properties of the text of tips posted by users. The following attributes were investigated for each tip of our labelled collection: number of words, number of numeric characters (i.e., 1, 2, 3) that appear on the text, number of spam words or expressions from a popular list of spam words4and a set of SpamAsassin rules in Portuguese5that contains
regular expressions for common spam sentences that appear on the corpus of emails, number of capital letters, number of words with all letters in capital, number of URLs, number of email addresses, number of phone numbers, and number of contact information on the text (which is the sum of number of email addresses and number of phone numbers).
Another metric we calculate is the number of offensive words on the text. To compute this metric we used a crowdsourc-ing list of offensive words in Portuguese.6A second attribute related to offensive words is ‘‘Has offensive word’’. If the tip has at
least one offensive word, the value of ‘‘Has offensive word’’ is 1, otherwise, it is 0.
We also measured the Jaccard coefficient[4]and n-gram features, defined as follows. For both metrics, we considered the set of tips associated with the user who posted the labelled tip. Let A and B be the sets of words of two tips from the same user. The Jaccard coefficient,JðA;BÞ, between A and B is given by the number of words in common in A and B divided by the total number of words in the union of both sets:JðA;BÞ ¼ jA\Bj=jA[Bj. A Jaccard coefficientJequal to 0 means that the two tips have no word in common, whereas J close to 1 indicates that both tips share most of the words. We also generate two
Fig. 1.Venn diagram of distinct users.
3 Apontador API is open for everyone and they suggest a limit of 15,000 req/month for developers applications. In our crawl, we did not follow the API terms
of use because we signed a non-disclosure agreement (NDA) with Apontador. 4 List of spam words:http://www.codex.wordpress.org/Spam_Words.
n-gram features, number of distinct n-gram and fraction of n-gram. An n-gram is a contiguous sequence of n words from a given sequence of text. An n-gram of size 1 is called unigram, size 2 is brigrama and size 3 is trigram. For each tip of the user, we compute ‘‘number of distinct n-gram’’ as the number of distinct n-gram in the tip that were used by the user in other tips of his tip set. And to compute ‘‘fraction of n-gram’’, for each tip of the user, we considered the fraction of ‘‘number of distinct n-gram’’ per total number of distinct n-gram posted by the user in his tip set. The average of these values were used to rep-resent the attributes and we computed the n-gram features for n equals to 1, 2, and 3.
Additionally, we compute a set of psycholinguistic features that extracts the sentiment polarity of the tip. To do this, we used a system called iFeel[3], that implements the most popular sentiment analysis methods in the literature and groups their varying scales of sentiments into two representative categories: positive affect and negative affect. The methods cov-ered by Ifeel are: Happiness Index, SentiWordNet, SASA, PANAS-t, Emoticons, SenticNet, SentiStrength, and Combined-method, being the last one created by the authors to analyze the harmonic mean of the precision and recall for each previous methods and gives different weights for them. As all methods are implemented for English language, we translated our Por-tuguese tip collection using Google’s free online language translation service.7More details about the sentiment analysis
methods can be found in[12].
Finally, we also considered two other attributes that are related to tip content, but not directly with the text. These attri-butes are the number of clicks on the link ‘‘This tip helped me’’ and the number of clicks on the link ‘‘Report abuse’’.
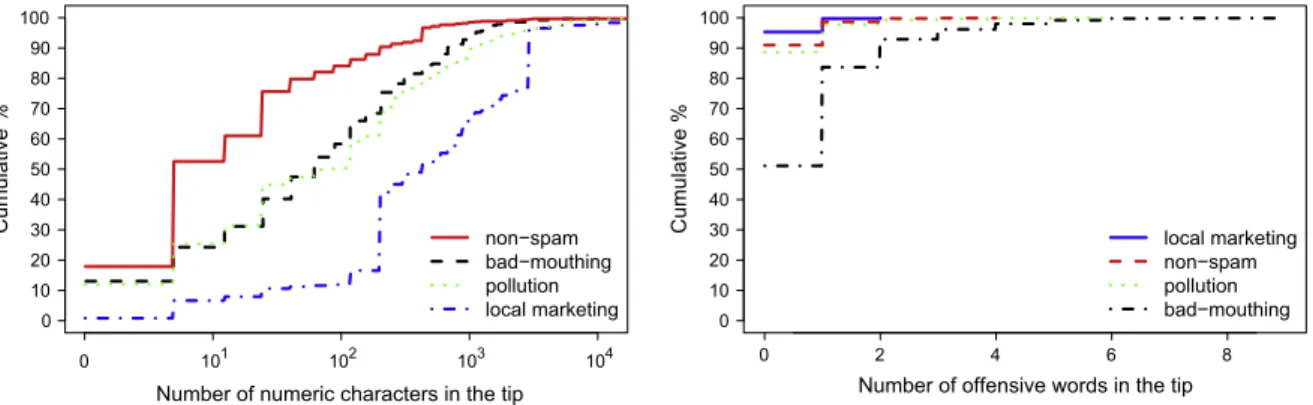
As an illustration of the potential discriminative power of the attributes we extracted from content, inFig. 2(left) we observe that local marketing tips have more numeric characters in the text than other tips. In fact, this happens because it is common to publish phone numbers as part of an advertise of local services. In fact, we noted that approximately 55.0% of local marketing tips have at least one contact in the text.Fig. 2(right) shows the number of offensive words in the text of each type of tip. The plot shows that approximately 50.0% of bad-mouthing tips have at least one offensive word in the text. While for the other classes, approximately 90.0% of the tips do not have offensive words.
4.2. User attributes
The second set of attributes consists of specific properties of user behavior in the system. We considered the following user attributes: number of places registered by the user, number of tips posted by the user, number of photos posted by the user, the distance among all places reviewed by the user, number of different areas where the user posted a tip, tip focus of a user, and tip entropy of a user. To compute the attribute ‘‘distance among all places reviewed by the user’’, we measured the distance between each pair of places reviewed by the user, considering only those users who reviewed more than one different place, which correspond to 25.2% users. Otherwise, the value of this attribute is zero. Then, we computed the dis-tance between each pair of places using the information of longitude and latitude of them. And to calculate the attribute ‘‘number of different areas where the user posted a tip’’, we defined an area as the geographical position of the first place reviewed by a user. If the next place reviewed by the user is within 50 km radius of the first area, then it belongs to the same area. Otherwise, a new area is created.
Considering the concept of area we defined, ‘‘tip focus’’ (TF) of a userxis defined as follows:
TFðxÞ ¼maxkntðakÞ
ttðxÞ ð1Þ
wherentðakÞis the number of tips ofxin an areakandttðxÞis the total number of tips of userx. TheTFis the highest fraction of tips that userxposted in a single area over his total number of tips. In a similar way, we defined ‘‘tip entropy’’ (TE) of a user
xas follows:
Number of numeric characters in the tip
Cumulative %
0 10 20 30 40 50 60 70 80 90 100
0 101 102 103 104
non−spam bad−mouthing pollution local marketing
0 2 4 6 8
Number of offensive words in the tip
Cumulative %
0 10 20 30 40 50 60 70 80 90 100
local marketing non−spam pollution bad−mouthing
Fig. 2.Content attributes for classes of tips: number of numeric characters in the tip (left) and number of offensive words in the tip (right).
TEðxÞ ¼ X
N
k¼1 ntðakÞ
ttðxÞ log2 ntðakÞ
ttðxÞ ð2Þ
where the sum is running only over areas (N) for which the number of posted tip of userxis different of zero. TheTEis effec-tively the information entropy of the distribution of tips of a userxover the different areas. Thus, higher values ofTEdenotes users whose tips are spread more uniformly across several areas, while lowerTEvalues indicate user tips more focused in less areas.
In this set of attributes we could investigate the geographical proximities of the places reviewed by the four types of users found in the dataset. To do this, we considered only tips that were posted by users who post at least two tips in Apontador. For each tip class, the percentage of local area tips: 48.6% of bad-mouthing tips, 80.8% of local marketing tips, 38.4% of pol-lution tips, and 54.8% of non-spam tips. A noteworthy fact here is the high percentage of local marketing tips posted in the same area. This indicates that local marketers act in certain regions and thus, targeting advertises to specific areas. On the other hand, we observed that non-spammers tend to post-tips to very distant places as well. To measure this we compute largest distance among all places in which a user posted a tip. Intuitively, one might expect that non-spammers tend to visit and post-tips only to places close to their homes or offices whereas spammers post-tips to random places. However, when we analyze the largest distance among the places a user posted a tip we noted that 60% of the non-spammers have the larg-est distance among tips larger than 1000 km. In comparison with local marketers, only 20% of them have the larglarg-est distance larger than this same value. We conjecture that real users largely use LBSNs when they travel or visit different geographical regions in order to receive tips about places they are not familiar with, while local marketers and other spammers do not have the same motivation to do that. These observations suggest that user behavior extracted from geographical distance features might help to differentiate tip classes.
Another observation related to user attributes is that bad-mouthers and polluters interact less with the system tools.
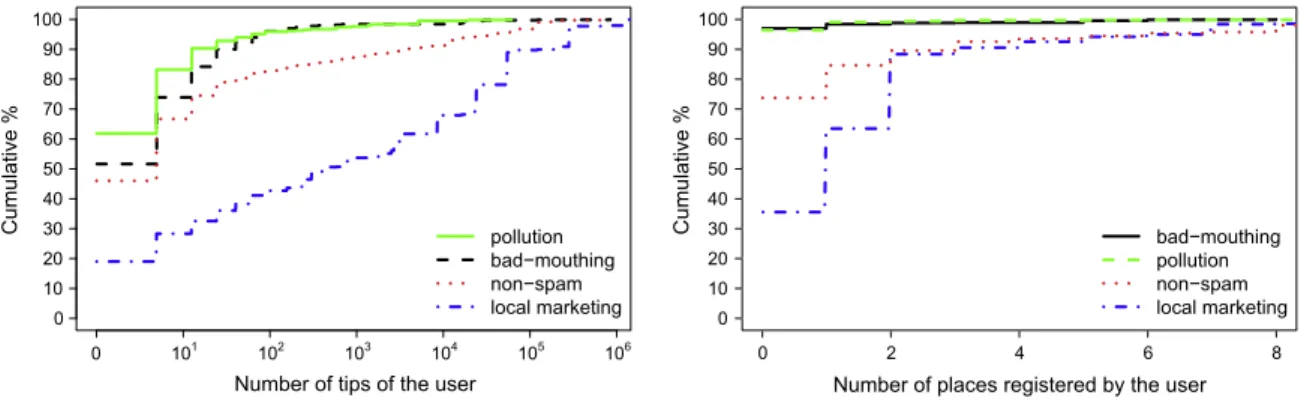
Fig. 3shows that approximately 92% of the pollution tips, 83% of the bad-mouthing tips and 74% of the non-spam tips belong to users who posted up to 10 tips, whereas only 28% of local marketing tips belong to users who posted no more than this same number of tips. This indicates that, among the spammers, bad-mouthers and polluters have similar behavior and they interact less with system tools than local marketers. Another attribute that confirms this is the number of photos posted by the user. We observe that 97% of bad-mouthing and pollution tips belong to users who did not posted any photo, whereas less than 60% of local marketing tips belongs to user who did not posted any photo. We also observe that local marketers registered more places than the all other users, confirming that they have tend to interact more with the system across dif-ferent features.Fig. 3(right) shows that only 35% of local marketing tips were posted by users who did not registered any place, whereas approximately 74% of non-spam tips and 94% of bad-mouthing and pollution tips belong to users who did not registered any place. This fact also suggests that, in addition to post-advertisements about their services, they register their business and contribute to the LBSN site.
4.3. Place attributes
The third set of attributes is related to the place where tips are posted. We selected 5 place attributes: number of clicks on the place page, number of tips on the place, place rating (a 5-point rating scale with 1 being the worst and 5 being the best), number of clicks on the link ‘‘Thumbs up’’ of the place, and number of clicks on the link ‘‘Thumbs down’’ of the place. Ana-lyzing this set of attributes, we found that local marketing tips are mostly posted to places with high evaluation rating (in a five star rating system).Fig. 4shows that more than 80% of local marketing tips are posted to places with more than 4 stars, indicating that local marketing tips usually target popular and well evaluated places. We conjecture that this behavior might be related with attempts to increase the visibility of their tips. We can also note that bad-mouthing tips tend to target bad
Number of tips of the user
Cumulative %
0 10 20 30 40 50 60 70 80 90 100
0 101 102 103 104 105 106
pollution bad−mouthing non−spam local marketing
0 2 4 6 8
Number of places registered by the user
Cumulative %
0 10 20 30 40 50 60 70 80 90 100
bad−mouthing pollution non−spam local marketing
quality places (i.e. almost 70% of them were posted to 1, 2 or 3 stars places). This might indicate that the place they target is really a bad place or even that the bad-mouthing tips are part of an attack to decrease the rating of the place.
4.4. Social attributes
The fourth set of attributes captures the relationships established among users via the social network. The idea is that these attributes might capture specific interaction patterns that could help differentiating users who post non-spam tips from those who post-spam. We selected the following attributes extracted from the social network, which capture the level of (social) interaction of the corresponding user: clustering coefficient, betweenness, reciprocity, assortativity, in-degree, out-degree, degree, fraction of followers (in-degree) per followees (out-degree), and Pagerank.
The clustering coefficient of a nodei; ccðiÞ, is the ratio of the number of existing edges over the number of all possible edges betweeni’s neighbors. It measures the density of communication, not only between two users but among neighbors of neighbors. Another interesting metric to observe is the reciprocity of each user. The reciprocity (R) of a user is given by
RðxÞ ¼jOutjOutðxÞ\ðxInÞjðxÞj, whereOut(x) is the set of users that userxfollows (followees) andIn(x) is the set of users that follows user
x(followers). Reciprocity measures the probability of a user being followed by each user that he/she follows. Node assort-ativity is defined as the ratio between the node (in/out) degree and the average (in/out) degree of its neighbors. We compute node assortativity for the four types of degree-degree correlations (i.e., in–in, in–out, out–in, out–out).
We also use the Pagerank[8]algorithm on the social graph. Basically, a user has a high rank if he/she has many incoming links or the user has links coming from highly ranked users. The scores computed by the Pagerank algorithm could be used as indicators of the importance of users in terms of their participation in the LBSN.
Social attributes showed that bad-mouthers and polluters have less followers than followees. As spammers might not be interested in establishing real relationships, we can expect different patterns for spammers and non-spammers in terms of the number of incoming and outgoing links of the Apontador graph. However, instead of simple measuring the number of followers (in-degree) and followees (out-degree), we also compute the fraction of followers per followees, as shown in
Fig. 5(left). We can see that bad-mouthers and polluters have a lower ratio of followers per followees in comparison with non-spam and local marketers. Indeed, some classes of spammers may try to follow other users as an attempt to be followed back. However, most users do not follow spammers back, what produces a fraction of followers per followees smaller for bad-mouthers and polluters. Nevertheless, local marketers showed a ratio even higher than non-spammers. This confirms that this class of spammer has interacted more with the system than non-spammers.
1 2 3 4 5
Place rating
Cumulative %
0 10 20 30 40 50 60 70 80 90 100
bad−mouthing pollution non−spam local marketing
Fig. 4.5-star rating of target places of each tip class.
Fraction of followers per followees
Cumulative %
0 10 20 30 40 50 60 70 80 90 100
10−2 10−1 0 101 102 103 104
bad−mouthing pollution non−spam local marketing
Clustering coefficient
Cumulative %
0 10 20 30 40 50 60 70 80 90 100
10−4 10−3 10−2 10−1 0
bad−mouthing pollution non−spam local marketing
We also observed that friends of bad-mouthers and polluters are not tightly connected. The clustering coefficient mea-sures how connected are the friends (followers and followees) of a user.Fig. 5(right) shows the CDF for the clustering coef-ficient of users. As we can see local marketers and non-spammers are more tightly connected than bad-mouthers and polluters.
4.5. Importance of the attributes
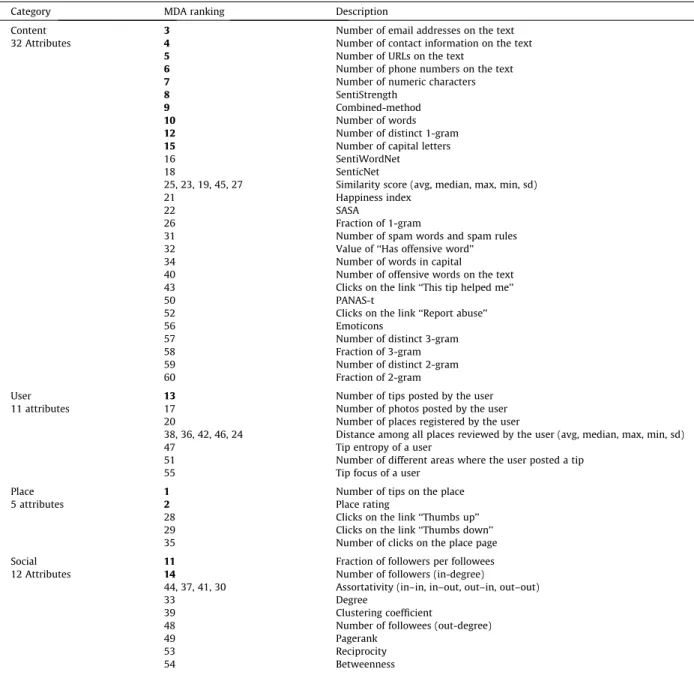
We assessed the relative power of the 60 selected attributes in discriminating each class from the others by ranking the attributes based on the Variable Importance Measures (VIMs) from Random Forest (RF)[7]classifier, used in Section5. The VIM used was the Mean Decrease Accuracy (MDA), which is determined during the out of bag error calculation phase. The MDA quantifies the importance of an attribute by measuring the change in prediction accuracy, when the values of the attri-butes are randomly permuted compared to the original observations.Table 2summarizes the results, showing the rank of
Table 2 Attribute ranking.
Category MDA ranking Description
Content 3 Number of email addresses on the text
32 Attributes 4 Number of contact information on the text
5 Number of URLs on the text
6 Number of phone numbers on the text
7 Number of numeric characters
8 SentiStrength
9 Combined-method
10 Number of words
12 Number of distinct 1-gram
15 Number of capital letters
16 SentiWordNet
18 SenticNet
25, 23, 19, 45, 27 Similarity score (avg, median, max, min, sd)
21 Happiness index
22 SASA
26 Fraction of 1-gram
31 Number of spam words and spam rules
32 Value of ‘‘Has offensive word’’
34 Number of words in capital
40 Number of offensive words on the text
43 Clicks on the link ‘‘This tip helped me’’
50 PANAS-t
52 Clicks on the link ‘‘Report abuse’’
56 Emoticons
57 Number of distinct 3-gram
58 Fraction of 3-gram
59 Number of distinct 2-gram
60 Fraction of 2-gram
User 13 Number of tips posted by the user
11 attributes 17 Number of photos posted by the user
20 Number of places registered by the user
38, 36, 42, 46, 24 Distance among all places reviewed by the user (avg, median, max, min, sd)
47 Tip entropy of a user
51 Number of different areas where the user posted a tip
55 Tip focus of a user
Place 1 Number of tips on the place
5 attributes 2 Place rating
28 Clicks on the link ‘‘Thumbs up’’
29 Clicks on the link ‘‘Thumbs down’’
35 Number of clicks on the place page
Social 11 Fraction of followers per followees
12 Attributes 14 Number of followers (in-degree)
44, 37, 41, 30 Assortativity (in–in, in–out, out–in, out–out)
33 Degree
39 Clustering coefficient
48 Number of followees (out-degree)
49 Pagerank
53 Reciprocity
54 Betweenness
attributes from each set (content, user, place and social) according to the variable importance ranking. Note that the 15 most discriminative attributes are distributed among the four categories, which shows the importance of having investigated each one of them.
5. Detecting classes of tip spam
From now on, we investigate the feasibility of applying supervised learning methods in order to detect bad-mouthing, pollution and local marketing tips on Apontador. To do so, the learning algorithm copes with the attributes described in the previous section, i.e., it builds a classification model by analyzing a set of training instances (tips) represented by a vector of attribute values and a class label. In a second step, the classification model is used to classify test instances (tips) into the classes: non-spam, bad-mouthing, pollution and local marketing. In this work, we are using a training set containing pre-labelled data (see Section3). In practical scenarios, several initiatives can be used to obtain a set of labelled data (e.g., vol-unteers who help marking spam, professionals hired to periodically manually classify a sample of tips, etc.). Additionally, there are semi-supervised strategies in the literature that are able to obtain classification results close to supervised approaches with a much reduced labeling dataset[20]. Our goal here is to evaluate the effectiveness of supervised learning methods for the task to detect the different classes of tip spam we identified. We left as future work the effort to reduce the labeling dataset for this task.
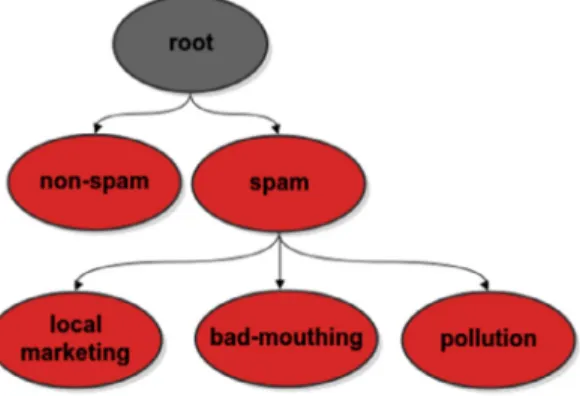
The problem addressed here can be seen as a hierarchical classification problem, since there is a pre-defined class hier-archy as shown inFig. 6. In this hierarchy, the first level is composed of the classes spam (S) and non-spam (NS), and the second level of descendant classes of spam (bad-mouthing (BM), pollution (PL) and local marketing (LM)). Aiming at solving this problem, two classification approaches were considered: flat and hierarchical.
The flat multi-class classification approach is the simplest one to cope with classification problems, as it ignores the class hierarchy and perform predictions directly at the leaf nodes. Then, a unique classifier is trained to differentiate among non-spam, bad-mouthing, pollution and local marketing tips.
On the other hand, the hierarchical approach takes into account the class hierarchy by using a local information perspec-tive. Among the different ways of using this local information, in this work we are considering a local classifier per parent node. In essence, in this approach, for each parent node in the class hierarchy, a classifier is built to distinguish among its child nodes. This approach is often coupled with top-down prediction strategy in the classification phase. Then, the classi-fication of a new instance is processed one level at a time.
Therefore, in the problem addressed here, a root node classifier is trained to separate spam from non-spam tips, and another one, a spam node classifier, is trained to distinguish among bad-mouthing, pollution and local marketing tips (child nodes of spam). Later, during the classification phase, an instance is assigned a class of the first hierarchy level by the root node classifier. If spam is the class assigned to this instance, then the spam node classifier will assign to this instance one of the spam child classes (bad-mouthing, pollution or local marketing).
Next, the metrics used to evaluate our experimental results are presented in Section5.1. Section5.2describes the clas-sification methods adopted in this work and the experimental setup used. The results obtained from flat and hierarchical approaches are presented in Sections5.3 and 5.4, respectively. Finally, Section5.5discusses the impact of reducing the attri-bute set on the classification effectiveness.
5.1. Evaluation metrics
To assess the effectiveness of our classification experiments, we adopted metrics commonly used in machine learning and information retrieval[4]. To explain these metrics in the context of our problem, we will use the confusion matrix showed in
Table 3, whereaindicates the percentage of non-spam tips (NS) that were correctly classified,bindicates the percentage of
non-spam tips that were wrongly classified as local marketing (LM),cindicates the percentage of non-spam tips that were wrongly classified as pollution (PL), anddindicates the percentage of non-spam tips that were wrongly classified as bad-mouthing (BM). The same reasoning can be applied to interpret the remaining entries in this confusion matrix.
The following metrics were considered in our evaluation: recall, precision, F-measure (F1), Micro-F1 (or accuracy) and Macro-F1. The recall (R) and precision (P) of a classiare defined as follows:
Ri¼
TPi
TPiþFNi;
Pi¼
TPi
TPiþFPi; ð
3Þ
whereTPiis the number of instances correctly assigned to classi; FNiis the number of instances which belong to classibut are not assigned to classiby the classifier, andFPiis the number of instances which do not belong to classibut are incor-rectly assigned to classiby the classifier.
The values in the main diagonal of confusion matrix showed inTable 3represent the recall of each class.
The F-measure metric is a standard way of summarizing precision and recall, and is defined asF1i¼2PPiiþRRii. The F-mea-sure metric reaches its best value at 1 (indicating a perfect prediction) and worst at 0. The overall F-meaF-mea-sure value of the entire classification problem can be calculated in two different ways: Micro-F1 and Macro-F1.
The Micro-F1 is computed from the global precision and recall values calculated for all classes as follows:
R¼
Pm i¼1TPi
Pm
i¼1ðTPiþFNiÞ ; P¼
Pm i¼1TPi
Pm
i¼1ðTPiþFPiÞ
; ð4Þ
wheremis the number of classes. The Micro-F1 is then defined as Micro-F1¼2PR
PþR. Basically, this metric gives equal importance to each tip, independently of its class, and therefore, it tends to be dominated by classifier’s performance on majority classes.
In a different way, Macro-F1 gives equal importance to each class, regardless of its relative size. Then, it is more affected by classifier’s performance on minority classes. Macro-F1 is obtained by computing the average of F-measure values of each
class as Macro-F1¼ Pm
i¼1F1i
m , wheremis the number of classes.
5.2. The classifiers and experimental setup
In this work, experiments were conducted using Support Vector Machine (SVM)[17]and Random Forest (RF)[7] classi-fiers, which are state-of-art techniques in classification. For all the classification approaches, both SVM and RF classifiers were evaluated.
Considering that the set of training instances are represented as points in space, the basic idea of the Support Vector Machine is to find an optimal separating hyperplane, i.e., a decision boundary that separates with a maximum margin the training data into two portions of an N-dimensional space. Then, given a new instance to be classified, it is mapped into that same space and predicted to belong to a class based on its position in relation to the separating hyperplane. To deal with non-linearly separable data, SVM transforms the original training data into a higher dimension using a nonlinear mapping. Once the data have been transformed into a new higher dimensional space, SVM searches for a linear separating hyperplane in this new space. Although this method has been originally designed for binary classification, different extensions were pro-posed in the literature to make it suitable for multi-class problems.
The implementation of SVM used in our experiments is provided by Weka[19], a free and open source software widely used for data mining. We used the Radial Basis Function (RBF) kernel to allow SVM models to perform separations even with very complex boundaries. Aiming at finding the best parameters setting for the dataset used in this work, a tuning process has been run using the GridSearch algorithm also implemented in the Weka tool. As result of this tuning process, for the flat classification approach, in which a unique classifier is trained, the parameter valuesc¼1024 andgamma¼0:0625 were adopted in our experiments. As for hierarchical approach, since two classifiers are built, we obtained two different sets of parameter values:c¼512 andgamma¼0:125 for the classifier trained to distinguish between spam and non-spam, and
c¼80 andgamma¼0:5 for the classifier used to identify bad-mouthing, pollution and local marketing tips.
Random Forest is an ensemble classifier that builds many decision trees (forest) and outputs the class having most votes over all the trees in the forest. Each decision tree is grown from a random subset of the training dataset. In addition, during the tree growing process, a random subset of the available attributes is used to determine the best split for each node of the
Table 3 Confusion matrix.
True label Predicted label
NS LM PL BM
NS a b c d
LM e f g h
PL i j k l
tree. For classifying a new instance (tip), it is pushed down each of the trees in the forest. Then, each tree gives a classifica-tion, i.e., a class receives one vote of that tree. The Random Forest prediction is the class having the most votes.
The experiments involving RF were carried out using the algorithm implemented in the Weka software. In order to search for the best parameter set for the given training dataset, a grid search parameter optimization algorithm (GridSearch) was run on parametersnumFeatures(used in random selection of attributes) andnumTrees(number of trees to be generated) of the classifier. As result, for the flat classification approach, the parameter valuesnumFeatures¼24 andnumTrees¼275 were adopted in our experiments. As for hierarchical approach, the two different sets of parameter values are:numFeatures¼11 and numTrees¼155 for the classifier trained to distinguish between spam and non-spam, and numFeatures¼22 and
numTrees¼165 for the classifier used to identify bad-mouthing, pollution and local marketing tips.
The predictive performance was measured using a 105-fold cross-validation method (105CV). In each 5CVtest, the original dataset is partitioned into 5 exclusive sets, out of which four are used as training data, and the remaining one is used for testing the classifier. The classification process is then repeated 5 times, with each of the 5 sets used exactly once as the test data, thus producing 5 results. The entire 5CVwas repeated 10 times with different seeds used to shuffle the ori-ginal dataset, thus producing 50 potentially different results. So, the results reported in Sections5.3 and 5.4are averages of the 50 runs. With 95% of confidence, the results reported in Sections5.3 and 5.4do not differ from the average in more than 2%.
5.3. Flat classification
As previously mentioned, in the flat classification approach, a unique classifier is trained from a training dataset contain-ing instances associated with the classes non-spam, bad-mouthcontain-ing, pollution and local marketcontain-ing. Then, given a new instance to be classified, the classifier will assign to it one of these training classes.
Table 4shows the confusion matrix obtained as result of our experiments with the flat classification approach using the SVM classifier. Each presented value corresponds to the percentage ofXtips that were classified asYtip, whereXandYare the types of tips: non-spam (NS), local marketing (LM), pollution (PL) and bad-mouthing (BM). The boldfaced values in this matrix indicate the recall of the classes. As can be seen, 93:5%of non-spam, 74:6%of local marketing, 60:7%of pollution and 48:4%of bad-mouthing were correctly classified by SVM. Despite the good results achieved for the classes non-spam and
local marketing (recall>74%), a significant fraction of pollution and bad-mouthing tips were misclassified. Among these misclassification errors we have 28:2%of pollution and 19:3%of bad-mouthing that were incorrectly classified as non-spam. Moreover, bad-mouthing tips were erroneously classified as pollution in 30:4%of cases. As a summary of the classification
results with SVM, Micro-F1 value is 77:9%, which means that the classifier is predicting the correct class for almost 78%of the tips. The per-class F1 values are 87:8%, 81:1%, 62:9%and 54:3%, for non-spam, local marketing, pollution and bad-mouthing classes, respectively, resulting in a Macro-F1 equal to 71:5%.
Table 5shows the confusion matrix obtained as result of our experiments with the flat classification approach using Ran-dom Forest classifier. The recall of the classes are in bold font and indicate that 95:7%of non-spam, 77:6%of local marketing, 65:2%of pollution and 54:2%of bad-mouthing were correctly classified by Random Forest. Again, despite the good results achieved for the classes non-spam and local marketing (recall>77%), a significant fraction of pollution and bad-mouthing tips were misclassified. However, when compared with the results achieved by SVM classifier, we can note that the Random Forest classifier obtained the best recall values for all classes evaluated (non-spam, local marketing, pollution and bad-mouthing). In addition, regarding to Micro-F1 and Macro-F1 metrics, the Random Forest also outperformed the SVM classi-fier. It has achieved Micro-F1 = 81.2% and Macro-F1 = 75.5%, which was computed from the following per-class F1 values: 90:2%(for non-spam), 83:1%(for local marketing), 67:8%(for pollution) and 60:7%(for bad-mouthing).
5.4. Hierarchical classification
Although Random Forest has achieved the best results using the flat classification approach, we decided to evaluate both, Random Forest and SVM, in a hierarchical strategy because as the approaches are very different and, thus, the performance of the classifiers can be different as well.
As explained in Section5, we are considering a local classifier per parent node in the hierarchical approach. It means that, in the problem addressed here, two classifiers are trained. The first one is used to separate the classes of the first hierarchy
Table 4
SVM flat classification.
True label Predicted label
NS(%) LM(%) PL(%) BM(%)
NS 93.5 0.6 3.6 2.3
LM 5.3 74.6 18.9 1.2
PL 28.2 3.3 60.7 7.6
level (non-spam (NS) and spam (S)). It is trained from a training dataset which contains tips labelled as non-spam or spam. The second classifier is constructed to distinguish among local marketing (LM), pollution (PL) and bad-mouthing (BM) tips (spam child classes). In this way, it is trained from the same training dataset used by the first classifier excluding the non-spam tips and detailing the spam tips into local marketing, pollution and bad-mouthing.
Tables 6 and 7show the confusion matrix obtained as the result of the first phase and the second phase of the hierarchical classification approach using SVM, respectively.
The SVM final result of these two classification phases is aggregated in the confusion matrix presented inTable 8. In addi-tion, the SVM classifier has achieved Micro-F1 = 78.4% and Macro-F1 = 72.3% (computed from the following per-class F1 val-ues: 88:4%for non-spam, 81:2%for local marketing, 63:9%for pollution and 55:8%for bad-mouthing).
Similarly,Tables 9–11represent the results of the first phase, second phase and aggregated result of these two phases for the hierarchical classification approach using Random Forest, respectively. Again, when compared with the results achieved by SVM classifier, we can see that the Random Forest classifier obtained the best recall values for all classes evaluated.
Furthermore, when comparing Random Forest hierarchical classification results to the best flat classification results pre-sented inTable 5, we verify that, regarding to recall, despite the worse result achieved for the class non-spam, the hierar-chical approach provided better results for the classes pollution and bad-mouthing, which were the classes with the worst performance in all experiments. However, evaluating the global classification metrics, we can observe that the best results for flat classification approach (Micro-F1 = 81.2% and Macro-F1 = 75.5%) and the results for Random Forest hierarchi-cal classification approach (Micro-F1 = 81.2% and Macro-F1 = 75.7%, computed from the following per-class F1 values: 90:7%
for non-spam, 82:7%for local marketing, 68:2%for pollution and 61:2%for bad-mouthing) are almost the same. Thus, choos-ing an approach will depend only on what classes is desirable to prioritize in the performance of the classifier.
Table 5
Random Forest flat classification.
True label Predicted label
NS(%) LM(%) PL(%) BM(%)
NS 95.7 0.5 2.4 1.4
LM 5.3 77.6 16.6 0.5
PL 23.3 4.1 65.2 7.4
BM 17.2 1.4 27.2 54.2
Table 6
SVM hierarchical classification (first classification phase).
True label Predicted label
NS(%) S(%)
NS 91.5 8.5
S 16.1 83.9
Table 7
SVM hierarchical classification (second classification phase).
True label Predicted label
LM(%) PL(%) BM(%)
LM 78.2 21.2 0.6
PL 4.6 85.7 9.7
BM 1.4 40.0 58.6
Table 8
SVM final hierarchical classification results.
True label Predicted label
NS(%) LM(%) PL(%) BM(%)
NS 91.7 0.8 5.0 2.5
LM 4.7 74.7 19.7 0.9
PL 24.2 3.5 64.9 7.4
5.5. Impact of reducing the attribute set
In Section4.5we evaluated the relative power of the attributes considered in our dataset in discriminating each tip class from the others. However, as important as to understand the relevance of these attributes, is to assess whether competitive classification performance can be reached with fewer attributes and different sets of attributes. This type of analysis is important for the following reasons. First, since it is expected that the spammers will evolve and adapt their strategies to fool anti-spam systems, in the course of time, some attributes may become less important while others may gain impor-tance. Second, given the huge dimensions of the datasets related to social network applications, reaching accurate classifi-cation results from reduced datasets is desirable to speed up the classificlassifi-cation process and to improve the model’s interpretability.
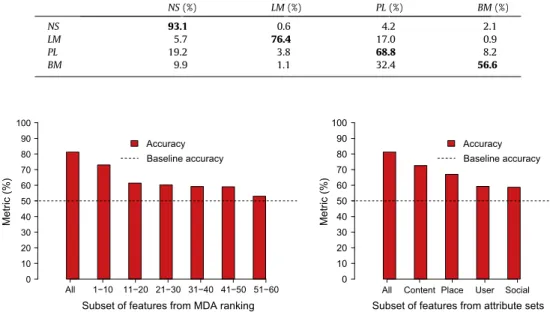
In order to evaluate the classifier performance considering different subsets of attributes, we conducted experiments using subsets of 10 attributes that occupy contiguous positions in the ranking (i.e., the first top 10 attributes, the next 10 attributes and so on) presented inTable 2. The plots show the accuracy value for all attributes, for different subsets of attri-butes and for a baseline classifier that considers all tips as non-spam. We also conducted experiments using subsets accord-ing to each set of attributes (content, user, place and social).Fig. 7shows the results of these experiments. We can note that our classification provides gains over the baseline for all subsets of attributes evaluated, i.e., even low ranked attributes have
Table 9
Random Forest hierarchical classification (first classification phase)
True label Predicted label
NS(%) S(%)
NS 93.8 6.2
S 13.2 86.8
Table 10
Random Forest hierarchical classification (second classification phase).
True label Predicted label
LM(%) PL(%) BM(%)
LM 81.1 18.0 0.9
PL 4.7 85.2 10.1
BM 1.5 35.8 62.7
Table 11
Random Forest final hierarchical classification results.
True label Predicted label
NS(%) LM(%) PL(%) BM(%)
NS 93.1 0.6 4.2 2.1
LM 5.7 76.4 17.0 0.9
PL 19.2 3.8 68.8 8.2
BM 9.9 1.1 32.4 56.6
Subset of features from MDA ranking
Metric (%)
0 10 20 30 40 50 60 70 80 90 100
All 1−10 11−20 21−30 31−40 41−50 51−60
Accuracy Baseline accuracy
Subset of features from attribute sets
Metric (%)
0 10 20 30 40 50 60 70 80 90 100
All Content Place User Social
Accuracy Baseline accuracy
some discriminatory power. In addition, significant improvements over the baseline can be reached even if only a set of attri-butes (e.g., content attriattri-butes) considered in our experiments can be obtained. This observations are important if we consider the high cost for computing some of the social attributes. We can see that if some attributes cannot be obtained, we are still able to obtain significant improvements over a baseline approach.
6. Concluding remarks
In this paper we approached the problem of detecting different kinds of tip spam in a popular Brazilian location-based social network. We crawled and manually analyzed a dataset of tips posted on Apontador, to label them as non-spam and spam tips, which are further labelled into three spam subclasses: local marketing, bad-mouthing, and pollution. In order to identify attributes able to distinguish these classes, we crawled the Apontador site to obtain information of places, users and the social graph of more than 137,000 users. Based on this dataset, we analyze the characteristics and behavior of dif-ferent types of users who are posting tip spam and we did a characterization of the tips of this labelled collection, unveiling several behavioral aspects of LBSNs users and their tip’s content that are able to differentiate tip classes. We then leverage our findings towards a supervised classification technique able to effectively distinguish among non-spam, local marketing, bad-mouthing, and pollution tips. Particularly, our flat classification approach was able to detect correctly almost 78%of the local marketing tips, 65%of pollution tips, 54%of bad-mouthing tips, wrongly classifying only about 4%of non-spam tips.
Thus, our proposed approach poses a promising alternative to simply considering all tips as non-spam or to randomly select-ing tips for manual inspection. We also investigated a hierarchical version of the proposed approach, which provided even better results for identifying the classes of pollution and bad-mouthing tips, which are the classes with the worst perfor-mance in all experiments. Finally, our experimental results show that even with a small subset of attributes (containing 10 attributes), our classification approach was able to reach high accuracy (73%). And our classification could produce sig-nificant benefits even when we used only one set of attributes, being the best performance for content attributes, with an accuracy of almost 73%.
We hope that the identification, characterization, differentiation of spam classes in LBSNs presented here may also have implications to other review-based systems and could be combined with other defence strategies. As example, we noted that bad-mouthing tips are posted to low rated places. Thus, after detecting bad-mouthing tips, one could try to differentiate if they are real tips from users that disliked the place or if they are related to a rating collusion attack. This could be done by using a rating defence mechanism, as Iolaus, proposed in[14].
Another important possibility that our approach unveils is related to the local marketing tips. We noted that local mar-keters are active users that create places, thus, contributing positively to the system in some aspects. By identifying them, the LBSN system could potentially offer them an agreement for advertising their services in certain places as ‘‘sponsored tips’’ instead of removing their tips from a place or even banishing them from the system.
As our final contribution, we make our labelled collection of tip spam available for the research community.
Acknowledgements
This research is partially funded by the Brazilian National Institute of Science and Technology for the Web (MCT/CNPq/ INCT Grant No. 573871/2008-6), and by the authors’ individual grants from CNPq, CAPES and FAPEMIG. The authors also would like to thank Apontador for the data provided, which made this research possible.
References
[1] Nearly 1 in 5 smartphone owners access check-in services via their mobile device. <http://bit.ly/mgaCIG>.
[2] A. Aggarwal, J. Almeida, P. Kumaraguru, Detection of spam tipping behaviour on foursquare, in: Proceedings of the 22Nd International Conference on World Wide Web Companion, WWW ’13 Companion, 2013, pp. 641–648.
[3] M. Araújo, P. Gonçalves, F. Benevenuto, M. Cha, ifeel: a system that compares and combines sentiment analysis methods, in: WWW (Companion Volume), International World Wide Web Conference (WWW’14), 2014.
[4]R. Baeza-Yates, B. Ribeiro-Neto, Modern Information Retrieval, ACM Press/Addison-Wesley, 1999.
[5] F. Benevenuto, G. Magno, T. Rodrigues, V. Almeida, Detecting spammers on twitter, in: 7th Annual Collaboration, Electronic Messaging, Anti-Abuse and Spam Conference (CEAS), 2010.
[6] F. Benevenuto, T. Rodrigues, V. Almeida, J. Almeida, M. Gonçalves, Detecting spammers and content promoters in online video social networks, in: Int’l ACM Conference on Research and Development in Information Retrieval (SIGIR), 2009, pp. 620–627.
[7]L. Breiman, Random forests, Mach. Learn. 45 (1) (2001) 5–32.
[8]S. Brin, L. Page, The anatomy of a large-scale hypertextual web search engine, Comput. Netw. ISDN Syst. 30 (1–7) (1998) 107–117.
[9] H. Costa, F. Benevenuto, L.H. de Campos Merschmann, Detecting tip spam in location-based social networks, in: Proceedings of the 28th Annual ACM Symposium on Applied Computing (SAC), 2013, pp. 724–729.
[10] H. Gao, J. Hu, C. Wilson, Z. Li, Y. Chen, B.Y. Zhao, Detecting and characterizing social spam campaigns, in: ACM Int’l Conference on Internet Measurement (IMC), pp. 35–47.
[11] S. Ghosh, B. Viswanath, F. Kooti, N.K. Sharma, K. Gautam, F. Benevenuto, N. Ganguly, K. Gummadi, Understanding and combating link farming in the twitter social network, in: Int’l World Wide Web Conference (WWW’12), 2012, pp. 61–70.
[12] P. Gonçalves, M. Araújo, F. Benevenuto, M. Cha, Comparing and combining sentiment analysis methods, in: Proceedings of the First ACM Conference on Online Social Networks, COSN ’13, 2013, pp. 27–38.
[13] N. Jindal, B. Liu, Opinion spam and analysis, in: ACM International Conference of Web Search and Data Mining (WSDM), 2008, pp. 219–230. [14] A.M. Kakhki, C. Kliman-Silver, A. Mislove, Iolaus: securing online content rating systems, in: Int’l World Wide Web Conference (WWW’13), 2013, pp.
[15] K. Lee, J. Caverlee, S. Webb, Uncovering social spammers: social honeypots + machine learning, in: ACM Int’l Conference on Research and Development in Information Retrieval (SIGIR), 2010, pp. 435–442.
[16] M. Ott, Y. Choi, C. Cardie, J.T. Hancock, Finding deceptive opinion spam by any stretch of the imagination, in: Proceedings of the 49th Annual Meeting of the Association for Computational Linguistics: Human Language Technologies, vol. 1, HLT ’11, 2011, pp. 309–319.
[17]I. Tsochantaridis, T. Joachims, T. Hofmann, Y. Altun, Large margin methods for structured and interdependent output variables, J. Mach. Learn. Res.
(JMLR) 6 (2005) 1453–1484.
[18] M. Vasconcelos, S. Ricci, J. Almeida, F. Benevenuto, V. Almeida, Tips, dones and to-dos: uncovering user profiles in foursquare, in: ACM Int’l Conference of Web Search and Data Mining (WSDM), 2012, pp. 653–662.
[19]I. Witten, E. Frank, Data Mining: Practical Machine Learning Tools and Techniques, Morgan Kaufman, 2005.