Introgression of
Opaque-2
and
Opaque-16
Genes Using
Molecular Assisted and Biochemical Development
Wenlong Zhang1,2,3¤, Wenpeng Yang1,4*, Mingchun Wang1, Wei Wang1, Guiping Zeng5, Zhiwei Chen1,2, Yilin Cai2
1Guizhou Institute of Upland Food Crops, Guizhou Academy of Agricultural Sciences, Guiyang, Guizhou, China,2College of Agronomy and Biotechnology, Southwest University, Chongqing, China,3Guizhou General Seed Station, Guizhou Agricultural Committee, Guiyang, Guizhou, China,4Guizhou Key Laboratory of Agricultural Biotechnology, Guizhou Academy of Agricultural Sciences, Guiyang, Guizhou, China,5Agricultural College, Guizhou University, Guiyang, Guizhou, China
Abstract
The low lysine content of waxy maize cannot meet the nutritional requirements of humans, livestock, or poultry. In the present study, the high-lysine geneso2ando16were backcrossed intowxlines using the maize high-lysine inbreds TAIXI19 (o2o2) and QCL3021 (o16o16) as donors and the waxy maize inbred line QCL5019 (wxwx) as a receptor. In the triple-cross F1, backcross, and inbred generations, the SSR markers phi027 and phi112 within thewxand o2genes and the SSR marker umc1121 linked to theo16 gene were used for foreground selection. Background selection of the whole-genome SSR markers was performed for the selected individuals. The grain lysine content was determined using the dye-binding lysine method. The waxiness of the grain was determined with the I2-KI staining and dual-wavelength spectrophotometric analysis. The BC2F2generation included 7 plants of genotypewxwxo2o2O16_, 19 plants of genotypewxwxo16o16O2_, and 3 plants of genotypewxwxo2o2o16o16. In these seeds, the average amylopectin content was 96.67%, 96.87%, and 96.62%, respectively, which is similar to that of QCL5019. The average lysine content was 0.555%, 0.380%, and 0.616%, respectively, representing increases of 75.1%, 19.9%, 94.3%, respectively, over QCL5019. The average genetic background recovery rate of the BC2F3families was 95.3%, 94.3%, 94.2%, respectively. Among these 3wxwxo2o2O16O16families, 4wxwxo2o2O16o16 families, and 3wxwxo2o2o16o16 families, the longest imported parent donor fragment was 113.35 cM and the shortest fragment was 11.75 cM. No significant differences in lysine content were found between the BC2F4seeds and the BC2F3 seeds in these 10 families. This allowed us to increase the lysine content of waxy corn and produce seeds with excellent nutritional characteristics suitable for human consumption, animal feed, and food processing. This may be of significance in the breeding of high-quality corn and in improvement of the nutrition of humans, livestock, and poultry.
Citation:Zhang W, Yang W, Wang M, Wang W, Zeng G, et al. (2013) Increasing Lysine Content ofWaxyMaize through Introgression ofOpaque-2andOpaque-16 Genes Using Molecular Assisted and Biochemical Development. PLoS ONE 8(2): e56227. doi:10.1371/journal.pone.0056227
Editor:Turgay Unver, Cankiri Karatekin University, Turkey
ReceivedSeptember 30, 2012;AcceptedJanuary 7, 2013;PublishedFebruary 15, 2013
Copyright:ß2013 Zhang et al. This is an open-access article distributed under the terms of the Creative Commons Attribution License, which permits unrestricted use, distribution, and reproduction in any medium, provided the original author and source are credited.
Funding:This work was supported by the National Natural Science Foundation of China (No.30560079 and No.31160307; http://www.nsfc.gov.cn/Portal0/ default166.htm), the National Basic Research Program of China (No.2006CB708206; http://www.most.gov.cn/eng/index.htm) and the Special Foundation of Guizhou Academy of Agricultural Sciences (No.052, 2010; http://www.gzaas.org.cn/). The funders had no role in study design, data collection and analysis, decision to publish, or preparation of the manuscript.
Competing Interests:The authors have declared that no competing interests exist. * E-mail: [email protected]
¤ Current address: Pharmacy Department, Guiyang College of Traditional Chinese Medicine, Guiyang, Guizhou, China
Introduction
Waxy maize (Zea maysL. sinensis Kulesh), also known as sticky maize, is one of nine sub-types of maize, first found in China and later found in other regions in Asia [1,2]. In 1909, Collins published an accurate description of waxy maize [3]. The endosperm of the dried grain is opaque with a dull, waxy appearance. In 1922, Weatherwax found the waxy corn starch to be completely composed of branched, small-molecular-weight amylopectin [4]. In 1935, Emersonk and colleagues mapped the
wxgene in the long arm of chromosome 9, i.e., the 59 locus close to the centromere [5]. In 1943, Sprague discovered that the maize
wxmutant lacks amylose [6]. The major mutations in waxy maize are insertion mutation, deletion mutation, and EMS mutagenesis [7–10]. These mutations cause splicing errors and translation errors in pre-mRNA so that the Wx gene is not normally
expressed. TheWxgene encodes granule-bound starch synthase I (GBSS-I), which determines the amylose synthesis in maize endosperm and pollen [11]. Starch in the grains of normal corn (WxWx) was found to be composed of amylose (25%) and amylopectin (75%). The GBSS-I activity of the wx mutant decreased by 5% to 95%, resulting in lower amylose content in grain and waxy corns with various levels of amylose. Meng argued that the amylose content was less than 5% in waxy maize carrying the wx-a gene [12]. Zhang and colleagues suggested that the presence of thewxgene indicated that the amylose content would be between 0 and 5%, that thedu gene indicated that amylose content would be between 5% and 15%, and that theae gene indicated the amylose content would exceed 15% [13]. Sun and colleagues suggested that Wx was incompletely dominant towx
that it was difficult to achieve nearly 100% of amylopectin in waxy corn [15].
TheWxgene was first cloned and sequenced in 1986 [16]. This gene has a single copy in the maize genome with a 3.8 kb coding sequence of 14 exons and 13 introns [17]. The start codon is located in exon 2 and the stop codon is located in exon 14. These data laid the foundation for the research and application of theWx
gene, including the development of molecular markers within the gene in marker-assisted selection (MAS). The MaizeGDB website has published three SSR markers for the detection of theWxloci: Phi022, phi027 and phi061.
MAS can shorten the recessive gene transfer from generation to generation, accurately identify target genes, and be not subject to the influence of identification conditions and heterofertilization of the seed endosperm [18]. In recent years, MAS has been used successfully in the selection of crops resistant to insect pests and drought and in the improvement of crop quality using single gene selection, polymerization of multiple genes resistant to the same disease, polymerization of multiple genes resistant to different diseases, and polymerization of resistance genes and other genes [19–27].
The level and types of amino acids found in maize grain, especially essential amino acids, is an important indicator of nutritional quality [28]. Generally, the humans should take in 51 mg lysine per gram of protein [29]. This requires the lysine content be more than 0.5% in maize grain. Livestock and poultry feed must be 0.6–0.8% lysine [30]. Waxy maize has excellent taste, texture, and other culinary qualities, but its nutritional value is relatively low. A survey of 93 samples of waxy corn grown in
China’s Yunnan Province found them to have a lysine content of 0.24–0.34%. A survey of 40 temperate waxy corns, showed the lysine content to be 0.14–0.39% [31]. The currentopaque-2(o2) maize grain contains circa 0.4% lysine, which does not meet standards for either food or fodder. However, the gene pyramiding of theopaque-16(o16) ando2genes has been found to significantly increase lysine content [32,33].
The main purpose of this study was to improve the nutritional quality of waxy corn by backcrossing the two high-lysine geneso2
ando16intowxmaize line using the multi-gene MAS combined with biochemical techniques, to produce waxy seeds with high lysine content, and to promote high-quality corn breeding and development of relevant industries.
Materials and Methods
Parent Materials and Population Construction
TAIXI19 is an inbred line ofo2maize, the seed lysine content of which is about 0.43%. QCL3021 and QCL5019 are inbred lines ofo16maize and waxy maize, the seed lysine content of which are 0.32% and 0.28%, respectively. The methods used for analysis of lysine content are as follows.
The 350 kernels seeds of three F1 hybrid combinations were
generated using TAIXI19 as the female parent and QCL3021 as the male parent in the field. The 400 kernels seeds of two triple hybrid populations were generated using the F1 hybrid as the
female parent and QCL5019 as the male parent in the field. In the triple hybrid F1generation, the 400 kernels seeds were sown in the
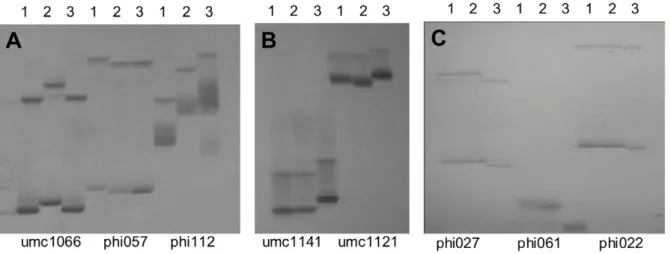
field and 375 plants emerged; the 83 target individual plants, Figure 1. Electrophoresis pattern of SSR markers among three parents for target genes.(A) pattern of SSR markers withinopaque-2gene; (B) pattern of SSR markers linked toopaque-16gene; (C) pattern of SSR markers withinwaxygene; 1, Taixi19; 2, QCL3021; 3, QCL5019.
doi:10.1371/journal.pone.0056227.g001
Table 1.Polymorphic SSR markers screened among QCL5019, Taixi19, and QCL3021 through whole genome in maize.
Chr. Bin
Number of markers
Polymorphic
markers Chr. Bin
Number of markers
Polymorphic markers
1 1.00–1.12 31 8 6 6.00–6.08 23 10
2 2.00–2.10 22 5 7 7.00–7.06 23 12
3 3.00–3.10 24 3 8 8.01–8.09 25 9
4 4.00–4.11 24 8 9 9.00–9.07 25 9
5 5.00–5.09 23 6 10 10.00–10.07 23 9
double heterozygous at the o2and o16 loci, were selected using foreground selection and used for backcross with recurrent parent QCL5019; 72 plants of them were harvested, and the 240 kernels seeds from the two plants, G31 and G167, were selected. In the BC1F1, the 240 kernels seeds were sowed in the field and 237
plants emerged; the 20 target plants with genotype of
wxwxO2o2O16o16 were selected using foreground selection and used for backcross with recurrent parent QCL5019; 14 plants of them were harvested, and the 220 kernels seeds from two plants, G31–101 and G167–181, were selected after background selection and quality analysis. In the BC2F1, the 220 kernels seeds were
sowed in the field, and 213 plants emerged; the 41 target plants with genotype ofwxwxO2o2O16o16were selected using foreground selection and selfed; 30 plants of them were harvested, and the 340 kernels seeds from six plants, 39, 51, G31-101-110, G31-101-130, G167-181-169, and G167-181-204, were selected after background selection and quality analysis. In the BC2F2generations, the 340 kernels seeds were sowed in the field,
and 285 plants emerged; the 232 wxwxO2_O16_ plants, 12
wxwxo2o2O16_ plants, 35 wxwxo16o16O2_ plants, and 6
wxwxo2o2o16o16 plants were selected using foreground selection and selfed; 142, 7, 19, and 3 plants were harvested from each group; and the seeds from the 7wxwxo2o2O16_plants (G31-101-51-67, G31-101-110-100, G31-101-110-120, G31-101-130-134, G31-101-130-135, G167-181-169-240, G167-181-204-263) and 3
wxwxo2o2o16o16plants (G31-101-51-62, G31-101-110-122, G167-181-204-261) were reserved after quality analysis. In the BC2F3
generation, these 10 families were grown by row in the field and their genotypes were verified using molecular markers; back-ground analysis was performed for the whole genome; and all of families were inbred to produce the BC2F4seeds.
DNA Extraction, PCR Amplification, and Electrophoresis
Young, seedling-stage leaves were collected for extraction of genomic DNA of individual plants of parents and each generation using the CTAB method for corn MAS [34]. PCR amplification and electrophoresis detection of amplification products was performed as reported previously [32,35]. PCR amplification was performed using a 2720 Thermal Cycler (Applied Biosystems, Foster City, CA, USA) and a DNA Engine Peltier Thermal Cycler (Bio-Rad, Hercules, CA, USA). Amplification products were separated using a Sequi-GenH GT DNA electrophoresis system (Bio-Rad).
Seed Lysine and Starch Content Measurement
Seed lysine content was measured using acid orange-12 dye-binding lysine colorimetry (DBL) [35]. Each sample was measured 2 or 3 times and the measurements were averaged. Seed waxiness was qualitatively and quantitatively determined using I2-KI
staining and dual wavelength spectrophotometry (DWLS), respec-tively [36,37]. For quantitative determination, the absorption spectra of amylose and amylopectin were scanned using SPECORD 40 (Analytik Jena AG, Jena, Germany). Three repeated measurements were performed and averaged.
Foreground Selection and Background Selection
Foreground selection (FS). FS refers to selection of the target geneso2,o16, andwx. Theo2gene was detected using the SSR markers phil12, umc1066, and phi057 within the gene [32]. The o16 gene was detected using the linked SSR markers umc1141 and umc1121 [32]. The wx gene was detected using the SSR markers phi022, phi027 and phi061 [38].
Table 2.Foreground selection for 3 segregating population using SSR markers.
Phi027 (wx) Phi112 (o2) Umc1121 (o16)
Generation
Number of
plants Wxwx wxwx O2O2 O2o2 O16O16 O16o16 Harvested
Three-way cross F1375 – – 198 177 94 83 72
BC1F1 237 115 122 75 47 27 20 14
BC2F1 213 – 211 119 92 51 41 30
doi:10.1371/journal.pone.0056227.t002
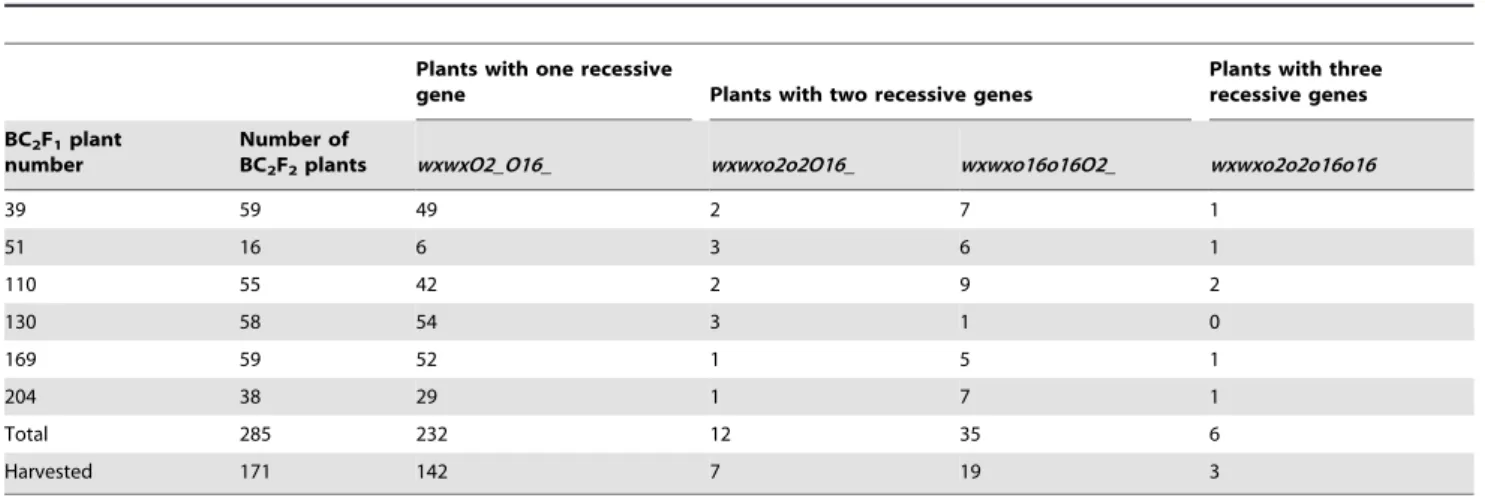
Table 3.Foreground selection for BC2F2population using SSR markers.
Plants with one recessive
gene Plants with two recessive genes
Plants with three recessive genes BC2F1plant
number
Number of
BC2F2plants wxwxO2_O16_ wxwxo2o2O16_ wxwxo16o16O2_ wxwxo2o2o16o16
39 59 49 2 7 1
51 16 6 3 6 1
110 55 42 2 9 2
130 58 54 3 1 0
169 59 52 1 5 1
204 38 29 1 7 1
Total 285 232 12 35 6
Harvested 171 142 7 19 3
Background selection (BS). BS refers to selection of the genetic background of the FS-selected individuals. Parental polymorphic SSR markers from genome-wide screening were used for BS. Polymorphic markers in the BS were divided into two categories. The first was a class of markers found to be polymorphic among the three parents. The second was a class of markers found to be polymorphic between the recurrent parent and the other donor parents but not between the two donor parents.
The PCR amplification primer sequences for the SSR markers in FS and BS were adopted from the Maizegdb website (http:// www.maizegdb.org) and synthesized by Shanghai Generay Biotech Co., Ltd (Shanghai, China).
Statistical Analysis
Electrophoresis band patterns A, B, H, and U of the SSR markers were used to establish the database. In the same migration position, a band pattern consistent with the recurrent parent was
recorded as A, while a band pattern consistent with the donor parent was recorded as B. A heterozygous band pattern was recorded as H and an unidentified band pattern was recorded as U. Based on the statistical analysis of genetic background recovery rate of molecular markers, the formula G (g) = [L+X (g)]/(2L) was used to calculate the background recovery rate of the FS-selected individuals after BS. Here, G (g) indicates the genetic background recovery rate in the backcross g-generation, X (g) the number of molecular markers with the band pattern of receptor parent in the backcross g-generation, and L the number of molecular markers included in the analysis [39–41]. The theoretical genetic background recovery rate was calculated using the formula E [G (g)] = 12(1/2)g+1
, where g refers to the number of backcross generations.
Analysis of variance and calculation of standard deviation were performed using SPSS13.0 software. The absorption spectra of amylose and amylopectin were plotted using Origin7.5 software. Table 4.Background analysis for 10 selected families in BC2F3.
BC2F3
familiy number
Recovery rate (%)
Donor parent genome (%)
Heterozygote genome (%)
Unidentified genome (%)
BC2F3
family number
Recovery rate (%)
Donor parent genome (%)
Heterozygote genome (%)
Unidentified genome (%)
62 94.6 4.2 0.6 0.6 134 95.2 3.0 1.8 0
67 96.3 1.8 1.9 0 135 94.6 2.4 2.4 0.6
100 94.6 3.6 1.2 0.6 240 95.8 3.0 0 1.2
120 96.3 1.8 1.9 0 261 94.6 3.0 1.2 1.2
122 93.4 4.8 0.6 1.2 263 94.0 4.2 1.2 0.6
doi:10.1371/journal.pone.0056227.t004
Figure 2. Graphical genotypes of 10 selected family lines in BC2F3on chromosomes 7, 8, and 9.(A) graphical genotype on chromosome
Graphical genotypes were analyzed and illustrated using GGT32 software with reference to an IBM2 2008 Neighbors Map.
Results
Polymorphism of SSR Markers at Target Loci and Whole Genome between the Parents
As shown in Figure 1, among 3 markers (umc1066, phi057, and phil12) of theo2gene, two marker loci (phi057, and phil12) were found to be polymorphic between TAIXI19 and the other two parents. Among the two markers in theo16 gene, the umc1121 locus showed polymorphism between QCL3021 with the other two parents. All 3 markers (phi027, phi061, and phi022) of thewx
gene showed polymorphism between QCL5019 and the other two parents. These polymorphic markers were codominant, which rendered them usable for the MAS of the corresponding target genes. In the present study, the markers phil12, umc1121, and phi027 were selected for FS.
Two hundred and sixty-six SSR markers distributed on the 10 chromosomes of the maize genome were selected for the screening of polymorphisms between the three parents. Of these markers, 49 were found to be polymorphic between QCL5019 and the other two parents, and 33 markers were found to be polymorphic among the three parents. A total of 82 markers were used for BS, with an overall polymorphism ratio of 30.8% (Table 1).
Foreground Selection of the Target Genes in Various Segregating Generations
Because phil12 and phi027 served as markers within the target gene and QCL5019 was the recurrent parent, in every segregating
generation of the triple-cross F1, BC1F1, and BC2F1, thewxlocus
of every individual was detected first, followed by theo2locus of
wx-selected individuals and the o16 locus of individuals selected from thewxando2loci. There were 83, 20, and 41 FS-selected individuals in the triple-cross F1, BC1F1, and BC2F1generations,
and 72, 14 and 30 plants were harvested from each group (Table 2).
In the BC2F2generation, seeds from 6 outstanding BC2F1plants
were selected for planting, and FS was performed for the three target loci. Among 285 individuals, 12 were selected from the
wxwxo2o2O16_ genotype, 35 from the wxwxo16o16O2_genotype, and 6 from thewxwxo2o2o16o16genotype. As shown in Table 3, seven, nineteen, and three plants were harvested from these three groups. In the BC2F3generation, the double-recessive and
triple-recessive gene pyramiding families obtained from the last generation were planted continuously. One row was planted for each family, and molecular markers at thewx,o2, ando16gene loci were detected and verified. Finally, in the BC2F4generation, 3
wxwxo2o2O16O16 families, 4 wxwxo2o2O16o16 families, and 3
wxwxo2o2o16o16families were produced.
Selection of Genetic Background Molecular Markers in Various Segregating Generations
In the BC1F1generation, the genetic background recovery rate
of selected individuals was 73.8–86.6% with an average of 81.8%. This was 6.8% higher than the theoretical value. Two individuals with a recovery rate of 84.8% were selected for backcrossing. In the BC2F1 generation, the genetic background recovery rate of
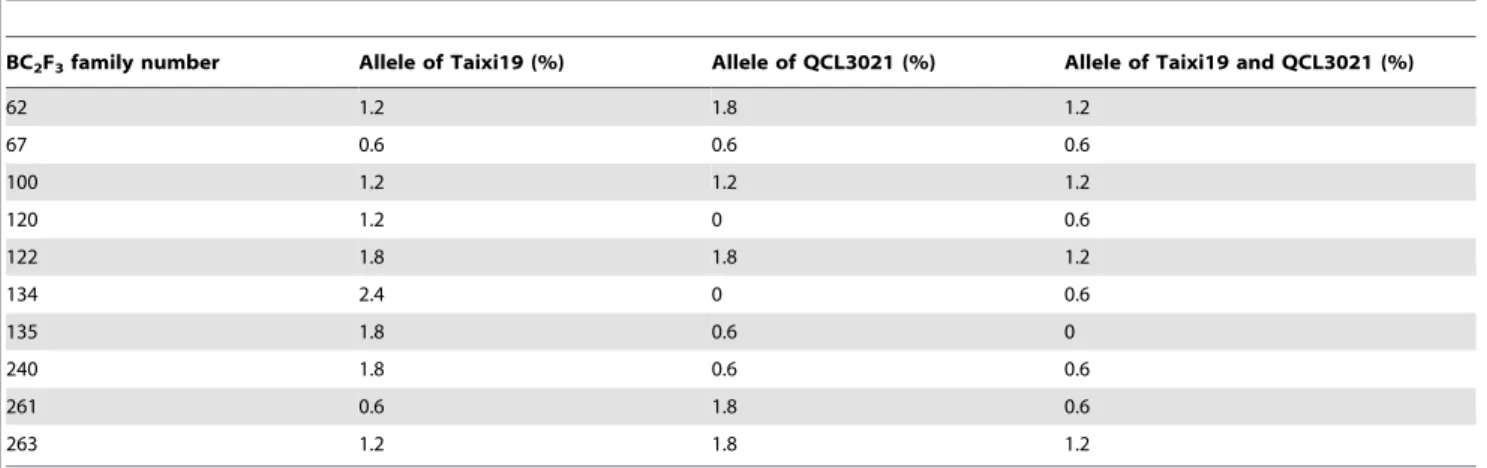
selected individuals was 85.9–92.7%, with an average of 90.42%. This was 2.92% higher than the theoretical value. The genetic Table 5.Proportion of donor parent allele of 10 selected families in BC2F3.
BC2F3family number Allele of Taixi19 (%) Allele of QCL3021 (%) Allele of Taixi19 and QCL3021 (%)
62 1.2 1.8 1.2
67 0.6 0.6 0.6
100 1.2 1.2 1.2
120 1.2 0 0.6
122 1.8 1.8 1.2
134 2.4 0 0.6
135 1.8 0.6 0
240 1.8 0.6 0.6
261 0.6 1.8 0.6
263 1.2 1.8 1.2
doi:10.1371/journal.pone.0056227.t005
Table 6.Lysine content of BC2F3seeds from four recessive genotypes in BC2F2.
BC2F2plant genotype
Number of samples
Range of lysine (%)
Lysine content (Mean
±SD) (%)
Difference from ‘‘o2o2’’(%)a
Difference from ‘‘o16o16’’(%)b
Difference from ‘‘wxwx’’ (%)c
wxwxo16o16o2o2 3 0.589–0.639 0.61660.025 31.9 69.2 94.3
wxwxO16_o2o2 7 0.505–0.592 0.55560.028 18.8 52.4 75.1
wxwxo16o16O2_ 17 0.323–0.404 0.38060.021 / 4.4 19.9
wxwxO16_ O2_ 142 0.282–0.367 0.33260.024 / / /
a,b,c:Differences from ‘‘o2o2,’’ ‘‘o16o16,’’ and ‘‘wxwx’’ (%) indicate the average lysine content of each recessive genotype relative to the parent lines. Values given are
background recovery rate of all the six plants selected from the BC2F1 generation was higher than 87.5%. The genetic
back-ground selection was not conducted in the BC2F2, and all the
sevenwxwxo2o2O16_plants and the threewxwxo2o2o16o16plants were chosen. The genetic background recovery rate of the 10 preferred families in the BC2F3generation ranged from 93.4% to
96.3% (Table 4).
The amount of donor parent genome in the 10 families of the BC2F3generation was between 1.8% and 4.8%. The amount of
heterozygote genome was 0–2.4%, and the amount of unidentified genome was 0–1.2%. Among the 10 families, families 67 and 120 had the highest genetic background recovery rate, and family 122 had the lowest recovery rate (Table 4). Family 122 also carried the longest donor fragment, which was 535.4 cM in length, and family Table 7.Lysine content of 10 selected families BC2F3seeds and their parental seeds.
BC2F3family
number Genotypea
Lysine content (Mean±SD) (%)
Difference from ‘‘o2o2’’(%)b
Difference from ‘‘o16o16’’(%)c
Difference from ‘‘wxwx’’(%)d
62 wxwxo16o16o2o2 0.58960.020 26.1 61.8 85.8
67 wxwxO16O16o2o2 0.50560.009 8.1 38.7 59.3
100 wxwxO16o16o2o2 0.59260.011 26.8 62.6 86.8
120 wxwxO16O16o2o2 0.53760.006 15.0 47.5 69.4
122 wxwxo16o16o2o2 0.63960.011 36.8 75.5 101.6
134 wxwxO16o16o2o2 0.55560.008 18.8 52.5 75.1
135 wxwxO16O16o2o2 0.55860.014 19.5 53.3 76.0
240 wxwxO16o16o2o2 0.57360.017 22.7 57.4 80.8
261 wxwxo16o16o2o2 0.62160.012 33.0 70.6 95.9
263 wxwxO16o16o2o2 0.56660.009 21.2 55.5 78.5
Taixi19 WxWxO16O16o2o2 0.46760.019 / 28.3 47.3
QCL3021 WxWxo16o16O2O2 0.36460.010 222.1 / 14.8
QCL5019 wxwxO16O16O2O2 0.31760.022 232.1 212.9 /
Normal hybrid WxWxO16O16O2O2 0.26560.014 243.3 227.2 216.4
a:Genotypes containingo2,o16, andwxloci were validated using phi112, umc1121, and phi027 markers. ‘‘o2o2’’ is the genotype of Taixi 19, ‘‘o16o16’’ is the genotype of
QCL3021, and ‘‘wxwx’’ is the genotype of QCL5019.
b,c,d:changes relative to ‘‘o2o2,’’ ‘‘o16o16,’’ and ‘‘wxwx’’ (%) indicate the average lysine content of each recessive genotype relative to the parent lines. Values are given in
relative increases and decreases. doi:10.1371/journal.pone.0056227.t007
Table 8.Lysine content of 10 selected families BC2F4seeds and their parental seeds.
BC2F4family
number
Genotypea Lysine content
(Mean±SD) (%)
Difference from
‘‘o2o2’’ (%)b Difference from‘‘o16o16’’ (%)c Difference from‘‘wxwx’’ (%)d
62 wxwxo16o16o2o2 0.60060.012 27.1 60.9 85.1
67 wxwxO16O16o2o2 0.52560.013 11.2 40.8 62.0
100 wxwxO16o16o2o2 0.58260.015 23.3 56.0 79.6
120 wxwxO16O16o2o2 0.56260.137 19.1 50.7 73.5
122 wxwxo16o16o2o2 0.66060.016 39.8 76.9 103.7
134 wxwxO16o16o2o2 0.56860.013 20.3 52.3 75.3
135 wxwxO16O16o2o2 0.54460.014 15.3 45.8 67.9
240 wxwxO16o16o2o2 0.57760.023 22.2 54.7 78.1
261 wxwxo16o16o2o2 0.61560.026 30.3 64.9 89.8
263 wxwxO16o16o2o2 0.57660.009 22.0 54.4 77.8
Taixi19 WxWxO16O16o2o2 0.47260.022 / 26.5 45.7
QCL3021 WxWxo16o16O2O2 0.37360.037 221.0 / 15.1
QCL5019 wxwxO16O16O2O2 0.32460.017 231.4 213.1 /
Normal hybrid WxWxO16O16O2O2 0.28860.046 240.0 222.8 211.1
a:Genotypes containingo2,o16, andwxloci were validated using phi112, umc1121, and phi027 markers. ‘‘o2o2’’ is the genotype of Taixi 19, ‘‘o16o16’’ is the genotype of
QCL3021, and ‘‘wxwx’’ is the genotype of QCL5019.
b,c,d:changes relative to ‘‘o2o2,’’ ‘‘o16o16,’’ and ‘‘wxwx’’ (%) indicate the average lysine content of each recessive genotype relative to the parent lines. Values are given in
67 carried the shortest donor fragment, which was 200.75 cM in length. Among all families, the longest fragment imported from the donor parents was 113.35 cM, and it was located on chromosome 3. The shortest fragment imported from the donor parents was 11.75 cM, and it was located on chromosome 1.
Graphical Genotype Analysis of the Chromosome of the Target Gene
The genetic background recovery rate on chromosome 7 in 10 families of the BC2F3 generation was 87.5–93.8%. The relative
amount of donor parent fragment was 0–6.25%, and the proportion of heterozygous fragment was 0–12.5%. The genetic background recovery rate on chromosome 8 was 90.9–95.5%. The proportion of the donor parent fragment was 0–4.5%, and the proportion of heterozygous fragment was 0–9.1%. The genetic background recovery rate on chromosome 9 was 95.0–100%. Except the individuals of 3 families (122, 240, and 261) had an unidentified fragment, the recovery rate of all the other individuals approached 100% (Figure 2).
Family 240 had the shortest foreign fragment imported on chromosome 7, families 120, 134, and 135 shared the shortest donor parent fragment, and family 240 had no imported heterozygous fragment. Family 100 had the shortest foreign fragment imported on chromosome 8, families 67, 100, 120, 134, and 135 had the shortest donor parent fragment, and families 62, 100, 122, 240, and 261 had no imported heterozygous fragment. Any imported foreign fragment was not found on chromosome 9, only 3 families contained an unidentified fragment (Figure 2).
Analysis of the Donor Allele in Ten Preferred Families
The imported donor parent genomes of 10 preferred families were divided into three types: B1 - consistent with the alleles of donor parent TAIXI19; B2 - consistent with the alleles of donor parent QCL3021; and B3 - consistent with the alleles of both donor parents. B1 made up 0.6–2.4% of the total, B2 0–1.8%, and B3 0–1.2% (Table 5).
The imported donor fragments distributed on chromosomes 1, 3, 4, 6, 7, and 8 contained the following 10 loci: umc1124 (1), umc1619 (1), umc2100 (1), umc2025 (1), phi053 (3), umc2188 (4), mc1014 (6), umc1672 (7), umc1213 (7), and bnlg1828 (8). Except for umc1619 and umc1672, which both had polymorphisms between recurrent parent and two donor parents, all 8 marker loci had polymorphisms between the three parents.
Lysine Content in Various Generations
The lysine content was 0.261–0.337% in 72 seeds of the BC1F1
generation, 0.278–0.362% in 14 seeds of the BC2F1generation,
and 0.346–0.549% in 30 seeds of the BC2F2 generation. In the
BC2F3generation, 171 seeds were harvested and 169 seeds were
measured for lysine content (see discussion section for usage of the other 2 seeds). Analysis of variance showed that the lysine content was significantly different between different genotypes (P,0.01). These were, from highest to lowest, wxwxo2o2o16o16. wxwxo2o2O16_.wxwxO2_o16o16. wxwxO2_O16_. They had an average lysine content of 0.616%, 0.555%, 0.323%, and 0.282% respectively. These values were 94.3%, 75.1%, and 19.9% higher, respectively, than those ofwxwxparent (Table 6). This indicates that the triple-recessive gene pyramiding families and double-recessive gene pyramiding families have significant positive interaction effects and that the regulatory role of theo2gene is greater than that of theo16gene. The lysine content ranged from 0.505% to 0.639% in 3 wxwxo16o16o2o2 families and 7
wxwxO16_o2o2 families; 59.3–101.6% higher than the recurrent parent; 8.1–36.8% higher than the high-value parento2line; and 38.7–75.5% higher than the low-value parento16 line (Table 7). No significant difference in lysine content was found between BC2F4seeds and BC2F3seeds (P.0.05) (Table 7 and 8), suggesting
that the lysine content tends to stabilize.
Qualitative and Quantitative Determination of Starch Content in Various Generations
The BC1F1, BC2F1, and BC2F2seeds selected by FS from the
triple-cross F1, BC1F1, and BC2F1generations were qualitatively
identified using I2-KI staining. Seeds whose endosperms were
stained umber were selected. The DWLS method was used to quantitatively determine the levels of amylose and amylopectin in seeds of the 10 selected families. Amylopectin made up 96.26– 97.06% of the total starch content. This is similar to the 96.84% observed in QCL5019. The total starch content was 53.94– 56.17%, which was lower than 67.62% in QCL5019 (P,0.01) (Table 9).
Discussion
In the present study, MAS technology was used to produce 3
wxwxo2o2o16o16families. In these families, average lysine content was found to reach 0.616% and the amylopectin content was Table 9.Starch and amylopectin content of 10 selected families BC2F3seeds.
BC2F3family number Genotype Total starch content (mean±SD) (%) Amylopectin content (mean±SD) (%)
62 wxwxo16o16o2o2 55.2160.55 97.0660.05
67 wxwxO16O16o2o2 54.8760.29 96.7760.08
100 wxwxO16o16o2o2 55.6260.16 96.4560.04
120 wxwxO16O16o2o2 56.1760.11 96.6160.12
122 wxwxo16o16o2o2 54.4460.39 96.9960.26
134 wxwxO16o16o2o2 54.6760.73 96.4560.05
135 wxwxO16O16o2o2 55.5560.19 96.3760.07
240 wxwxO16o16o2o2 54.1960.14 96.7460.06
261 wxwxo16o16o2o2 54.8660.48 96.8560.06
263 wxwxO16o16o2o2 53.9460.40 96.2660.05
QCL5019 wxwxO16O16O2O2 67.6260.68 96.8460.20
found to reach 96.62%. The lysine content in these seeds, which tend to be waxy, has met the needs of people, livestock, and poultry. These seeds are of some importance in the genetic improvement and breeding of special types of corn.
Recessive genes have their own specific genetic effects [42]. The interactions within the double-recessive or triple-recessive muta-tions formed by gene pyramiding can affect the quantity and quality of starch, sugar, and protein in the endosperm [43]. This can affect seed emergence, seedling growth, and flowering time agreement, causing a low level of FS selection and a reduced harvest after pollination. This increases the difficulty of selection and necessitates a large population for selection. In the present study, 340 kernels of seeds from 6 families were planted in the BC2F2 generation. Of these seeds, 285 emerged. Then 6
wxwxo2o2o16o16 plants, 12 wxwxo2o2O16_ plants, and 35
wxwxo16o16O2_plants were selected using FS. Finally, and 3, 7, and 19 plants were harvested from each of the three genotypic families.
Li and Liu argued that the double-recessive mutations formed byo2andwxwere not associated with significant changes in the total starch content of the grain [44]. However, in the present study, the total starch content of the seeds containing theo2gene with double-recessive (wxwxO16_o2o2) and triple-recessive (wxwxo16o16o2o2) mutations were 55.22% and 54.33%, respec-tively, significantly less than the recurrent parent QCL5019 (67.62%, P,0.01). This may be related to the differences in genetic background or to the hybrid model.
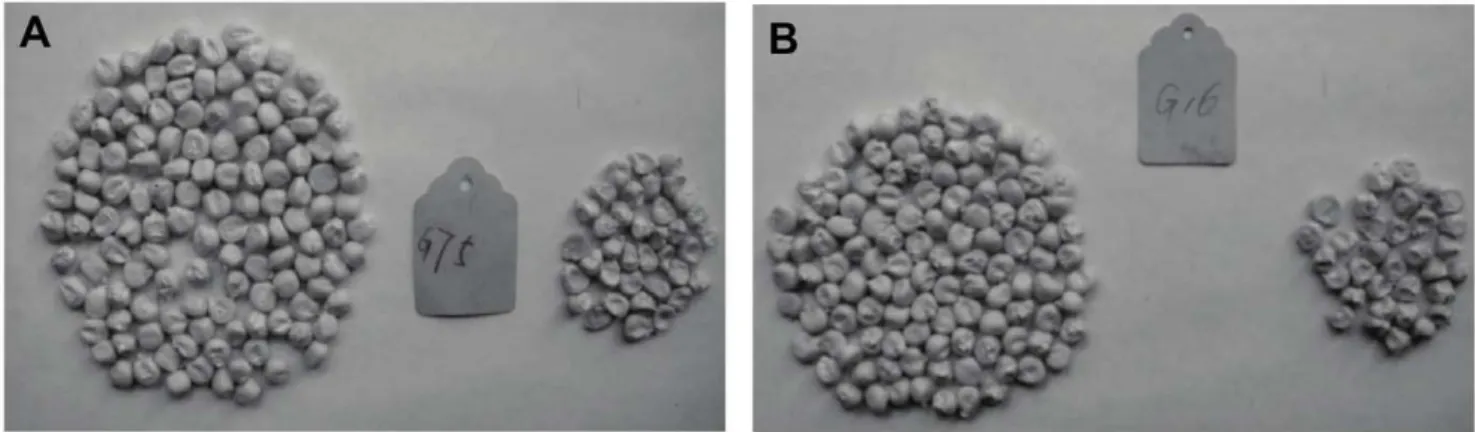
In the present study, the BC2F3 seeds of BC2F2 plants with
genotypes wxwxO16_ O2_ and wxwxo16o16O2_were plump and
smooth, but the BC2F3 seeds of BC2F2 plants with genotypes
wxwxO16_o2o2andwxwxo16o16o2o2were depressed and wrinkled. Two BC2F3 seeds from BC2F2 plants with the genotype
wxwxo16o16O2o2 were selected from 19 BC2F3 seeds from the
BC2F2 generation with the genotype wxwxo16o16O2_ (No. G75
and G16, Figure 3). Of these, 240 seeds were smooth and 70 seeds were wrinkled, with an indoor germination emergence of 205 and 45 plants, respectively. Using phi112 detection, the
wxwxo16o16O2o2andwxwxo16o16O2O2genotypes accounted for 97.6% of all smooth seeds, and 100% of shrunken seeds had the
wxwxo16o16o2o2 genotype. The same detection process was applied to two BC2F4seeds from BC2F3plants with the genotype
wxwxo16o16O2o2. Results showed the phenotype and genotype concordance rates to be 97.1% and 100%, respectively (Table 10). These findings indicate that the interactions between theo2andwx
genes in the endosperm cause the grain endosperm to shrink. The BC2F1seeds were obtained through a backcross with plants from
the BC1F1 generation of the genotype wxwxO16o16O2o2. Pale
yellow seeds with high lysine content (G89) were phenotypically selected for three seasons of continuous self-breeding and the pyramiding yellow grain was harvested. The genotypes of these yellow grains were the same as those of the above listed white grains. In this way, the goal of selection was reached through marker-assisted selection of the early generations combined with phenotypic selection of the subsequent generations. This may also reduce the cost of experiments.
The endosperm of theo2mutant is soft, fragile, rich in water, and readily susceptible to disease. The endosperm modifier gene can change soft endosperm into hard endosperm, and so mitigate Figure 3. Smooth and shrunken seeds of 2 family lines in BC2F3. (A) phenotype of BC2F3seeds from BC2F2plant with the genotype wxwxo16o16O2o2(G75); (B) phenotype of BC2F3seeds from BC2F2plant with the genotypewxwxo16o16O2o2(G16).
doi:10.1371/journal.pone.0056227.g003
Table 10.Phenotypes of 4 families seeds used for identifying relationships between phenotype and genotype.
Generation BC2F3 BC2F4
Family number G75 G16 W47 W54
Phenotype Smooth Shrunken Smooth Shrunken Smooth Shrunken Smooth Shrunken
Kernel 128 37 112 33 31 12 46 18
Seeding 106 25 99 20 28 6 41 7
Differencea 3 0 2 0 0 0 2 0
Coincidence rate (%) 97.2 100 98.0 100 100 100 95.1 100
aNumber of different kernels between phenotype and genotype.
these and other weaknesses. We used the modifier gene SSR marker umc1216 to detect the following 15 materials: TAIXI19 (o2o2), QCL3021 (o16o16), QCL5019 (wxwx), CML171 (modified
o2o2), (TAIXI196QCL3021) F1, (QCL50196QCL3021) F1,
(QCL5019 6 TAIXI19) F1, NANBEINUO (wxwx), G122
(wxwxo16o16o2o2), G261 (wxwxo16o16o2o2), G67 (wxwxO16O16o2o2), G134 (wxwxO16o16o2o2), CML162 (modified
o2o2), CML193 (modified o2o2), and QCL2179 (Normal). Our results showed that TAIXI19, QCL3021, QCL5019, CML171, (TAIXI19 6 QCL3021) F1, (QCL5 019 6 QCL3021) F1,
(QCL5019 6 TAIXI19) F1, G122, G261, G67, G134, and
CML162 had the same allele of the modifier gene, but NANBEINUO, CML193, and QCL2179, had another allele (Figure 4). This indicates that the wxwxo16o16o2o2 and
wxwxO16_o2o2families have excellent endosperm texture. In the 10 preferred families, except that 4 wxwxo2o2O16o16
families (G100, G134, G240 and G263) need to be purified atO16
locus, 3wxwxo2o2O16O16families (G62, G122 and G261) and 3
wxwxo2o2o16o16families (G67, G120 and G135) can be directly used in breeding programs because their recurrent parent QCL5019 has good combining ability, and used for pyramiding more other good traits.
Acknowledgments
The authors thank Guohu Liang, Hongsong Zao and Xiaolin Jiang for their participating partial experiments. We also thank the anonymous reviewers for their reviewing our manuscript.
Author Contributions
Conceived and designed the experiments: WY WZ. Performed the experiments: WZ MW GZ ZC. Analyzed the data: WZ WY. Contributed reagents/materials/analysis tools: WY WW YC. Wrote the paper: WZ WY.
References
1. Zeng MQ (1987) The Relationship of waxy maize in China. Crop breed resource, (3): 8.
2. Kuleshov NN (1954) Some peculiarities in the maize of Asia. (Original version in Russian, St-Petersbourg, 1928.) Annals of the Missouri Botanical Garden 41(3): 271–299.
3. Collins GN (1909) A new type of Indian corn from China. Bureau of Plant Industry (Bulletin) 161: 1–30.
4. Weatherwax P (1922) A rare carbohydrate in waxy maize. Genet 7: 568–572. 5. Neuffer MG, Coe EH, Wessler SR (1997) Mutants of maize. New York: Cold
Spring Harbor Laboratory Press. 63 p.
6. Sprague GF, Brimhall B, Nixon RM (1943) Some affects of the waxy gene in corn on properties of the endosperm starch. J Am Soc Agron 35: 817–822. 7. McClintock B (1963) Further studies of gene regulation in maize. Carnegie Inst
Wash Year Book 62: 486–493.
8. McClintock B (1964) Aspects of gene regulation in maize. Carnegie Inst Wash Year Book 63: 592–602.
9. Wessler SR, Tarpley A (1990) Filler DNA is associated with spontaneous deletions in maize. Proc Natl Acad Sci USA 87: 8731–8735.
10. Briggs RW, Amano E, Smith HH (1965) Genetic recombination with ethylmethane sulphonate induced waxy mutants in maize. Nature 207: 890–891. 11. Nelson OE, Rines HW (1962) The Enzymatic deficiency in the waxy mutation of maize.Biochemical and Biophysical Research Communications 9: 297–300. 12. Meng ZD (2001) Discussion on waxy corn breeding strategies. Journal of Maize
Sciences 9(4): 14–17.
13. Zhang JH, Yang XH, Zhang JY, Mi YH, Hua QJ (2006) Study on gross starch of grains of waxy corn landrace in Yunnan. Southwest china journal of agricultural sciences 19(4): 543–547.
14. Sun Z, Li JH, Yu TQ (1998) Effect of different glutinous genotypes of maize endosperm to the content of total and branched chain Starch. Journal of Beijing University of Agriculture 13(4): 1–8.
15. Liu J, Li WC (2005) Molecular mechanism of sweat and waxy maize. Journal of Maize Sciences 13 (2): 60–63.
16. Klosgen RB, Gierl A, Schwarz-Sommer Z, Saedler H (1986) Molecular analysis of thewaxylocus ofZea mays. Molecular and General Genetics 203: 237–244. 17. Mason-Gamer RJ, Weil CF, Kellogg EA (1998) Granule-bound starch synthase :
structure, function and phylogenetic utility. Molecular Biology and Evolution 15: 1658–1673.
18. Yang WP, Zheng YL, Wu J (2008) Heterofertilization of theopaque-2endosperm in maize. Hereditas 145: 225–230.
19. Ming R,Brewbaker JL, Pratt RC, Musket TA, McMullen MD (1997) Molecular mapping of a major gene conferring resistance to maize mosaic virus. Theor Appl Genet 95: 271–275.
20. Schneider KA, Brothers ME, Kelly JD (1997) Marker-assisted selection to improve drought resistance in common bean. Crop Sci 37: 51–60.
21. Bergman CJ, Fjellstrom RG, Mcclung AM (2000) Association between amylose content and a microsatellite marker across exotic rice germplasm. Rice Genetics Symposium 4: 22–27.
22. Sanchez AC, Brar DS, Huang N, Khush GS (2000) Sequence tagged site marker-assisted selection for three bacterial resistance genes in rice. Crop Sci 40: 792–797.
23. Zhang ZY, Chen X, Zhang C, Xin ZY, Chen XM (2002) Selecting the pyramids of powdery mildew resistance genes Pm4b, Pm13 and Pm21 in wheat assisted by molecular marker. Scientia Agricultura Sinica 35 (7): 789–793.
24. Hittalmani S, Parco A, Mew TV, Zeigler RS, Huang N (2000) Fine mapping and DNA marker assisted pyramiding of the three major genes for blast resistance in rice. Theor Appl Genet 100: 1121–1128.
25. Liu LW, Zhu XF, Guo WZ, Zhang TZ (2003) Pyramiding CMS fertility restoring geneRf1and transgeneBtwith molecular marker assisted selection in
Gossypium HirsutumL. Molecular plant breeding 1: 48–52.
26. He GM, Sun CQ, Fu YC, Fu Q, Zhao KJ, et al. (2004) Pyramiding of senescence-inhibitionIPTgene andXa23for resistance to bacterial blight in rice (Oryza sativaL.). Acta Genet Sin 31(8): 836–841.
27. Yang ZX, Jiang GH, Xu CG, He YQ (2004) Simultaneously improvement of resistance to bacterial blight and stem borer of 93–11 by molecular marker-assisted selection. Molecular plant breeding 2(4): 473–480.
28. Liu Z (2003) Method of quality comprehensive evaluate on fresh- eatable glutinous maize. Journal of Anhui technical teachers college 17(1): 32–36. 29. Zhai FL (1991) Breeding for crop quality. Beijing: Agriculture Press. 3–19 p. 30. Tian QZ, Li XH, Li MS, Jiang W, Zhang SH (2004) Molecular markers assisted
selection to quality protein maize. J Maize Sci 12 (2): 108–110,113. 31. Yang YF, Guo Q, Cheng J, Zheng XY, Lin CM (2009) Analysis of genetic and
quality traits of waxy corn inbred lines in China temperate zone. Acta Botanica Boreali-Occidentalia Sinica 29(11): 2213–2220.
32. Yang WP, Zheng YL, Zheng WT, Feng R (2005) Molecular genetic mapping of a high-lysine mutant gene (opaque-16) and the double recessive effect with opaque-2in maize. Mol Breed 15: 257–269.
33. Zhang WL, Yang WP, Chen ZW, Wang MC, Yang LQ, et al. (2010) Molecular marker-assisted selection foro2introgression lines witho16gene in corn. Acta Agron Sin 36(8): 1302–1309.
34. Yang WP (2005) Molecular mapping of a high-lysine mutant gene and analyses of heterofertilization ofo2endosperm and allelic variation ato2locus in maize. Ph.D. Dissertation of Huazhong Agricultural University.
35. Yang WP, Zheng YL, Ni S, Wu J (2004) Recessive allelic variations of three microsatellite sites within theO2gene in maize. Plant Mol Biol Rep 22: 361– 374.
36. He ZF (1981) Determination of amylose, amylopectin and total starch in grains by dual-wavelength spectrophotometry. Progress in Biochemistry and Biophysics 1: 70–72.
37. He ZF (1985) Quality of cereals and oils grains and their analytic technique. Beijing: Agriculture Press. 275–297 p.
38. Li XH, Bai L, Peng ZB, Tian ZG, Zhang SH (2003) Advance in breeding technique of waxy maize. Journal of Maize Sciences (Supplement): 14–16. 39. Hospital F, Chevalet C, Mulsant P (1992) Using markers in gene introgression
breeding programs. Genetics 132: 199–210.
Figure 4. Electrophoresis pattern of 15 materials at SSR marker umc1216 locus of an endosperm modifier.1, Taixi 19; 2, QCL 3021; 3, QCL 5019; 4, CML171; 5, (Taixi196QCL 3021)F1; 6, (QCL 50196QCL3021)F1; 7, (QCL 50196Taixi 19)F1; 8, Nanbeinuo; 9, G122; 10, G261; 11, G67; 12,
40. Xia JH, Zheng YL (2002) Molecular marker-assisted backcross breeding of maizeRf3NIL and its efficient analysis. Acta Agron Sin 28 (3): 339–344. 41. Fang MJ, Ding D, Yang WP, Xu SZ, Zheng YL (2005) The linkage drag analysis
of flankedopaque2by SSR marker in two maize BC1F1population. Acta Agron
Sin 31(10): 1359–1364.
42. Laughnan JR (1953) The effect of thesh2factor on carbohydrate serves in the mature endosperm of maize. Genetics 38: 485–499.
43. Xia T, Dou MA, Liu JL (1997) Studies on gene action of several endosperm mutants in maize (Zea maysL.). Acta Agronomica Sinica 23(6): 753–758. 44. Li XY, Liu JL (1993) The effects of maize endosperm mutant genes and gene
interactions on kernel components II. The interactions ofo2withsu1,sh2,bt2