when Estimating the Relationship between CD4 Count at
ART Initiation and Mortality
Matthew Fox1,2,3*, Owen McCarthy4, Mead Over4
1Center for Global Health and Development, Boston University, Boston, Massachusetts, United States of America,2Department of Epidemiology, Boston University School of Public Health, Boston, Massachusetts, United States of America,3Health Economics and Epidemiology Research Office, Department of Medicine, Faculty of Health Sciences, University of the Witwatersrand, Johannesburg, South Africa,4Center for Global Development, Washington, District of Columbia, United States of America
Abstract
Background:While CD4 strongly predicts mortality on antiretroviral therapy (ART), estimates from programmatic data suffer from incomplete patient outcomes.
Methods:We conducted a pooled analysis of one-year mortality data on ART accounting for lost patients. We identified articles reporting one-year mortality by ART initiation CD4 count. We estimated the average mortality among those lost as the value that maximizes the fit of a regression of the natural log of mortality on the natural log of the imputed mean CD4 count in each band.
Results:We found 20 studies representing 64,426 subjects and 51 CD4 observations. Without correcting for losses, one-year mortality was.4.8% for all CD4 counts,200 cells/mm3. When searching over different values for mortality among those lost, the best fitting model occurs at 60% mortality. In this model, those with a CD4#200 had a one-year mortality above 8.7, while those with a CD4.500 had a one-year mortality,6.8%. Comparing those starting ART at 500 vs. 50, one-year mortality risk was reduced by 54% (6.8 vs. 12.5%). Regardless of CD4 count, mortality was substantially higher than when assuming no mortality among those lost, ranging from a 23–94% increase.
Conclusions:Our best fitting regression estimates that every 10% increase in CD4 count at initiation is associated with a 2.8% decline in one-year mortality, including those lost. Our study supports the health benefits of higher thresholds for CD4 count initiation and suggests that reports of programmatic ART outcomes can and should adjust results for mortality among those lost.
Citation:Fox M, McCarthy O, Over M (2013) A Novel Approach to Accounting for Loss to Follow-Up when Estimating the Relationship between CD4 Count at ART Initiation and Mortality. PLoS ONE 8(7): e69300. doi:10.1371/journal.pone.0069300
Editor:Hiroshi Nishiura, The University of Tokyo, Japan
ReceivedDecember 10, 2012;AcceptedJune 7, 2013;PublishedJuly 30, 2013
Copyright:ß2013 Fox et al. This is an open-access article distributed under the terms of the Creative Commons Attribution License, which permits unrestricted use, distribution, and reproduction in any medium, provided the original author and source are credited.
Funding:This work was supported by Award Number K01AI083097 from the National Institute of Allergy and Infectious Diseases (Matthew Fox). The opinions expressed herein are those of the authors and do not necessarily reflect the views of the National Institutes of Health or NIAID. Mead Over and Owen McCarthy were financed by the Bill & Melinda Gates Foundation, through its support for the book, Achieving an AIDS Transition: Preventing Infections to Sustain Treatment, Washington: Center for Global Development, 2011. The funders had no role in study design, data collection and analysis, decision to publish, or preparation of the manuscript.
Competing Interests:The authors have declared that no competing interests exist.
* E-mail: [email protected]
Introduction
The rapid global expansion of antiretroviral treatment (ART) programs has led to an increase in the number of people initiated on treatment worldwide to over 5 million by the end of 2010 [1]. While substantial work remains to be done, evidence from resource-limited settings shows clinical, immunological and survival outcomes have generally been favorable[2–9].
As policy makers and program managers evaluate ways to improve treatment outcomes, and assess the long-term costs and benefits of treatment,[10–17] it is important to be able to accurately assess the role of starting CD4 count in determining overall mortality on treatment. Starting CD4 counts continue to average roughly 100 cells/ml [3,18] and low baseline and current CD4 count have been identified as major predictors of
Several approaches to adjusting estimates of mortality for losses have been developed[25–30]. Each can be used to adjust program specific data to estimate program effectiveness. However, as each aims to adjust the results of a single program for losses, none utilizes all the published data on first-year mortality and loss to follow-up to derive comprehensive estimates of the association between loss adjusted mortality and baseline CD4 count.
To better characterize the potential relationship between increasing starting CD4 count and mortality while at the same time accounting for programmatic losses, we estimated the relationship between one-year on treatment mortality and baseline CD4 count, with and without adjusting for losses. We propose a new approach to estimating mortality among those lost as the best-fitting adjustment to the relationship between observed mortality and baseline CD4 count.
Methods
Study Selection
We sought to estimate the expected one-year mortality proportion as a function of initiating CD4 count using data from the literature. To identify potential studies for inclusion we searched PubMed, Medline, Web of Science, and Cochrane Reviews for all articles reporting one-year mortality by CD4 count at ART initiation (search terms shown in Appendix S1 in File S1, studies shown in Appendix S2 in File S1). We used data on patients initiating first-line three-drug combination ART in sub-Saharan Africa. We excluded studies which: 1) did not report the ART initiation CD4 count for patients on which mortality was calculated; 2) included cohorts from outside sub-Saharan Africa; or 3) were explicitly focused on special patient groups (e.g. children, tuberculosis patients). We included estimates of mortality by CD4 count even when incomplete follow-up on patients existed and used imputation (see below) to adjust mortality estimates for missing outcomes. Because we wanted observed estimates of mortality, we made no assessment of quality. When two reports using the same dataset were found (N = 6), we used the one with the larger sample size. Our search resulted in 20 unique studies representing 64,426 total subjects.
Data Abstraction
We abstracted data on CD4 count, mortality and loss to follow-up from each study. While we sought to estimate the impact on one-year mortality of CD4 count as a continuous variable, most studies reported mortality by CD4 categories (e.g.,50, 50–100, etc.). For analysis, we considered each of the 51 CD4 categories from the 20 publications as unique observations. For each CD4 strata, we abstracted the upper and lower limits of the strata, one-year mortality, proportion of LTF and sample size. We found that roughly 80% of the data were from CD4 strata ,200. If the stratum-specific sample sizes were not stated, they were imputed from the study’s total sample size (see below).
Statistical Methods
Regression Model
To estimate mortality among those lost we assumed that the most important determinant of mortality, including among those lost, was their CD4 count at ART initiation. Furthermore, we hypothesized that loss of patients masks a portion of total mortality, in such a way that the correlation between CD4 count at initiation and mortality appears weaker than if all mortality were observed. Our estimation strategy was to search for the value of mortality among those lost that maximizes the correlation
between total mortality and CD4 at initiation. Our approach can be likened to a quasi-maximum likelihood estimation of the parameterUM(defined below) and our estimate of the parameter bis conditional on our estimate ofUM.
To accommodate the pronounced non-linearity we observed in the relationship between mortality and CD4 at initiation, we postulated a log-linear relationship between unobserved total mortality,TMij, and median observed CD4 count at ART initiation,CD4ij. The hypothesized relationship is as follows:
ln (TMij)~azb. ln (CD4ij)zeij ð1Þ
where subscriptsiandjrespectively index the published study and the CD4 band within the study. The superscript * designates an unobserved variable. The coefficientbis is the slope parameter for the CD4 count and is expected to be negative. It can be interpreted as the percentage decline in total mortality associated on average with a percentage point increase in initiating CD4. The variable is a random variable, which we assume to be normally distributed and uncorrelated withln(CD4ij)with variance
proportional to the number of individuals initiating ART within CD4 bandjof studyi.
Unobserved total mortality in CD4 bandjof studyTMij, is a weighted average of observed and unobserved mortality,OMijand
UMij, with the proportion lost in that band,LTFij, as the weight:
TMij~(1{LTFij).OMijz(LTFij .UMij) ð2Þ
where a superscript * again denotes an unobserved variable. As no study in our review reports LTF by CD4 at initiation, we approximatedLTFijby the overall study LTF,LTFi. We replaced
the unobservable mortality among those lost in equation (2) by the parameter we wish to estimate,UM, defined as the proportion of those lost who die during the year, assumed constant across all CD4 bands and studies. Equation (2) then becomes:
TMij~(1{LTFi).OMijz(LTFi.UM) ð3Þ
To estimateUM, the unobserved mortality among the LTF, we substitute a value between 0–1 into equation (3) to yield estimated values of total mortality,TMij. We use these estimated values of TM in place of the unobserved values on the left-hand-side of equation (1) and estimate the regression equation. We repeat this process until we find the value ofUMyielding the best-fit.
Our main analysis assumes that the unobserved mortality among patients lost is constant across CD4 strata. In reality, mortality among those lost likely varies by CD4 count. Because the unobserved mortality amongst those lost may vary by CD4 count, we fit a second model in which unobserved mortality increased with decreasing CD4 count. In this analysis we relaxed the assumption of a constant mortality rate among those lost by changing the method of estimation of the unobserved mortality and replaced the single parameter value for unobserved mortality with a function that varies with starting CD4. Where we previously incremented mortality rates among those lost to follow up according to equation (1), we now treat unobserved mortality as a linear function as:
Whereais the unobserved mortality among those with a CD4 count of 0 andhis the value of CD4 high enough for one-year mortality to be 0, i.e. 500 or above. We assumed that a= 0.85 since few patients who initiate treatment with a CD4 count of zero survive the year. We can then infer the unobserved mortality,UM, for any initial CD4 count in the data (CD4ij). We varied h in 100 cell increments from 500–1000 which gives us six slopes. In other words, by specifying the mortality of those with a CD4 count of 0 (the y-intercept, set at 85%) and the CD4 where mortality is zero (the x = intercept varied between 500–1000), we have a set of six linear functions, each with a unique slope. The slope of the lines decrease as the6intercept increases, so the largest (i.e., the steepest fall in mortality among those LTF) has the x-intercept of 500. As before, we used 1000 imputations. In order to find the slope of the line, we iterated the6intercept of starting CD4 count from 500 to 1000 in steps of 100.
Multiple Imputation
None of the included studies presents the median/mean CD4 count among thenijpatients in CD4 bandjof studyibut rather
they typically define a CD4 band by lower and upper bounds. This requires us to select a value of CD4ijto represent the CD4 count of thenijpatients in bandjof studyibefore we can implement our
estimation strategy. We address this problem with multiple imputation [31]. The complete estimation strategy, incorporating multiple imputation, consists of this sequence of steps shown in Table 1. We executed this estimation strategy twice, once using distributions for CD4 imputation informed by sample size and once uniformed by sample size (see Appendix S3 in File S1).
Results
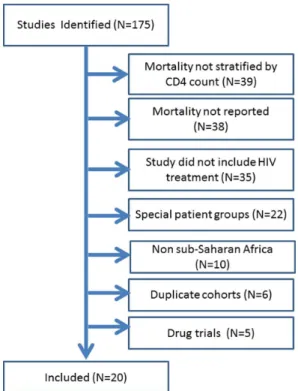
We identified 175 studies, of which 20 met our inclusion criteria (Figure 1). Table 2 shows characteristics of the 20 studies which gave data on 65,336 patients from 10 countries and 3 multi-country studies. Of the single-multi-country studies, 30% (5/17) were from Southern Africa. Reports ranged from a sample size of 101 to 11,776. The median starting CD4 count ranged from 65 to 150
cells/mm3. Overall reported mortality ranged from 1.3% to 18% while reported losses ranged from 0% to 32%.
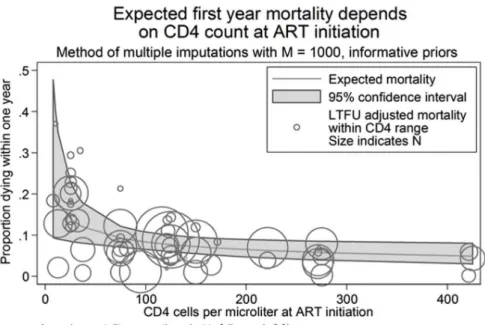
After imputing CD4 values, we plotted CD4 against mortality (Figures 2a and b). The circles in Figure 2a show reported one-year mortality (unadjusted for loss) by the average imputed CD4 count with circle size proportional to the observation’s sample size. This figure shows that lower CD4 counts are associated with higher one-year mortality with the highest mortality associated
Table 1.Estimation strategy.
Step Action
0 Set the value of unobserved mortality among LTF,UM, to zero.
1 Randomly select a value ofCD4ijto represent the median CD4 count in CD4 bandjof studyi, for alliandj. Imputed values are drawn from a specified beta distributions defined over the interval between the lower and upper bounds of the CD4 band (or if no upper bound, the lower bound plus 100). We use left-skewed distribution used to impute the median CD4 count in the highest (open ended) CD4 strata, right-left-skewed distributions for bands with 0 as a lower bound, and symmetric distributions for interior bands (shown in Appendix S3 in File S1).
2 Randomly impute values ofLTFifor two studies where LTFU was not reported.
3 Use equation (3) to compute the value of the dependent variable, ln(TMij).
4 Estimate equation (2) by weighted ordinary least squares of ln(TMij) on ln(CD4ij). To correct for heteroskedasticity, weight each observation by its sample size. For studies which did not report sample size by CD4 band (n = 5), randomly allocate total sample size across bands.
5 Repeat step 1–4 1,000 times
6 Combine the 1,000 estimated regression results to compute a pooled estimate ofb, its standard error and the F-statistic measuring the goodness-of-fit of the regression. Apply Rubin’s formula[35–37] to estimate the pooled standard error ofb:
SE(^bb)~
ffiffiffiffiffiffiffiffiffiffiffiffiffiffiffiffiffiffiffiffiffiffiffiffiffiffiffiffi
WzBzB=M
q
where W is the average within-imputation variance of^bb, andBis the variance of the estimator acrossM = 1,000imputations.
7 Repeat steps 1–6 10 times, incrementing the value ofUMby 0.1 each time
doi:10.1371/journal.pone.0069300.t001
Figure 1. Flowchart of identified studies, included studies and reasons for exclusion.
with CD4 counts 0–50 cells/mm3. The decline in mortality with increasing CD4 is steep up to roughly a baseline CD4 count of 50 cells/mm3and thereafter the reductions in mortality for starting ART at higher CD4 counts are reduced. The relationship is better illustrated in Figure 2b which plots mortality and CD4 count on the log scale and shows a roughly log-linear relationship between them. The estimated slope coefficient of 20.367 implies that a 10% increase in CD4 count at initiation is associated on average with about a 3.7% decline in observed mortality.
Predicted mortality by baseline CD4 count can also be seen in Table 3. Ignoring mortality among those lost and using distributions for imputing CD4 count uninformed by sample size (Table 3a, Row 1), predicted one-year mortality was highest among those with the lowest CD4 counts. Those with a CD4 count within the range at which most ART programs in resource-limited settings had been initiating patients onto ART without symptoms (i.e.#200 cells/mm3), one-year mortality was predicted to be above 3.5% at all values of baseline CD4 count below 500 and to increase sharply with lower CD4 count (e.g. those with baseline CD4 counts of 50 cells/mm3had a 7.6% predicted one-year mortality risk). For patients initiated at CD4 counts $200 cells/mm3, mortality drops more slowly from a risk of 3.9% for a baseline CD4 count of 350 cells/mm3 (the threshold many programs have or are soon switching to) to 3.5% for a baseline CD4 count of 500 cells/mm3. Comparing those starting ART with a CD4 count of 500 cells/mm3 to those with CD4 count of 50 cells/mm3 the risk of one-year mortality was reduced by nearly 60% (3.5% vs. 7.6%) with an absolute risk reduction of 4.1%.
Estimates using distributions for imputing CD4 count informed by sample size showed similar results (Table 3b, top row).
Each estimate of one-year mortality by baseline CD4 count presented so far ignores mortality among subjects lost (i.e.assumes 0% mortality among those lost), a scenario very unlikely to represent the true one-year mortality experience of all patients initiating ART. Figure 2b shows that while most observations fell close to our predicted line, several observations were far below it, partly because they do not account for mortality among those lost. We next fit a series of models assuming different values for mortality among those lost (ranging from 0 to 100% in increments of 10%) to identify the value of mortality among those lost which gave the best fitting model among the models we fit. As expected, overall one-year mortality (Table 3a and b) was lowest when assuming no mortality among those lost (i.e.naı¨ve estimate) and highest when assuming 100% mortality among those lost. When assuming 100% mortality among those lost, overall one-year mortality was predicted to be above 14% for those starting ART with a CD4 count#50 cells/mm3, however this model did not provide the best fit to the data among the models we fit.
As our assumption about the amount of mortality among those lost increases, the model shows better fit (as summarized by the F-statistic in Appendix S4 in File S1) up to 60%, then the fit became somewhat worse. The best fitting model among those we fit occurred assuming mortality among those lost was 60% and estimates that, in the range of CD4 counts covered in the included studies, a 10 percent increase in CD4 count at initiation is associated on average with a 2.8 percent decline in overall Table 2.Characteristics of 20 studies included in the meta-analysis of the relationship between baseline CD4 count and first year mortality on antiretroviral therapy.
Study, Year# Country N
Median Baseline CD4*
Number of CD4 strata
Lowest CD4 Strata
Highest CD4 Strata
Total % Mortality
Total Loss to Follow up**
Reported Follow up Time (months)
1 Barth, 2008 South Africa 606 67 4 0–50 .200 18 15 12
2 Bisson, 2008 Botswana 410 81 0 N/A N/A 8 21 11
3 Bourgeois, 2005 Cameroon 109 150 2 0–50 .50 8.3 2.8 16
4 Brinkhof, 2009 Multiple 10714 87–131 5 0–25 .200 8.8 7.1–31.7 24
5 Bussman, 2008 Botswana 633 67 2 0–50 .50 8.9 17.3 12
6 Calmy, 2006 Multiple 6961 89 5 0–15 .200 10 4.8 24
7 Cornell, 2009 South Africa 2023 102 4 0–50 .150 4.9 6.2 12
8 Culbert, 2007 Congo, D.R. 494 124 0 N/A N/A 5.4 7.9 12
9 Etard, 2006 Senegal 404 128 3 0–50 .200 11.7 1.7 12
10 Geng, 2008 Uganda 3628 95 0 N/A N/A 1.3 23 11
11 Lowrance, 2009 Rwanda 3194 141 0 N/A N/A 4.6 4.9 12
12 Marazzi, 2008 Multiple 3456 166* 3 0–50 .500 7.5 1.2 12
13 Mzileni, 2008 South Africa 2380 – 4 0–50 151–200 7.8 14.1 30
14 Mutevedzi, 2010 South Africa 5179 116 0 N/A N/A 3.7 10.9 12
15 Ojikutu, 2008 South Africa 298 65 4 0–20 .100 16 7.4 8
16 Seyler, 2003 Ivory Coast 101 135 2 0–50 .50 9.9 0 24
17 Stringer, 2006 Zambia 11776 143 4 0–50 .350 7.1 2 18
18 Toure, 2008 Ivory Coast 10211 123 4 0–50 .150 15 19 32
19 Weidle, 2002 Uganda 342 73 2 0–50 .50 16 24 12
20 Zachariah, 2006 Malawi 1507 123 2 0–50 .50 10.3 11.7 12
#
Full citations given in Appendix S2 in file S1. *Denotes mean not median.
mortality, including mortality among those lost to follow-up as well as those retained (Appendix S4 in File S1). These benefits to a higher initiation CD4 are larger than the 1.6 percent decline under the pessimistic assumption that all of those lost die during the first year.
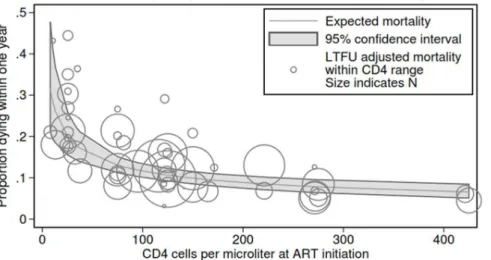
Figures 3a and b and the fourth row of tables 3a and 3b show predicted one-year mortality assuming 60% mortality among those lost. Figure 3b shows that under this assumption, observa-tions were much more tightly centered around the predicted values. The overall predicted line is shifted upwards and has a somewhat smaller downward slope (i.e.less reduction in mortality associated with increasing baseline CD4 count) compared with the naı¨ve model in Figure 2b assuming 0% mortality among those lost.
Table 3a row 4 shows predicted one-year mortality by baseline CD4 count under the best fitting model assuming 60% mortality among those lost and distributions for imputing CD4 counts uninformed by sample size. Here, those with a baseline CD4 count
#200 cells/mm3 had a predicted one-year mortality of roughly 8.7% or greater (e.g. 13.6% for those with a CD4 count of 50 cells/mm3) while those with a CD4 count
$500 cells/mm3had a one-year mortality risk #6.8%. Comparing those starting ART with a CD4 count of 500 to those at 50 cells/mm3the one-year risk of death on ART was reduced by 54% (6.8 vs. 12.5%), less than when assuming no mortality among those lost, but with a greater reduction in absolute risk (5.7%). In this model, regardless of baseline CD4 count, mortality was estimated to be greater than
Figure 2. Predicted one year mortality by average imputed* CD4 count at antiretroviral therapy initiation assuming no mortality among those lost to follow-up with mortality expressed using a) an unlogged axis and b) a natural log axis.* 1000 imputations were used for each analysis.
in the naı¨ve model assuming no mortality among those lost, ranging from a 23–94% increase (e.g. baseline CD4 count of 50 cells/mm3: 12.5% vs. 7.6% respectively and for a baseline CD4 count of 500 cells/mm3: 6.8% vs. 3.5% respectively).
Our model in which we allowed unobserved mortality among patients lost is constant across CD4 strata is presented in Figure 4. Using this method, we obtained a vector of unobserved mortalities, rather than a single value, that varies linearly with starting CD4. All six of the slopes produce stable, significant coefficients of similar magnitude to our primary results. Figure 4 shows the expected mortality from our best fitting model. The results differed little from our model assuming constant mortality, with approx-imately 30% one-year mortality among those with a CD4 count approaching 0 with a sharp decline to roughly 10% mortality among those with a CD4 count between 100 and 150 at ART initiation.
Discussion
This paper describes an approach to estimating the mortality experience over the first year on antiretroviral therapy as a function of baseline CD4 count. Our model which ignored loss to follow-up found that overall one-year mortality on ART in resource-limited settings was 7.6% among those initiated at CD4 counts of 50 and 3.5% in those initiated at a CD4 count of 500. Our findings are in line with a large analysis of data from sub-Saharan Africa by May and colleagues [32], but unlike previous analyses of this relationship, we also estimated predicted mortality among those lost and found that it adds substantially to observed mortality alone, across all starting CD4 counts.
Recently, WHO has recommended that resource-limited countries increase their initiating CD4 counts from 200 to 350
[33] and many countries are moving in this direction. Because to date so few programs have initiated patients onto ART at CD4 counts above 200 without a WHO stage III/IV condition, there is limited direct evidence from resource-limited settings to show the mortality benefits that could be achieved from increasing CD4 thresholds. [34,35] Our findings demonstrate that patients initiated at lower CD4 counts are still at highly increased risk of death during the first year on ART compared to those initiated at higher CD4 counts and suggest that increasing CD4 thresholds could reduce overall mortality in ART programs.
Our study used data primarily from program evaluations of large-scale public-sector treatment scale-up. In such settings it is extremely difficult to determine the outcomes of patients lost, but it is likely that they experience substantial mortality [24]. While several methods have been proposed for adjusting program mortality rates for losses, many require diverting limited resources to patient tracing [28] In this study, we searched over a range of assumptions about mortality among those lost to determine which assumptions best fit the data on observed mortality and loss rates. After accounting for mortality among those lost, in our best fitting model we found that the one-year mortality proportion among patients initiated at a CD4 count of 50 increased to 12.5%, roughly double our estimates ignoring those LTF. Among those initiated at a CD4 count of 350, mortality increased from 3.9% to 7.5%. Thus our method is in agreement with others that ignoring mortality among those lost can substantially underestimate total mortality [30] and lead to an overly optimistic estimate of program success.
It is of note that when adjusting mortality estimates for losses we found that the assumption of 60% mortality among those lost provided the best fit to the data. A meta-analysis by Brinkhof [24] estimated that roughly 45% of those lost had died. While it is not Table 3.Estimated mortality over the first year on antiretroviral therapy as a function of baseline CD4 count and assumptions about mortality among those lost to follow-up using beta distributions to impute CD4 counts that were a) uniformed by sample size and b) informed by sample size.
Estimated 1-year Mortality Proportion
CD4 count at antiretroviral therapy initiation, cells/mm3
Uninformed by sample size
1 50 150 200 350 500
Assumed mortality among those Lost to Follow up*
0 28.8 7.6 5.3 4.8 3.9 3.5
20 29.9 9.7 7.1 6.5 5.6 5.0
40 33.0 11.2 8.3 7.7 6.6 6.0
60 35.7 12.5 9.4 8.7 7.5 6.8
80 38.1 13.8 10.3 9.6 8.3 7.5
100 40.4 14.9 11.3 10.5 9.1 8.3
Informed by sample size
Assumed mortality among those Lost to Follow up*
0 32.7 7.8 5.2 4.7 3.8 3.3
20 34.2 10.2 7.3 6.7 5.6 5.0
40 37.9 12.0 8.7 8.0 6.8 6.1
60 41.3 13.6 10.0 9.2 7.8 7.1
80 44.4 15.1 11.2 10.3 8.8 8.0
100 47.3 16.5 12.3 11.4 9.8 8.9
clear from this analysis over what time period patients were lost in these studies and over what time period the mortality occurred, the finding, coupled with our finding, suggest that mortality among those lost is likely to be substantial. Given recent systematic reviews showing one year loss to follow-up to be between 20 and 25% percent [22] some adjustment should be attempted when reporting on programmatic treatment outcomes.
Our findings suggest that it is imperative that some adjustment be made to account for the impact of lost patients in our estimates of one year mortality. The results of this study suggest that a simple approach to gaining a rough guide to total mortality would be to
assume 60% mortality among those lost. While such estimates could only be used as a guide, they could give program managers a sense for how much additional mortality they are missing.
Our study combined data from nearly 65,000 patients and was able to incorporate mortality both on treatment and among those no longer in care. However, our study has several limitations. First, our estimate of mortality by initiating CD4 count included data from subjects enrolled onto ART in resource-limited settings at CD4 counts well above 200. During the period of published data, few programs in these settings enroll such subjects into care without a WHO Stage III or IV condition. These patients may be
Figure 3. Predicted one year mortality by average imputed CD4 count* at antiretroviral therapy initiation assuming 60% mortality among those lost to follow-up with mortality expressed using a) an unlogged axis and b) a natural log axis.* 1000 imputations were used for each analysis.
sicker than the general population of patients who could be initiated at CD4 counts above 200. Thus, our mortality proportions for higher CD4 counts are likely overestimates of the actual mortality that would be experienced by this group and thus even greater gains in mortality may be achieved if well patients are initialed at higher CD4 counts as has been seen elsewhere [34]. Second, in our corrections for mortality among those lost we assumed that the mortality rate among those who dropped out was either constant or a simple linear function of initial CD4. However, it is more likely that CD4 count at the time of leaving care is a strong predictor of death [26]. Future efforts to adjust for LTF should account for the distribution of CD4 count at the time of leaving care. Third, it is important to note that there is the possibility that mortality rates differ by important site-specific characteristics which were not included in this analysis. These include the program location, the mix of services provided, and the mix of site personnel. Other sources of variation would include changes in the patient mix over time as programs mature and starting CD4 counts rise. Our results do not account for this variation. Finally we note that since roughly 80% of the data used from this analysis was from CD4 strata,200 this is the area where the strongest conclusion can be drawn.
In conclusion, in a large meta-analysis, we found a strong increased risk of death associated with initiating ART at lower
CD4 counts over one year on ART in resource-limited settings. These risks increased substantially when accounting for mortality among those lost to follow-up. Our study supports increasing thresholds for CD4 count initiation and also suggests that reports of programmatic ART outcomes should attempt to adjust their results for mortality among those lost.
Supporting Information
File S1 File S1 includes Appendix S1, Appendix S2, Appendix S3, Appendix S4.Appendix S1: Search terms used to identify studies of one year mortality on antiretroviral therapy. Appendix S2: Full citations for studies reviewed. Appendix S3: Illustration of a distribution used to impute CD4 count with bands. Appendix S4: CD4 coefficient (bottom) and model fit (F-statistic – top) for the relationship between one year mortality on ART and baseline CD4 count using varying assumptions about the amount of mortality among those lost to follow-up.
(DOCX)
Author Contributions
Conceived and designed the experiments: OM MO. Analyzed the data: MPF OM MO. Wrote the paper: MPF. Revised the Manuscript: OM MO.
References
1. World Health Organization/UNAIDS/UNICEF (2010) Towards universal access: scaling up priority HIV/AIDS interventions in the health sector. Geneva: World Health Organization.
2. Stringer JS, Zulu I, Levy J, Stringer EM, Mwango A, et al. (2006) Rapid scale-up of antiretroviral therapy at primary care sites in Zambia: feasibility and early outcomes. JAMA 2006 296: 782–93.
3. Bussmann H, Wester CW, Ndwapi N, Grundmann N, Gaolethe T, et al. (2008) Five-year outcomes of initial patients treated in Botswana’s National Antiretroviral Treatment Program. AIDS 22: 2303–11.
4. Coetzee D, Hildebrand K, Boulle A, Maartens G, Louis F, et al. (2004) Outcomes after two years of providing antiretroviral treatment in Khayelitsha, South Africa. AIDS 18: 887–95.
5. Boulle A, Bock P, Osler M, Cohen K, Channing L, et al. (2008) Antiretroviral therapy and early mortality in South Africa. Bull World Health Organ 86: 678– 87.
6. Toure S, Kouadio B, Seyler C, Traore M, Dakoury-Dogbo N, et al. (2008) Rapid scaling-up of antiretroviral therapy in 10,000 adults in Cote d’Ivoire: 2-year outcomes and determinants. AIDS 22: 873–82.
7. Lowrance DW, Ndamage F, Kayirangwa E, Ndagije F, Lo W, et al. (2009) Adult clinical and immunologic outcomes of the national antiretroviral treatment
program in Rwanda during 2004–2005. J Acquir Immune Defic Syndr 52: 49– 55.
8. Lowrance DW, Makombe S, Harries AD, Shiraishi RW, Hochgesang M,et al. (2008) A public health approach to rapid scale-up of antiretroviral treatment in Malawi during 2004–2006. J Acquir Immune Defic Syndr 49: 287–93. 9. Brinkhof MW, Boulle A, Weigel R, Messou E, Mathers C, et al. (2009) Mortality
of HIV-infected patients starting antiretroviral therapy in sub-Saharan Africa: comparison with HIV-unrelated mortality. PLoS Med 6: e1000066. 10. Nattrass N (2006) What determines cross-country access to antiretroviral
treatment? Dev Policy Rev 24: 321–37.
11. UNAIDS (2007) Financial Resources required to Achieve Universal Access to HIV, Prevention, Treatment, Care and Support. Geneva: UNAIDS. 12. Stover J, Johnson P, Zaba B, Zwahlen M, Dabis F, et al. (2008) The Spectrum
projection package: improvements in estimating mortality, ART needs, PMTCT impact and uncertainty bounds. Sex Transm Infect 84 Suppl 1: i24–i30. 13. Stover J, Bertozzi S, Gutierrez JP, Walker N, Stanecki KA, et al. (2006) The
global impact of scaling up HIV/AIDS prevention programs in low- and middle-income countries. Science 311: 1474–6.
14. Over M (2008) Opportunities for presidential leadership on AIDS: From an emergency program to a sustainable policy. In: Birdsall N, editor. White House
Figure 4. Predicted one year mortality by average imputed CD4 count at antiretroviral therapy initiation assuming a changing mortality among those lost to follow-up depending on CD4 count at ART initiation.
and the World: A global development agenda for the next US President. Washington, D.C.: Brookings Institution Press.
15. Over M (2009) Prevention failure: The ballooning entitlement burden of US Global AIDS treatment spending and what to do about it. Revue d’Economie du De´veloppement 23: 37.
16. Over M, Marseille E, Sudhakar K, Gold J, Gupta I, et al. (2006) Antiretroviral therapy and HIV prevention in India: modeling costs and consequences of policy options. Sex Transm Dis 33: S145–52.
17. Over M, Revenga A, Masaki E, Peerapatanapokin W, Gold J, et al. (2007) The economics of effective AIDS treatment in Thailand. AIDS 21 Suppl 4: S105–16. 18. Egger M (2007) Outcomes of antiretroviral treatment in resource limited and industrialized countries. Presented at: 14th Conference on Retroviruses and Opportunistic Infections; 2008; Los Angeles.
19. Calmy A, Pinoges L, Szumilin E, Zachariah R, Ford N, et al. (2006) Generic fixed-dose combination antiretroviral treatment in resource-poor settings: multicentric observational cohort. AIDS 20: 1163–9.
20. Lawn SD, Harries AD, Anglaret X, Myer L, Wood R (2008) Early mortality among adults accessing antiretroviral treatment programmes in sub-Saharan Africa. AIDS 22: 1897–908.
21. Lawn SD, Little F, Bekker LG, Kaplan R, Campbel E, et al. (2009) Changing mortality risk associated with CD4 cell response to antiretroviral therapy in South Africa. AIDS 2009 23: 335–42.
22. Fox MP, Rosen S (2010) Patient retention in antiretroviral therapy programs up to three years on treatment in sub-Saharan Africa, 2007–2009: systematic review. Trop Med Int Health 15: 1–15.
23. Rosen S, Fox MP, Gill CJ (2007) Patient retention in antiretroviral therapy programs in sub-Saharan Africa: a systematic review. PLoS Med 2007 4: e298. 24. Brinkhof MW, Pujades-Rodriguez M, Egger M (2009) Mortality of patients lost to follow-up in antiretroviral treatment programmes in resource-limited settings: systematic review and meta-analysis. PLoS One 4: e5790.
25. Bisson GP, Gaolathe T, Gross R, Rollins C, Bellamy S, et al. (2008) Overestimates of survival after HAART: implications for global scale-up efforts. PLoS One 3: e1725.
26. Fox MP, Brennan A, Maskew M, MacPhail P, Sanne I. Using vital registration data to update mortality among patients lost to follow-up from ART
programmes: evidence from the Themba Lethu Clinic, South Africa. Trop Med Int Health 2010.
27. Boulle A, Van Cutsem G, Hilderbrand K, Cragg C, Abrahams M, et al. (2010) Seven-year experience of a primary care antiretroviral treatment programme in Khayelitsha, South Africa. AIDS 24: 563–72.
28. Geng EH, Emenyonu N, Bwana MB, Glidden DV, Martin JN (2008) Sampling-based approach to determining outcomes of patients lost to follow-up in antiretroviral therapy scale-up programs in Africa. JAMA 300: 506–7. 29. Yiannoutsos CT, An MW, Frangakis CE, Musick BS, Braitstein P, et al. (2008)
Sampling-based approaches to improve estimation of mortality among patient dropouts: experience from a large PEPFAR-funded program in Western Kenya. PLoS One 3: e3843.
30. Egger M, Spycher BD, Sidle J, Weigel R, Geng EH, et al. (2011) Correcting mortality for loss to follow-up: a nomogram applied to antiretroviral treatment programmes in sub-Saharan Africa. PLoS Med 8: e1000390.
31. Royston P, Carlin JB, White IR (2009) Multiple imputation of missing values: New features for mim. Stata Journal 9: 252–64.
32. May M, Boulle A, Phiri S, Messou E, Myer L, et al. (2010) Prognosis of patients with HIV-1 infection starting antiretroviral therapy in sub-Saharan Africa: a collaborative analysis of scale-up programmes. Lancet 376: 449–57. 33. World Health Organization (2010) Antiretroviral Therapy for HIV Infection in
Adults and Adolescents: Recommendations for a Public Health Approacy; 2010 Revision. Geneva: World Health Organization.
34. Severe P, Juste MA, Ambroise A, Eliacin L, Marchand C, et al. (2010) Early versus standard antiretroviral therapy for HIV-infected adults in Haiti. N Engl J Med 363: 257–65.
35. Fox MP, Sanne IM, Conradie F, Zeinecker J, Orrell C, et al. (2010) Initiating patients on antiretroviral therapy at CD4 cell counts above 200 cells/ml is associated with improved treatment outcomes in South Africa. AIDS 24: 2041– 50.
36. Rubin D (1972) A Non-Iterative Algorithm for Least Squares Estimation of Missing Values in Any Analysis of Variance Design. J Royal Stat Soc Series C (Applied Statistics) 21: 6.