A Comprehensive Approach to Identify Reliable
Reference Gene Candidates to Investigate the Link
between Alcoholism and Endocrinology in
Sprague-Dawley Rats
Faten A. Taki1, Abdel A. Abdel-Rahman2, Baohong Zhang1*
1Department of Biology, East Carolina University, Greenville, North Carolina, United States of America,2Department of Pharmacology, East Carolina University, Greenville, North Carolina, United States of America
Abstract
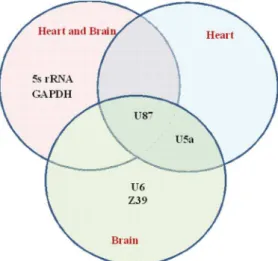
Gender and hormonal differences are often correlated with alcohol dependence and related complications like addiction and breast cancer. Estrogen (E2) is an important sex hormone because it serves as a key protein involved in organism level signaling pathways. Alcoholism has been reported to affect estrogen receptor signaling; however, identifying the players involved in such multi-faceted syndrome is complex and requires an interdisciplinary approach. In many situations, preliminary investigations included a straight forward, yet informative biotechniques such as gene expression analyses using quantitative real time PCR (qRT-PCR). The validity of qRT-PCR-based conclusions is affected by the choice of reliable internal controls. With this in mind, we compiled a list of 15 commonly used housekeeping genes (HKGs) as potential reference gene candidates in rat biological models. A comprehensive comparison among 5 statistical approaches (geNorm, dCt method, NormFinder, BestKeeper, and RefFinder) was performed to identify the minimal number as well the most stable reference genes required for reliable normalization in experimental rat groups that comprised sham operated (SO), ovariectomized rats in the absence (OVX) or presence of E2 (OVXE2). These rat groups were subdivided into subgroups that received alcohol in liquid diet or isocalroic control liquid diet for 12 weeks. Our results showed that U87, 5S rRNA, GAPDH, and U5a were the most reliable gene candidates for reference genes in heart and brain tissue. However, different gene stability ranking was specific for each tissue input combination. The present preliminary findings highlight the variability in reference gene rankings across different experimental conditions and analytic methods and constitute a fundamental step for gene expression assays.
Citation:Taki FA, Abdel-Rahman AA, Zhang B (2014) A Comprehensive Approach to Identify Reliable Reference Gene Candidates to Investigate the Link between Alcoholism and Endocrinology in Sprague-Dawley Rats. PLoS ONE 9(5): e94311. doi:10.1371/journal.pone.0094311
Editor:Turgay Unver, Cankiri Karatekin University, Turkey
ReceivedFebruary 10, 2014;AcceptedMarch 14, 2014;PublishedMay 13, 2014
Copyright:ß2014 Taki et al. This is an open-access article distributed under the terms of the Creative Commons Attribution License, which permits unrestricted
use, distribution, and reproduction in any medium, provided the original author and source are credited.
Funding:These studies were partly supported by NIH grant 2R01 AA014441 (Abdel-Rahman). The funders had no role in study design, data collection and analysis, decision to publish, or preparation of the manuscript.
Competing Interests:Co-author Baohong Zhang is a PLOS ONE Editorial Board member. This does not alter the authors’ adherence to PLOS ONE Editorial policies and criteria.
* E-mail: [email protected]
Introduction
Alcoholism is linked to many different health problems including cardiovascular and neurological impairments and increased cancer risks [1]. It is hard to dissect the mechanism of action of alcohol abuse because it depends on many factors, such as gender, developmental stage, dose, and duration of alcohol consumption [2]. A link between hormones and alcohol depen-dence was also previously proposed [3]. Studies show that alcohol altered the hormone levels (i.e. progesterone, estrogen) in pre- and post-menopausal females [4] and in ovariectomized monkeys [5]. The significance of endocrinology in the etiology and mecha-nism of alcohol dependence and addiction has long been discussed [3,6]. Transient and permanent hormonal changes might be key players in alcohol-associated pathologies such as breast cancer [7– 10] and neuro-remodeling phenomena like addiction [6]. These alcoholism-related diseases are promoted by fluctuations in gene expressions of some signaling pathways like estrogen and thyroid hormone receptors [9–11]. Researchers utilized different model
systems, which include mice [12], rats [13], nematodes [14], fruit flies [15] to investigate the pathways involved in mediating alcohol’s impact on the body. Despite the number of studies on ethanol-associated symptoms, many questions remain unanswered and require further investigations on the behavioral, genetic, and biochemical levels.
Quantitative real-time PCR (qRT-PCR) is a gold-standard biotechnique for gene expression analyses. Despite the emergence of the next generation deep sequencing technology, qRT-PCR remains the validation tool of choice. Even though qRT-PCR is a mature biotechnique, it is greatly affected by RNA integrity, purity, and concentration, primer and enzyme efficiencies, genomic DNA contamination, pipetting errors, as well as the choice of proper internal controls (reference genes) [16]. Molec-ular analyses necessitate reliable normalization to avoid false positive results, which introduce data misinterpretations and imprecise conclusions. An ideal reference gene should have a stable basal expression in different tissues, genders, developmental stages, and experimental conditions and should have similar
expression levels to the target genes of interest [17]. So far, there is no one gene whose expression fulfills these criteria [18] although housekeeping genes (HKGs) were widely used as reference genes. The expression levels of HKGs are affected by various experi-mental conditions [19,20]. Thus, the identification of suitable reference genes is crucial and should precede gene expression analyses [17]. With this in mind, several statistical approaches have been designed to identify relatively more stable reference genes in response to specific experimental conditions. In this study, we evaluate the stability of 15 commonly used housekeeping genes using 5 statistical methods, which included geNorm [21], delta-Ct (dCt) method [22], NormFinder [23], and BestKeeper [24]. For more accurate ranking of the reference gene candidates, RefFinder was designed to provide a comprehensive ranking [25]. These programs ranked gene candidates based on pairwise comparisons (geNorm, dCt method, BestKeeper) as well as model-based approaches (NormFinder) to determine the most suitable genes.
Alcohol consumption is associated with adverse effects on the cardiovascular and neural systems. Based on the emergent roles of the hormone system in mediating alcohol-induced anomalies, we were interested in understanding the link between alcoholism and estrogen signaling in the heart and brain tissue of Sprague-Dawley rats. For that, we investigated the effect of chronic ethanol treatment on the stability of the expression levels of 15 housekeeping genes in rat heart and brain tissue for identifying most reliable genes as reference genes for gene expression analysis. To perform this study, we treated Sprague-Dawley rats with ethanol (ETOH). The effect of ethanol on the stability of 15 reference gene candidates (Table 1) was investigated using rats with different hormonal backgrounds. The study was based on 6 rat groups. Untreated female (SHAM) and male rats were used as controls. One group of rats underwent ovariectomy (OVX). The last group of rats was ovariectomized and then treated with estrogen hormone (OVXE2). Rats belonging to those two groups were divided into two subgroups. Half of OVX as well as OVXE2 rats served as control (no ETOH treatment), while the remaining rats received ETOH.
Materials and Methods
Animal Handling and Treatment
Animal use and handling protocols were pre-approved and complied with East Carolina University Animal Use and Care Committee guideline. Female and male Sprague-Dawley (SD) rats (9–10 weeks old; Harlan, Indianapolis, UN, USA) were used. Male rats served as control. Female rats were divided into ovariecto-mized without (OVX) or with and estrogen supplementation (OVXE2) and sham-operated (SO) groups. Ethanol treatment and tissue collection following euthanasia were performed as in our previous studies [26,27]. Tissue isolation quickly followed. Tissue was flash frozen by liquid nitrogen and then stored at280uC for subsequent molecular assays.
Sample Collection and RNA Extractions
Total RNA extraction was performed for heart and brain tissue weighing about 100–200 mg according to protocol using mirVana miRNA Isolation Kit (Life Technologies, CA, USA). Briefly, lysis buffer was added to each sample. The sample was kept on ice while being thoroughly homogenized. Then, an acid-phenol extraction separated RNAs from DNA and proteins. After adding 100% ethanol, the sample-ethanol mixture was passed through a glass-filter by centrifugation. Several washes preceded the elution of the RNA with DNase/RNase-free water. RNA was quantified and its purity was assessed using the NanoDrop ND-1000 Micro-Volume
UVVis Spectrophotometer (NanoDrop Technologies, Wilmington, DE).
Reverse Transcription and qRT-PCR
Reverse transcription was performed using TaqMan microRNA Reverse Transcription kit (Applied Biosystems, Foster City, CA). Poly(T) was used to reverse transcribe the protein coding genes, while specific RT primers were used for the non-coding genes. A total of 1000 ng RNA were used for each RT reaction. RT-PCR was performed in the thermal cycle at 16uC for 30 min followed by 42uC for 30 min, 85uC for 5 min and were finally held at 4uC. For subsequent qRT-PCR, 100 uL DNase/RNase-free water was added to each RT product.
ViiATMReal-Time PCR System (Applied Biosystem) was used to quantify the expression levels of 15 reference gene candidates on a 384-well-plate. SYBR Green PCR master mix was from SuperArray Bioscience Corp. (Frederick, MD). Specific reverse and forward primers were used (Table 1). Briefly, 5.5mL DNase/
RNase free water, 7.5mL SYBR Green master mix, 1mL cDNA (1 ug), 1mL primer mix were added to each well for a final 15 uL reaction. Four biological replicates were used. Initially, the reaction was set at 95uC for 10 min for enzyme activation and was followed by 40 two-step-cycles of denaturation for 15 sec at 95uC and an annealing/extension step for 60 sec at 60uC.
Data Analysis
Ct values were exported to an excel file. Descriptive statistics were performed in SPSS (20) and excel. More sophisticated analyses were performed using five statistical approaches: geNorm [21], delta-Ct (dCt) method [22], NormFinder [23], BestKeeper [24] and RefFinder [25].
To prepare geNorm [21] input, the minimal Ct value was used for normalization of all Ct values for each gene across all samples (Ctoriginal2Ctmin). Hence, the lowest value was zero. The difference was then transformed (22(Ctoriginal2Ctmin)). Data was structured such that the gene and sample symbols were in the first row and column, respectively. It was then used as input for geNorm applet. To determine the most stable gene pair, geNorm performs pairwise variation analyses (SD value) for each gene pair across all samples. The software assumes that the genes are not co-regulated and that the transformed expression values of an ideal gene pair are identical across all samples. Then, the geometric mean of the SD values for each gene-related pair combinations is used to compute an M-value. A lower M-value reflects higher gene stability. What follows is a step-wise exclusion of the gene pairs with the highest M-values to reach the most stable gene pair. A beneficial feature of geNorm output is the V-value that reflects the minimal number of genes required for reliable normalization. Such is based on calculating a normalization factor ratio starting with the most stable genes. The program follows a step-wise inclusion process (Vn/Vn+1) for more genes until there is no significant change in the normalization factor.
Delta-Ct (dCt) method [22] depends on a concept similar to that of geNorm. However, it does not require a program specialist and can be performed using an excel sheet. This method was designed to overcome limitations associated with small samples like difficulties in using the same standardized mRNA concentrations due to possible protein contaminations. Such technical problems are relieved as genes within one sample are compared to each other by calculating the dCt value. Sensibly, the gene pair with the same dCt value (smallest SD) across all samples is considered to be stable and vice versa. The average of all SD values for each gene set of pairwise combinations is used to rank the gene stability. Genes with lower average SD are more stable than others.
Reference Genes for Ethanol and Endocrinology Study
NormFinder [23] is unique as it takes into consideration not only the overall intergroup variation (i.e. control vs. treatment), but also, the intragroup variation (i.e. experimental group replicates). Sample subgroups are taken into account to calculate the most stable gene candidate. Their model adds the two sources of variation to determine the systematic error introduced by the investigated gene. Therefore, this approach is less sensitive to misleading expression patterns for coregulated genes. Meanwhile, the approach takes into account the candidates with less intergroup variations, which might be mistakenly disregarded in the pairwise approaches.
BestKeeper [24] determines the stability of the gene candidates based on the SD of the gene expression levels across samples. Then, genes with least variable Ct values are used for subsequent pairwise comparisons, while those with SD.1 are excluded. The geometric mean of the Ct values of the most highly correlated genes is used to calculate a BestKeeper index. Then, the software calculates Pearson correlation coefficient [r] with a P-value to determine the similarity in the expression levels among the candidates. Thus, genes with least SDs and highest correlation with the index are ranked as the most stable genes. This excel-based applet allows the comparison of only 10 gene candidates. Therefore, we excluded the genes (18S, B2m, BACT, GAD-D45AF, and TBP) ranked as the least stable using geNorm, dCt method and NormFinder.
RefFinder [25] is another web-based interface that was used to deduce the most stable gene candidates among all methods. For each gene, RefFinder calculates the geometric mean of the ranks calculated by each of the previous approaches. Genes with the lowest rank geometric mean are considered as most stable.
Results
Comparing Gene Stabilities by Descriptive Statistics
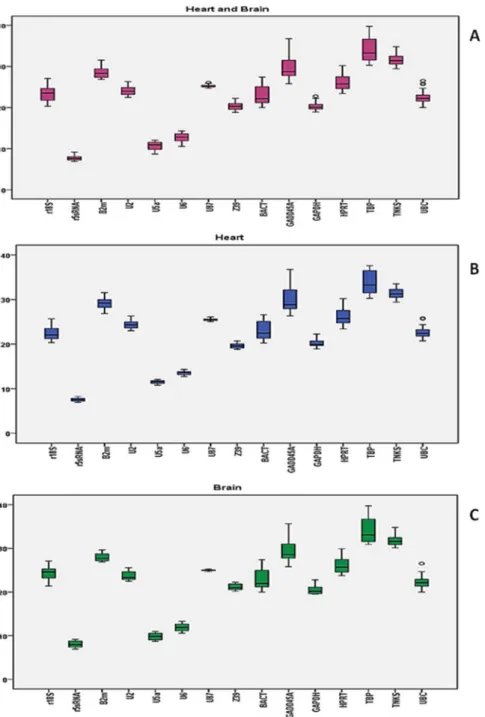
We calculated the mean and the standard derivation (SD) of the Ct values for heart and brain samples together, heart samples alone, and brain samples alone. In all combinations, GADD45A, TBP, BACT, 18S rRNA, and HPRT had the most variable expression levels reflected in their high SD values. On the other hand, TBP (Ctavg= 33.86), TNKS (Ctavg= 31.60), GADD45A (Ctavg= 29.69), B2m (Ctavg= 28.53), and HPRT (Ctavg= 26.12) had the highest Ct values and were therefore the least expressed among the gene candidates in the heart and brain (Figure 1; Tables 2 and 3). Thus, TBP, GADD45A, and HPRT are less likely to be good candidates for normalization.
Regardless of sample combination, the genes with highest expression levels were the same, which included Z39 (Ctavg= 20.38), GAPDH (Ctavg= 20.32), U6 (Ctavg= 12.69), U5a (Ctavg= 10.69), and 5S rRNA (Ctavg= 7.77). However, Z39, U6, 5S rRNA, U5a, and U87 had the least variation in their expression in heart and in brain, respectively. When considering the Ct values from both tissue, Z39, U2, GAPDH, 5S rRNA, and U87 had the lowest SD (Figure 1; Tables 2 and 3). Thus, U87, Z39, and 5S rRNA genes are more stable across groups and in all combina-tions. With this in mind, we can conclude that Z39 and 5S rRNA are likely to be used for normalization. However, a gene that is more highly abundant than the target genes of interest might mask true changes in expression if used for normalization. On the other hand, we can’t evaluate others like U87 solely based on basic statistics because even though its expression was the least variable, there is still ambiguity in evaluating its relative expression level. Thus, more sophisticated statistical approaches should be employed to evaluate a candidate reference gene.
Table 1.A summary of the 15 HKG (housekeeping genes) considered as reference gene candidates in SD rats.
Gene symbol
Locus tag
Gene description
Forward primer (59R39)
Reverse primer (59R39)
18S rRNA X01117 18S ribosomal RNA ACTCAACACGGGAAACCTCA TCTTAGTTGGTGGAGCGATT
5S rRNA K01594 5S ribosomal RNA ATCTCGTCTGATCTCGGAA TCTCCCATCCAAGTACTAACC
B2m NM_012512 beta-2 microglobulin AGTAGGAGGTGCTCGATGAAG TCCTGTAGAGCCAGCAACAGG
BACT NM_031144 actin, beta ACTCTGTGTGGATTGGTGGC CGCAGCTCAGTAACAGTCCG
GADD45AF NM_024127 growth arrest and
DNA-damage-inducible, alpha
TACACTGTGTGCTGGTGACG ATCACCGTTCGGGGAATCAC
GAPDH NM_017008
glyceraldehyde-3-phosphate dehydrogenase
TGACAACTTTGGCATCGTGG GGGCCATCCACAGTCTTCTG
HPRT NM_012583 hypoxanthine
phosphoribosyltransferase 1
GCCTAAAAGACAGCGGCAAG GGCTGCCTACAGGCTCATAG
TBP NM_001004198 TATA box binding protein
ACCTTATGCTCAGGGCTTGG GTGCCGTAAGGCATCATTGG
TNKS NM_001106084 TRF1-interacting ankyrin-related ADP-ribose polymerase
CCTACTCCTAGCACATGGCG AGGTAGGTAAGGCCTCAGGG
U2 K00781 small nuclear RNA ATCTGATACGTCCTCTATCC GTGGACGGAGCAAGCTCCTA
U5a K00783 small nuclear RNA ACTCTGGTTTCTCTTCAGATCG CAGAGTTGTTCCTCTCCA
U6 K00784 small nuclear RNA TTGGAACGATACAGAGAAG TTTGCGTGTCATCCTTGC
U87 AF272707 small nucleolar RNA ACAATGATGACTTATGTTTTTG GCTCAGTCTTAAGATTCTC
UBC NM_017314 ubiquitin C CTCGTACCTTTCTCACCACAGT GACACCTCCCCATCAAACCC
Z39 NR_002705 small nucleolar RNA GTACATGTGATGAAGCAAATC TACATCAGAAAGCGTTTACAG doi:10.1371/journal.pone.0094311.t001
Reference Genes for Ethanol and Endocrinology Study
Quantitative Analysis of Reference Candidates Based on GeNorm
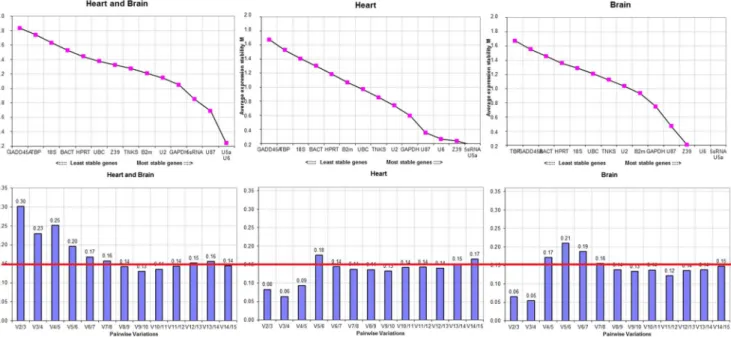
To determine the minimal number of genes required for normalization, we computed the V-value by geNorm. Starting with 2 genes, the software sequentially adds another gene and recalculates the normalization factor ratio. If the added gene does not increase the normalization factor ratio above the cutoff value (0.15), then the original pair of genes is enough for normalization. However, if the new ratio is above 0.15, then more genes should be included. We combined the heart and brain tissue for input in
geNorm. The first V-value,0.15 was after V7/8 (Figure 2B). This means that 6 additional genes were required for reliable normalization. The analysis started with a gene pair (i.e. 2 reference genes) and therefore the total would be 8 HKGs for normalization. That accounted for more than 50% of the gene list. In the following paragraphs, we analyzed the rankings based on 5 statistical methods using the input for combined Ct values from heart and brain tissue. For a higher stringency measure, we only considered the first 6 ranked genes (,50%) for further analyses. Figure 1. Descriptive statistics of Ct values for heart and brain samples.(A) 48 samples divided into 12 groups for heart and brain tissue combined. (B) 24 samples for 6 groups for heart tissue. (C) 24 samples for 6 groups for brain tissue. Mean Ct values calculated from raw qRT-PCR output for the 15 candidate genes in 6 experimental groups of SD rats (as described in methods). 50% of the values are included in the box. The median is represented by the line in the box. The interquartile range is bordered by the upper and lower edges, which indicate the 75th and 25th percentiles, respectively. The whiskers are inclusive of the maximal and minimal values, but exclusive of the outliers, represented as circles. doi:10.1371/journal.pone.0094311.g001
Reference Genes for Ethanol and Endocrinology Study
Determining Best Reference Candidates Based on GeNorm in Both Tissues
GeNorm bases its ranking on the geometric mean of the SD of each transformed gene set of pair combinations (M-value). The lower the M-value is, the higher the ranking. U5a and U6 were co-ranked as most stable genes (M = 0.24). In decreasing order, the third stable gene was U87 (M = 0.69) followed by 5S rRNA (M = 0.85), GAPDH (M = 1.05) and U2 (M = 1.15). The highest M-values ranged between M = 1.32 for UBC and M = 1.83 for GADD45A. Based on M-value, the other genes (HPRT, BACT, 18S rRNA, and TBP) were considered as the least stable genes with M-value between 1.15 to 1.32 (Figure 2A).
Determining Best Reference Candidates Based on dCt Method in Both Tissues
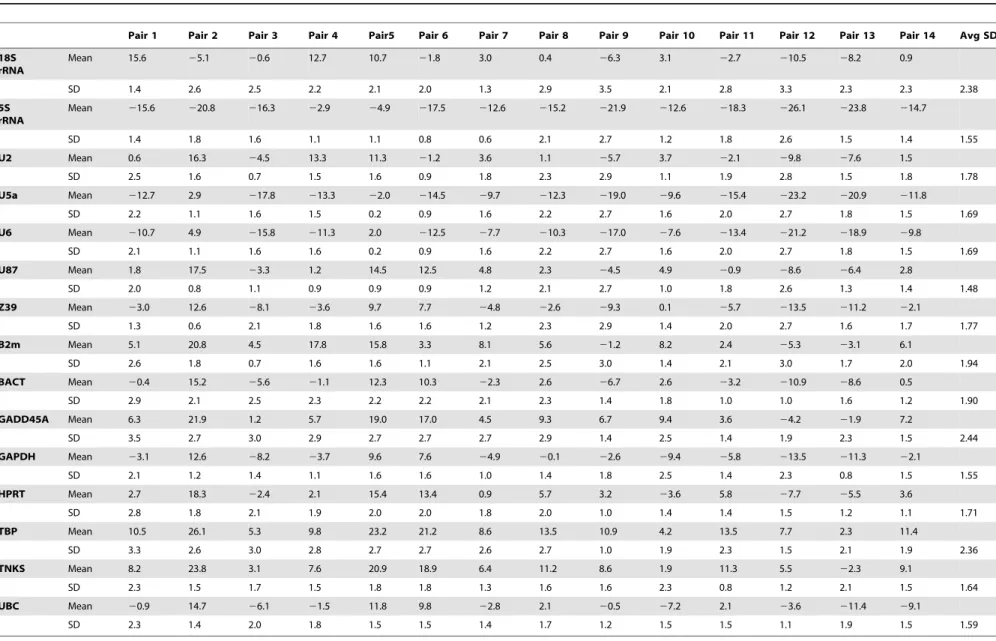
Gene ranking using the dCt method relies on relative pairwise comparisons. Using raw Ct values, the average SD of each gene set is inversely proportional to gene stability. As shown in Tables 4 and 5, U87 (1.48) was the top-ranked gene. 5s rRNA (1.55) was ranked second and was followed by GAPDH (1.56), UBC (1.59), TNKS (1.64) and U6 (1.69). Oppositely, GADD45A (2.43) 18S rRNA (2.37), and TBP (2.37) were ranked last, while B2m, BACT, and Z39 and were among the less stable genes (1.94–1.78). Table 2.The mean Ct values for each of the 15 gene candidates in descending order.
H+B Mean H Mean B Mean
TBP 33.86 TBP 33.81 TBP 33.90
TNKS 31.60 TNKS 31.35 TNKS 31.84
GADD45A 29.69 GADD45A 29.97 GADD45A 29.42
B2m 28.53 B2m 29.10 B2m 27.95
HPRT 26.12 HPRT 26.16 HPRT 26.07
U87 25.23 U87 25.46 U87 24.99
U2 24.02 U2 24.32 r18S 24.31
r18S 23.39 BACT 23.01 U2 23.72
BACT 22.95 UBC 22.65 BACT 22.89
UBC 22.47 r18S 22.47 UBC 22.29
Z39 20.38 GAPDH 20.17 Z39 21.16
GAPDH 20.32 Z39 19.60 GAPDH 20.47
U6 12.69 U6 13.49 U6 11.90
U5a 10.69 U5a 11.51 U5a 9.87
r5sRNA 7.77 r5sRNA 7.51 r5sRNA 8.03
The values for each input case are shown separately. doi:10.1371/journal.pone.0094311.t002
Table 3.The standard deviations (SD) for each of the 15 gene candidates in descending order.
H+B SD H SD B SD
GADD45A 2.67 GADD45A 2.94 TBP 2.73
TBP 2.58 TBP 2.48 GADD45A 2.41
BACT 2.07 BACT 2.05 BACT 2.13
r18S 1.80 HPRT 1.81 HPRT 1.71
HPRT 1.74 r18S 1.51 r18S 1.60
UBC 1.35 UBC 1.30 UBC 1.41
B2m 1.25 B2m 1.28 TNKS 1.28
TNKS 1.22 TNKS 1.14 U2 1.01
U6 1.05 GAPDH 0.90 GAPDH 0.94
U5a 1.02 U2 0.84 B2m 0.93
Z39 1.01 Z39 0.54 U6 0.85
U2 0.97 U6 0.45 U5a 0.76
GAPDH 0.93 r5sRNA 0.41 r5sRNA 0.75
r5sRNA 0.65 U5a 0.37 Z39 0.71
U87 0.32 U87 0.27 U87 0.14
The values for each input case are shown separately. doi:10.1371/journal.pone.0094311.t003
Reference Genes for Ethanol and Endocrinology Study
Determining Best Reference Candidates Based on NormFinder in Both Tissues
Complimentary to the pairwise comparisons, NormFinder tests the stability of genes within each sample group as well as between groups. When considering both heart and brain tissue, the total number of sample groups was 12, each having 4 biological replicates. U87 (0.76) was the gene with the least inter and intra-variation in expression levels; thus, U87 would be the most reliable reference gene. The stability values ranged from 0.82 to 1.11 for the other 5 candidate genes (UBC, GAPDH, 5S rRNA, TNKS, and HPRT) (Table 5). Interestingly, based on geNorm, UBC and HPRT were among the least stable genes. This result is based on low intragroup, yet similar intergroup variation. Recalling the model-based approach, NormFinder prevents the exclusion of genes which might have consistent intergroup expression levels. Not necessarily ‘similar’, these genes have ‘minimal’ intergroup as well as intragroup variation. Nevertheless, a drawback in NormFinder is the requirement of a minimum of 8 samples/ group. For many gene expression studies including our own, it is challenging to have such a large sample size. Taken together, the differences in methodologies might be a reason behind the inclusion of these two genes among the most stable candidates.
Determining Best Reference Candidates Based on BestKeeper in Both Tissues
Due to the input size limitation, BestKeeper only analyzed 10 genes, which were ranked the most stable based on other three programs (geNorm, dCt method, and Normfinder). BestKeeper provided a two-way ranking, which separated the correlation of expression among the genes from the overall variations in expression levels (SD). From each approach, we considered the top 3 genes. Those computed to be highly correlated with p-values ,0.05 were UBC ([r] = 0.71), U6 ([r] = 0.70), and HRPT ([r] = 0.67) at p = 0.001. On the other hand, based on BestKeeper,
U87 (SD = 0.26), 5S rRNA (SD = 0.53), and GAPDH (SD = 0.74) had the least variable expression levels across all heart and brain samples. 5S rRNA was fairly but significantly correlated with the other genes ([r] = 0.47, p = 0.001), while the weaker correlation of U87 and GAPDH was not statistically significant (Table 6). Statistically speaking, this trend is sensible. When the homogeneity of a group increases, the variance (SD) decreases as in the case of U87, 5S rRNA, GAPDH, and Z39 and [r] tends to zero [28]. In fact, BestKeeper calculated the least SD values for these 4 genes. Thus, these genes will share less variation with the others in pairwise variation and will therefore have the least correlation coefficient. That does not render them unsuitable as reference genes candidates and stresses on the importance of taking both criteria ([r] and SD) to choose the best candidate(s). The inclusion of the top three from the [r]-based and SD-based ranking was consistent with 4 out of 6 best ranked genes in geNorm, and 5 out of 6 top genes in dCt-method and NormFinder (Table 5). In addition, consistent with NormFinder, UBC and HPRT were also ranked among the top 6 by BestKeeper (Table 6). Comparing among the different methodologies helped remove the doubt in NormFinder’s result which might have aroused from its require-ment of a larger sample size.
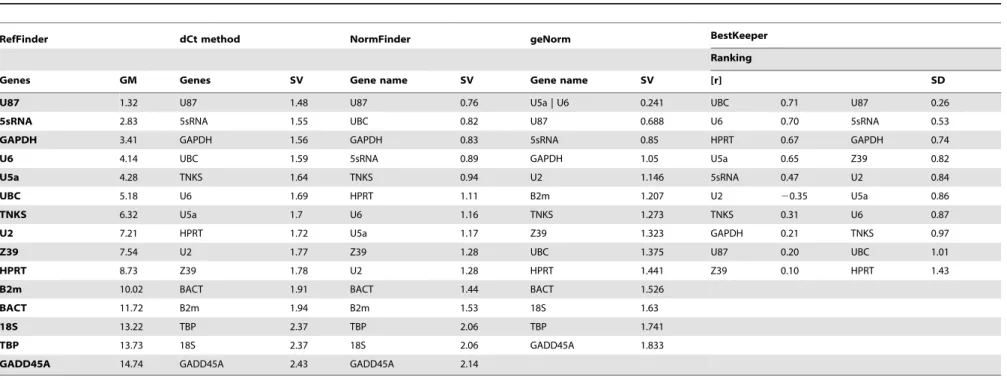
Comprehensive Ranking of Best Reference Genes Using RefFinder in Both Tissues
Based on the geometric mean (GM) of the rankings obtained from 4 complementary statistical approaches, U87 was the preferred candidate (GM = 1.32). The remaining highly ranked candidates were 5S rRNA, GAPDH, U6, U5a, and UBC with GM values ranging from 2.83 to 5.18, respectively. On the other hand, B2m, BACT, 18S rRNA, TBP, and GADD45A all had GM values higher than 10 (Table 5). These 5 candidates had the lowest ranking and less likely to serve as reliable reference genes for normalizing gene expression.
Figure 2. Quantitative and qualitative analysis based on geNorm.(A) Ranking of the 15 gene candidates based on the M-value. Three inputs were used for analysis: Heart and brain combined (48 samples/12 groups), heart alone (24 samples/6 groups), and brain alone (24 samples/6 groups). (B) Determination of the minimal number of reference genes based on V-value for the 3 input combinations. Y-axis represents the ratio of (Vn/Vn+1) where 0.15 is the cutoff value. X-axis: Vi/jwhere ‘‘i’’ starts with 2 genes and ‘‘j’’ starts with 3. geNorm starts by a gene pair, and tests whether the inclusion of a 3rdgene adds significant variation. This process is repeated to cover all the genes in the list.
doi:10.1371/journal.pone.0094311.g002
Reference Genes for Ethanol and Endocrinology Study
Table 4.Summary of mean and SD values of gene pairwise comparison using the dCt method for 15 reference gene candidates.
Pair 1 Pair 2 Pair 3 Pair 4 Pair5 Pair 6 Pair 7 Pair 8 Pair 9 Pair 10 Pair 11 Pair 12 Pair 13 Pair 14 Avg SD
18S rRNA
Mean 15.6 25.1 20.6 12.7 10.7 21.8 3.0 0.4 26.3 3.1 22.7 210.5 28.2 0.9
SD 1.4 2.6 2.5 2.2 2.1 2.0 1.3 2.9 3.5 2.1 2.8 3.3 2.3 2.3 2.38
5S rRNA
Mean 215.6 220.8 216.3 22.9 24.9 217.5 212.6 215.2 221.9 212.6 218.3 226.1 223.8 214.7
SD 1.4 1.8 1.6 1.1 1.1 0.8 0.6 2.1 2.7 1.2 1.8 2.6 1.5 1.4 1.55
U2 Mean 0.6 16.3 24.5 13.3 11.3 21.2 3.6 1.1 25.7 3.7 22.1 29.8 27.6 1.5
SD 2.5 1.6 0.7 1.5 1.6 0.9 1.8 2.3 2.9 1.1 1.9 2.8 1.5 1.8 1.78
U5a Mean 212.7 2.9 217.8 213.3 22.0 214.5 29.7 212.3 219.0 29.6 215.4 223.2 220.9 211.8
SD 2.2 1.1 1.6 1.5 0.2 0.9 1.6 2.2 2.7 1.6 2.0 2.7 1.8 1.5 1.69
U6 Mean 210.7 4.9 215.8 211.3 2.0 212.5 27.7 210.3 217.0 27.6 213.4 221.2 218.9 29.8
SD 2.1 1.1 1.6 1.6 0.2 0.9 1.6 2.2 2.7 1.6 2.0 2.7 1.8 1.5 1.69
U87 Mean 1.8 17.5 23.3 1.2 14.5 12.5 4.8 2.3 24.5 4.9 20.9 28.6 26.4 2.8
SD 2.0 0.8 1.1 0.9 0.9 0.9 1.2 2.1 2.7 1.0 1.8 2.6 1.3 1.4 1.48
Z39 Mean 23.0 12.6 28.1 23.6 9.7 7.7 24.8 22.6 29.3 0.1 25.7 213.5 211.2 22.1
SD 1.3 0.6 2.1 1.8 1.6 1.6 1.2 2.3 2.9 1.4 2.0 2.7 1.6 1.7 1.77
B2m Mean 5.1 20.8 4.5 17.8 15.8 3.3 8.1 5.6 21.2 8.2 2.4 25.3 23.1 6.1
SD 2.6 1.8 0.7 1.6 1.6 1.1 2.1 2.5 3.0 1.4 2.1 3.0 1.7 2.0 1.94
BACT Mean 20.4 15.2 25.6 21.1 12.3 10.3 22.3 2.6 26.7 2.6 23.2 210.9 28.6 0.5
SD 2.9 2.1 2.5 2.3 2.2 2.2 2.1 2.3 1.4 1.8 1.0 1.0 1.6 1.2 1.90
GADD45A Mean 6.3 21.9 1.2 5.7 19.0 17.0 4.5 9.3 6.7 9.4 3.6 24.2 21.9 7.2
SD 3.5 2.7 3.0 2.9 2.7 2.7 2.7 2.9 1.4 2.5 1.4 1.9 2.3 1.5 2.44
GAPDH Mean 23.1 12.6 28.2 23.7 9.6 7.6 24.9 20.1 22.6 29.4 25.8 213.5 211.3 22.1
SD 2.1 1.2 1.4 1.1 1.6 1.6 1.0 1.4 1.8 2.5 1.4 2.3 0.8 1.5 1.55
HPRT Mean 2.7 18.3 22.4 2.1 15.4 13.4 0.9 5.7 3.2 23.6 5.8 27.7 25.5 3.6
SD 2.8 1.8 2.1 1.9 2.0 2.0 1.8 2.0 1.0 1.4 1.4 1.5 1.2 1.1 1.71
TBP Mean 10.5 26.1 5.3 9.8 23.2 21.2 8.6 13.5 10.9 4.2 13.5 7.7 2.3 11.4
SD 3.3 2.6 3.0 2.8 2.7 2.7 2.6 2.7 1.0 1.9 2.3 1.5 2.1 1.9 2.36
TNKS Mean 8.2 23.8 3.1 7.6 20.9 18.9 6.4 11.2 8.6 1.9 11.3 5.5 22.3 9.1
SD 2.3 1.5 1.7 1.5 1.8 1.8 1.3 1.6 1.6 2.3 0.8 1.2 2.1 1.5 1.64
UBC Mean 20.9 14.7 26.1 21.5 11.8 9.8 22.8 2.1 20.5 27.2 2.1 23.6 211.4 29.1
SD 2.3 1.4 2.0 1.8 1.5 1.5 1.4 1.7 1.2 1.5 1.5 1.1 1.9 1.5 1.59
doi:10.1371/journal.pone.0094311.t004
Referenc
e
Genes
for
Ethanol
and
Endocrinology
Study
PLOS
ONE
|
www.ploson
e.org
7
May
2014
|
Volume
9
|
Issue
5
|
Table 5.A summary of ranking for reference gene candidates using 5 different statistical approaches.
RefFinder dCt method NormFinder geNorm BestKeeper
Ranking
Genes GM Genes SV Gene name SV Gene name SV [r] SD
U87 1.32 U87 1.48 U87 0.76 U5a | U6 0.241 UBC 0.71 U87 0.26
5sRNA 2.83 5sRNA 1.55 UBC 0.82 U87 0.688 U6 0.70 5sRNA 0.53
GAPDH 3.41 GAPDH 1.56 GAPDH 0.83 5sRNA 0.85 HPRT 0.67 GAPDH 0.74
U6 4.14 UBC 1.59 5sRNA 0.89 GAPDH 1.05 U5a 0.65 Z39 0.82
U5a 4.28 TNKS 1.64 TNKS 0.94 U2 1.146 5sRNA 0.47 U2 0.84
UBC 5.18 U6 1.69 HPRT 1.11 B2m 1.207 U2 20.35 U5a 0.86
TNKS 6.32 U5a 1.7 U6 1.16 TNKS 1.273 TNKS 0.31 U6 0.87
U2 7.21 HPRT 1.72 U5a 1.17 Z39 1.323 GAPDH 0.21 TNKS 0.97
Z39 7.54 U2 1.77 Z39 1.28 UBC 1.375 U87 0.20 UBC 1.01
HPRT 8.73 Z39 1.78 U2 1.28 HPRT 1.441 Z39 0.10 HPRT 1.43
B2m 10.02 BACT 1.91 BACT 1.44 BACT 1.526
BACT 11.72 B2m 1.94 B2m 1.53 18S 1.63
18S 13.22 TBP 2.37 TBP 2.06 TBP 1.741
TBP 13.73 18S 2.37 18S 2.06 GADD45A 1.833
GADD45A 14.74 GADD45A 2.43 GADD45A 2.14
48 samples were combined from heart and brain experimental groups as input.
Geometric mean (GM); Stability Value (SV); Pearson’s correlation coefficient ([r]); Standard Deviation (SD). doi:10.1371/journal.pone.0094311.t005
Referenc
e
Genes
for
Ethanol
and
Endocrinology
Study
PLOS
ONE
|
www.ploson
e.org
8
May
2014
|
Volume
9
|
Issue
5
|
RefFinder Ranking of Gene Candidates for Heart Hand Brain Tissue
The first analysis was performed for all samples together to identify a common reliable reference gene. Then, we also analyzed brain and heart samples separately to see whether or not there was a difference between tissues.
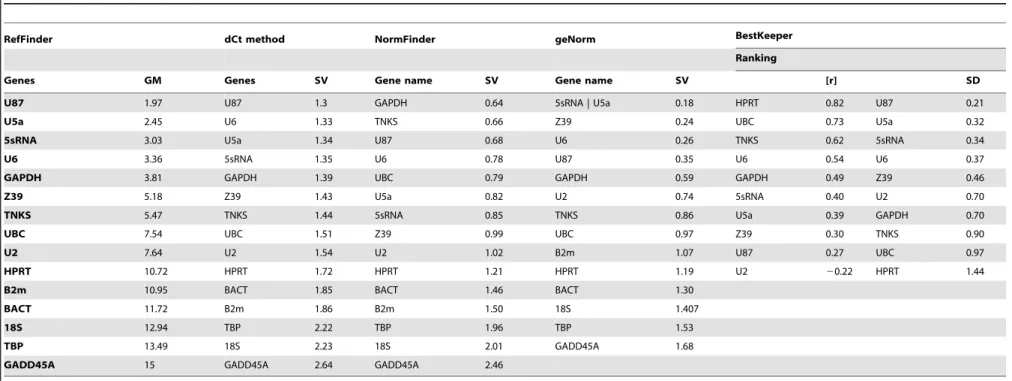
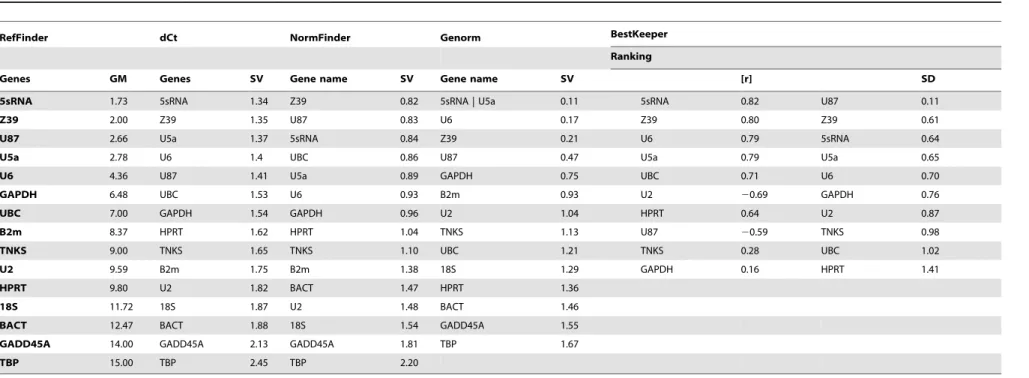
Based on RefFinder, the 6 most reliable reference genes were the same for brain or heart samples. However, their ranks were a little different between heart and brain. For heart tissue, the order of best reference genes was as follows: U87 (GM = 1.97), U5a (GM = 2.45), 5S rRNA (GM = 3.03), U6 (GM = 3.36), GAPDH (GM = 3.81) and Z39 (GM-5.18) (Table 7). However, 5s rRNA (GM-1.73) was the top ranked gene when using samples from the brain tissue; the following best candidates were Z39 (GM = 2.00), U87 (GM = 2.66), U5a (GM = 2.78), U6 (GM 4.36), and GAPDH (GM = 6.48) (Table 8).
Unlike the results from combined tissue, the first V-value,0.15 was at V2/3 (Figure 2). Thus, only 2 stable reference genes were needed for gene expression analysis in heart or brain tissue. A closer look at the data in Figure 2, the average of V-values for combined heart and brain tissue was 0.18. Individually, the average V-value for the heart and brain were 0.13 and 0.14, respectively. Thus, the gene candidates were merely more stably expressed in the heart tissue than in the brain tissues. However, though the genes’ expressions were consistent and stable within each tissue, it was different between the heart and brain. This can be inferred from the dramatic increase in the V-value average when both tissues were combined for analysis.
The top six most stable reference gene candidates were same for heart and brain tissues. The choice of the gene pair depends on the estimated expression levels of the targeted genes of interest. If the expression profiles of the genes of interest is unknown, then choosing reference candidates from the low and high extremes would be recommended such as U87 and 5S rRNA.
Discussion
Housekeeping genes are commonly used for normalizing gene expression because they are thought to be consistently expressed cross different tissues and among different treatment. However, this was challenged recently. Current studies show no one gene remains stable throughout all experimental conditions. Ideal reference genes vary with different species, strains, developmental stage, tissue and even different sampling times [29]. To maintain the integrity of qRT-PCR as a powerful ‘‘discovery’’ and ‘‘validation’’ biotechnique, the choice and the number of reference genes used should be customized to every experiment setting. Thus, the first task is to identify reference gene candidates from either systematic gene expression studies like microarrays or by compiling a gene list from previous studies with similar experi-mental conditions. Subsequently, their relative stability is com-pared using statistical approaches. In our study, we followed the same workflow to determine reliable reference genes in SD rats. Normalizing to the top-ranked genes will reveal possible roles of hormonal/gender differences, mainly estrogen levels, in alcohol-ism. Below, we highlight the significance of our study by discussing some shortcomings associated with employing single statistical approaches in reference gene identification. In the end, we show the advantages of our combinatorial approach and present recommendations of control gene candidates to use or to avoid in similar experimental settings.
Table 6. Ranking of 10 reference gene candidates based on BestKeeper. n G M [Ct] A M [Ct] m in [Ct] max [Ct] SD [ ± Ct] C V [% C t] [r] p-value Ranking [r] SD 5sRNA 48 7.74 7.77 6.91 9.20 0.53 6 .77 0.47 0.001 UBC U87 U2 48 24.00 24.02 22.48 26.30 0.84 3.48 2 0.35 0.015 U6 5sRNA U5a 48 10.64 10.69 8.71 12.06 0.86 8 .05 0.65 0.001 HPRT GAPDH U6 48 12.65 12.69 10.57 14.30 0.87 6 .85 0.70 0.001 U5a Z39 U87 48 25.22 25.23 24.68 26.10 0.26 1 .03 0.20 0.177 5sRNA U2 Z39 48 20.36 20.38 18.83 22.26 0.82 4 .02 0.10 0.487 U2 U5a GAPDH 48 20.30 20.32 18.90 22.78 0.74 3 .66 0.21 0.151 TNKS U6 HPRT 48 26.06 26.12 23.40 30.22 1.43 5 .46 0.67 0.001 GAPDH TNKS TNKS 48 31.57 31.60 29.43 34.77 0.97 3 .07 0.31 0.034 U87 UBC UBC 48 22.43 22.47 19.99 26.52 1.01 4 .48 0.71 0.001 Z39 HPRT Two criteria are considered: Pearson’s correlation coefficient and BestKeeper computed SD values. The stability of a g ene is d irectly proportional to the [r] value, while it is inversely proportional to the SD value. Note: Total sample number (n), G eometric Mean (GM), A M (Arithmetic Mean), Standard Deviation (SD), Coefficient o f V arience % (CV), P earson’s correl ation coefficient [r], P , 0.05. doi:10.1371/journal.pone. 0094311.t006
Reference Genes for Ethanol and Endocrinology Study
Table 7.A summary of ranking for reference gene candidates using 5 different statistical approaches.
RefFinder dCt method NormFinder geNorm BestKeeper
Ranking
Genes GM Genes SV Gene name SV Gene name SV [r] SD
U87 1.97 U87 1.3 GAPDH 0.64 5sRNA | U5a 0.18 HPRT 0.82 U87 0.21
U5a 2.45 U6 1.33 TNKS 0.66 Z39 0.24 UBC 0.73 U5a 0.32
5sRNA 3.03 U5a 1.34 U87 0.68 U6 0.26 TNKS 0.62 5sRNA 0.34
U6 3.36 5sRNA 1.35 U6 0.78 U87 0.35 U6 0.54 U6 0.37
GAPDH 3.81 GAPDH 1.39 UBC 0.79 GAPDH 0.59 GAPDH 0.49 Z39 0.46
Z39 5.18 Z39 1.43 U5a 0.82 U2 0.74 5sRNA 0.40 U2 0.70
TNKS 5.47 TNKS 1.44 5sRNA 0.85 TNKS 0.86 U5a 0.39 GAPDH 0.70
UBC 7.54 UBC 1.51 Z39 0.99 UBC 0.97 Z39 0.30 TNKS 0.90
U2 7.64 U2 1.54 U2 1.02 B2m 1.07 U87 0.27 UBC 0.97
HPRT 10.72 HPRT 1.72 HPRT 1.21 HPRT 1.19 U2 20.22 HPRT 1.44
B2m 10.95 BACT 1.85 BACT 1.46 BACT 1.30
BACT 11.72 B2m 1.86 B2m 1.50 18S 1.407
18S 12.94 TBP 2.22 TBP 1.96 TBP 1.53
TBP 13.49 18S 2.23 18S 2.01 GADD45A 1.68
GADD45A 15 GADD45A 2.64 GADD45A 2.46
24 samples were combined from heart experimental groups as input.
Geometric mean (GM); Stability Value (SV); Pearson’s correlation coefficient ([r]); Standard Deviation (SD). doi:10.1371/journal.pone.0094311.t007
Referenc
e
Genes
for
Ethanol
and
Endocrinology
Study
PLOS
ONE
|
www.ploson
e.org
10
May
2014
|
Volume
9
|
Issue
5
|
Table 8.A summary of ranking for reference gene candidates using 5 different statistical approaches.
RefFinder dCt NormFinder Genorm BestKeeper
Ranking
Genes GM Genes SV Gene name SV Gene name SV [r] SD
5sRNA 1.73 5sRNA 1.34 Z39 0.82 5sRNA | U5a 0.11 5sRNA 0.82 U87 0.11
Z39 2.00 Z39 1.35 U87 0.83 U6 0.17 Z39 0.80 Z39 0.61
U87 2.66 U5a 1.37 5sRNA 0.84 Z39 0.21 U6 0.79 5sRNA 0.64
U5a 2.78 U6 1.4 UBC 0.86 U87 0.47 U5a 0.79 U5a 0.65
U6 4.36 U87 1.41 U5a 0.89 GAPDH 0.75 UBC 0.71 U6 0.70
GAPDH 6.48 UBC 1.53 U6 0.93 B2m 0.93 U2 20.69 GAPDH 0.76
UBC 7.00 GAPDH 1.54 GAPDH 0.96 U2 1.04 HPRT 0.64 U2 0.87
B2m 8.37 HPRT 1.62 HPRT 1.04 TNKS 1.13 U87 20.59 TNKS 0.98
TNKS 9.00 TNKS 1.65 TNKS 1.10 UBC 1.21 TNKS 0.28 UBC 1.02
U2 9.59 B2m 1.75 B2m 1.38 18S 1.29 GAPDH 0.16 HPRT 1.41
HPRT 9.80 U2 1.82 BACT 1.47 HPRT 1.36
18S 11.72 18S 1.87 U2 1.48 BACT 1.46
BACT 12.47 BACT 1.88 18S 1.54 GADD45A 1.55
GADD45A 14.00 GADD45A 2.13 GADD45A 1.81 TBP 1.67
TBP 15.00 TBP 2.45 TBP 2.20
48 samples were combined from heart and brain experimental groups as input.
Geometric mean (GM); Stability Value (SV); Pearson’s correlation coefficient ([r]); Standard Deviation (SD). doi:10.1371/journal.pone.0094311.t008
Referenc
e
Genes
for
Ethanol
and
Endocrinology
Study
PLOS
ONE
|
www.ploson
e.org
11
May
2014
|
Volume
9
|
Issue
5
|
Comparing RefFinder Results Across Tissue Combinations
The top 6 most stable reference candidates in the bi-tissue input were U87, 5S rRNA, GAPDH, U6, U5a, and UBC. In the single-tissue input, the top 6 were similar and only with a slight difference in the order. Results for the combined and separate inputs differed by only one reference gene ‘Z39’. This means that Z39 was stable within each tissue (SD,1), but its expression differed between heart (Ctavg= 19.660.5) and brain (Ctavg= 21.1660.7). Moreover, U5a (DCtavg= 1.64) and U6 (DCtavg= 1.59) also had the highest Ctavgdifference between heart and brain tissue (Table 2). Even though the SD for Z39, U5a, and U6 was,1 in heart or brain tissue, their expression varied between heart and brain. Due to the inter-tissue variation, using Z39, U5a, and U6 in combined gene expression analysis is not recommended. In all input combina-tions, 18S rRNA, TBP, GADD45A, and BACT were the least stable among the 15 tested genes. These genes might cause inaccurate conclusions in gene expression normalizations for heart and/or brain tissue and therefore should not be used as reference genes.
Comparing Among Different Methods and Tissue
When considering all brain and heart tissue samples together, U87, 5S rRNA, and GAPDH were commonly ranked among the top 6 most stable reference genes in all 5 statistical approaches. On the other hand, only ‘U87 and U5a’, and ‘U87, U5a, U6, and Z39’ were ubiquitously ranked among the top 6 across 5 methods in each of the heart tissue, and brain tissue, respectively. As shown in Figure 3, seniority of U87 was common to all statistical methods and all tissue combinations. If the targeted genes of interest are expressed at a lower level, we recommend the use of U87 with GAPDH for the two tissues. If the targeted genes are expressed at a higher level, then 5S rRNA and U87 would be better for normalization. U87 and U5a were commonly ranked among the best in each of heart and brain tissue. Thus, for gene expression analysis concerned with heart tissue or brain tissue, U87 and U5a would serve as better reference genes.
Fallibility of Normalizations to Single Commonly Used HKGs
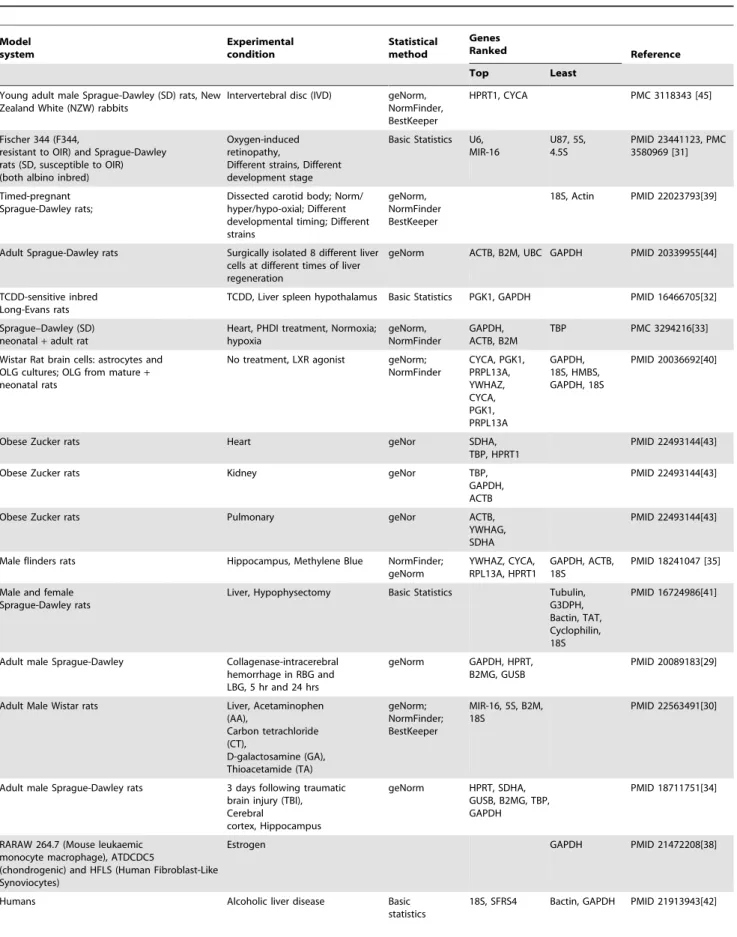
There is a wealth of resourceful studies that identified experiment-specific reference genes for normalization. We sum-marized some of the results for investigations that employed similar experimental conditions (i.e. rats, estrogen, and alcohol). Table 9 shows different HKGs as better reference genes for different tissue, treatments, treatment times, strains, species, and statistical methods. This suggests the necessity of conducting preliminary studies to use reference genes adapted for particular experimental conditions. In our study, U87, 5S rRNA, GAPDH and U5a were ranked as the top gene candidates using a combination of 5 statistical approaches. Even though, 5S rRNA was stable in rat liver treated with hepatotoxins [30], both U87 and 5S rRNA were among the least stable in SD rats suffering from oxygen-induced retinopathy [31]. While some studies reported GAPDH to be a relatively stable housekeeping gene in heart and brain tissue [29,32–34], its expression was nevertheless affected by treatments such as MB in rat brain [35], estrogen in ovariectomized C57BL6 mice [36], male and female fathead minnow fish [37], and RARAW 264.7, ATDCDC5 and HFLS cells [38].
On the contrary, 18S rRNA was among the least stable gene candidates in our settings. This is in agreement with other studies using carotid body from different SD strains under different oxygenation levels [39], oligodendrocyte cells from age-asynchro-nized Winstar rats treated with LXR agonist [40], male flinder rat hippocampus treated with MB [35], and liver of hypophysecto-mized male and female SD rats [41]. However, 18S rRNA was considered a good reference gene in Winstar rat livers treated with hepatotoxins [30], human livers with alcoholic liver disease [42], the uterus of ovarietomized C57BL6 mice treated with estradiol [36], and in liver and gonads of male and female fathead minnow fish [37]. We also showed that TBP was unstable and that was supported by another study on heart tissue of young and adult SD rats subjected to PHDI treatments under different oxygen pressures [33]. However, that was not the case in the heart of Zucker obese rats under different glycemic states [43], nor in the hippocampus of SD rats with TBI [34]. TBP was also considered stable in response to estrogen in multiple tissue of the fathead minnow fish [37].
The Importance of Using More than One Statistical Approach
No one statistical approach can cover all variables associated with gene expression studies. Therefore basing conclusions on one method can be associated with false positive results and misleading conclusions. In our study, we followed a round-about approach to determine good reference candidates for reliable normalization of gene expression data in Sprague-Dawley rats. This allowed us to correct for some inaccurate ranking such as geNorm’s raking of UBC, which was corrected by NormFinder. Also, based on the systematic interpretation, we were able to get a clearer picture on the minimal number of reference genes required for reliable normalization. After removing Z39, U5a and U6, only 3 genes are enough to serve as reference genes for analysis on heart and brain tissue combined. This makes the study more practical (8 vs. 3 control genes) and reliable at the same time.
In conclusion, it is difficult to ascertain whether the inconsis-tency or variability in the stability of the housekeeping genes arises from the employment of different statistical methodologies or different treatments. For example, in two studies concerned with rat liver, GAPDH was stable after TCDD treatment based on Figure 3. Van Diagram that summarizes the commonly ranked
top gene candidates.Firstly, the top 6 genes ranked by each of the geNorm, dCt method, NormFinder, BestKeeper, and RefFinder were compared for each input: Heart+brain, heart, and brain samples. Only genes common for all 5 methods were chosen for each input. Those genes were then compared among all input combinations and presented in the diagram above.
doi:10.1371/journal.pone.0094311.g003
Reference Genes for Ethanol and Endocrinology Study
Table 9.A minireview of the reference gene candidates ranked as top or least stable in different experimental settings using higher organisms.
Model system
Experimental condition
Statistical method
Genes
Ranked Reference
Top Least
Young adult male Sprague-Dawley (SD) rats, New Zealand White (NZW) rabbits
Intervertebral disc (IVD) geNorm, NormFinder, BestKeeper
HPRT1, CYCA PMC 3118343 [45]
Fischer 344 (F344,
resistant to OIR) and Sprague-Dawley rats (SD, susceptible to OIR) (both albino inbred)
Oxygen-induced retinopathy,
Different strains, Different development stage
Basic Statistics U6, MIR-16
U87, 5S, 4.5S
PMID 23441123, PMC 3580969 [31]
Timed-pregnant Sprague-Dawley rats;
Dissected carotid body; Norm/ hyper/hypo-oxial; Different developmental timing; Different strains
geNorm, NormFinder BestKeeper
18S, Actin PMID 22023793[39]
Adult Sprague-Dawley rats Surgically isolated 8 different liver cells at different times of liver regeneration
geNorm ACTB, B2M, UBC GAPDH PMID 20339955[44]
TCDD-sensitive inbred Long-Evans rats
TCDD, Liver spleen hypothalamus Basic Statistics PGK1, GAPDH PMID 16466705[32]
Sprague–Dawley (SD) neonatal+adult rat
Heart, PHDI treatment, Normoxia; hypoxia
geNorm, NormFinder
GAPDH, ACTB, B2M
TBP PMC 3294216[33]
Wistar Rat brain cells: astrocytes and OLG cultures; OLG from mature+ neonatal rats
No treatment, LXR agonist geNorm; NormFinder
CYCA, PGK1, PRPL13A, YWHAZ, CYCA, PGK1, PRPL13A
GAPDH, 18S, HMBS, GAPDH, 18S
PMID 20036692[40]
Obese Zucker rats Heart geNor SDHA,
TBP, HPRT1
PMID 22493144[43]
Obese Zucker rats Kidney geNor TBP,
GAPDH, ACTB
PMID 22493144[43]
Obese Zucker rats Pulmonary geNor ACTB,
YWHAG, SDHA
PMID 22493144[43]
Male flinders rats Hippocampus, Methylene Blue NormFinder; geNorm
YWHAZ, CYCA, RPL13A, HPRT1
GAPDH, ACTB, 18S
PMID 18241047 [35]
Male and female Sprague-Dawley rats
Liver, Hypophysectomy Basic Statistics Tubulin, G3DPH, Bactin, TAT, Cyclophilin, 18S
PMID 16724986[41]
Adult male Sprague-Dawley Collagenase-intracerebral hemorrhage in RBG and LBG, 5 hr and 24 hrs
geNorm GAPDH, HPRT, B2MG, GUSB
PMID 20089183[29]
Adult Male Wistar rats Liver, Acetaminophen (AA),
Carbon tetrachloride (CT),
D-galactosamine (GA), Thioacetamide (TA)
geNorm; NormFinder; BestKeeper
MIR-16, 5S, B2M, 18S
PMID 22563491[30]
Adult male Sprague-Dawley rats 3 days following traumatic brain injury (TBI), Cerebral
cortex, Hippocampus
geNorm HPRT, SDHA, GUSB, B2MG, TBP, GAPDH
PMID 18711751[34]
RARAW 264.7 (Mouse leukaemic monocyte macrophage), ATDCDC5
(chondrogenic) and HFLS (Human Fibroblast-Like Synoviocytes)
Estrogen GAPDH PMID 21472208[38]
Humans Alcoholic liver disease Basic
statistics
18S, SFRS4 Bactin, GAPDH PMID 21913943[42]
Reference Genes for Ethanol and Endocrinology Study
geNorm [44], but it was not when using other statistical methods in liver cells under different conditions [32]. What is noteworthy is that the ranking of the reference genes is always relative and that can change simply by changing a few candidates in the gene list. Therefore, despite the superfluous publications, research con-cerned with the determination of reference remains juvenile. With more efforts being dedicated to tackle this issue, a meta-analysis would help reveal patterns that might redirect and standardize our normalization methods for more accurate interpretation of results.
Acknowledgments
We greatly appreciate Ms. Kun Sun for conducting the animal studies and for tissue preparation.
Author Contributions
Conceived and designed the experiments: FAT AAA BZ. Performed the experiments: FAT AAA BZ. Analyzed the data: FAT AAA BZ. Contributed reagents/materials/analysis tools: FAT AAA BZ. Wrote the paper: FAT AAA BZ.
References
1. CDC CfDCaP (2012) Fact Sheets- Alcohol Use and Health. Retrieved from http://www.cdc.gov/alcohol/fact-sheets/alcohol-use.htm on May.14.2013. 2. Oscar–Berman M, Marinkovic K (2004) Alcoholism and the Brain: An
Overview. NIAAA. Retrieved online from http://pubs.niaaa.nih.gov/ publications/arh27-2/125-133.htm on May.15.2013.
3. Ruusa J, Bergman B (1996) Sex hormones and alcohol withdrawal: does a good supply of testosterone prevent serious symptoms during detoxification? Alcohol 13: 139–145.
4. Gill J (2000) The effects of moderate alcohol consumption on female hormone levels and reproductive function. Alcohol Alcohol 35: 417–423.
5. Mello N, Mendelson J, Bree M, Skupny A (1988) Alcohol effects on LH and FSH in recently ovariectomized female monkeys. NIDA Res Monogr 81: 122– 128.
6. Lenz B, Muller CP, Stoessel C, Sperling W, Biermann T, et al. (2012) Sex hormone activity in alcohol addiction: integrating organizational and activa-tional effects. Prog Neurobiol 96: 136–163.
7. Purohit V (1998) Moderate alcohol consumption and estrogen levels in postmenopausal women: a review. Alcohol Clin Exp Res 22: 994–997. 8. Onland-Moret NC, Peeters PH, van der Schouw YT, Grobbee DE, van Gils
CH (2005) Alcohol and endogenous sex steroid levels in postmenopausal women: a cross-sectional study. J Clin Endocrinol Metab 90: 1414–1419. 9. Wong AW, Dunlap SM, Holcomb VB, Nunez NP (2012) Alcohol promotes
mammary tumor development via the estrogen pathway in estrogen receptor alpha-negative HER2/neu mice. Alcohol Clin Exp Res 36: 577–587. 10. Fan S, Meng Q, Gao B, Grossman J, Yadegari M, et al. (2000) Alcohol
stimulates estrogen receptor signaling in human breast cancer cell lines. Cancer Res 60: 5635–5639.
11. Scott HC, Sun GY, Zoeller RT (1998) Prenatal ethanol exposure selectively reduces the mRNA encoding alpha-1 thyroid hormone receptor in fetal rat brain. Alcohol Clin Exp Res 22: 2111–2117.
12. Bennett B, Downing C, Parker C, Johnson TE (2006) Mouse genetic models in alcohol research. Trends Genet 22: 367–374.
13. Tabakoff B, Hoffman PL (2000) Animal Models in Alcohol Research. NIAAA Retrieved from http://pubsniaaanihgov/publications/arh24-2/77-84pdf on May152013 24.
14. Lee J, Jee C, McIntire SL (2009) Ethanol preference in C. elegans. Genes Brain Behav 8: 578–585.
15. Guarnieri DJ, Heberlein U (2003) Drosophila melanogaster, a genetic model system for alcohol research. Int Rev Neurobiol 54: 199–228.
16. Nolan T, Hands RE, Bustin SA (2006) Quantification of mRNA using real-time RT-PCR. Nat Protoc 1: 1559–1582.
17. Cappelli K, Felicetti M, Capomaccio S, Spinsanti G, Silvestrelli M, et al. (2008) Exercise induced stress in horses: selection of the most stable reference genes for quantitative RT-PCR normalization. BMC Mol Biol 9: 49.
18. Gutierrez L, Mauriat M, Guenin S, Pelloux J, Lefebvre JF, et al. (2008) The lack of a systematic validation of reference genes: a serious pitfall undervalued in reverse transcription-polymerase chain reaction (RT-PCR) analysis in plants. Plant Biotechnol J 6: 609–618.
19. Thellin O, Zorzi W, Lakaye B, De Borman B, Coumans B, et al. (1999) Housekeeping genes as internal standards: use and limits. J Biotechnol 75: 291– 295.
20. Suzuki T, Higgins PJ, Crawford DR (2000) Control selection for RNA quantitation. Biotechniques 29: 332-+.
21. Vandesompele J, De Preter K, Pattyn F, Poppe B, Van Roy N, et al. (2002) Accurate normalization of real-time quantitative RT-PCR data by geometric averaging of multiple internal control genes. Genome Biol 3: RESEARCH0034. 22. Silver N, Best S, Jiang J, Thein SL (2006) Selection of housekeeping genes for gene expression studies in human reticulocytes using real-time PCR. BMC Mol Biol 7: 33.
23. Andersen CL, Jensen JL, Orntoft TF (2004) Normalization of real-time quantitative reverse transcription-PCR data: a model-based variance estimation approach to identify genes suited for normalization, applied to bladder and colon cancer data sets. Cancer Res 64: 5245–5250.
24. Pfaffl MW, Tichopad A, Prgomet C, Neuvians TP (2004) Determination of stable housekeeping genes, differentially regulated target genes and sample integrity: BestKeeper-Excel-based tool using pair-wise correlations. Biotechnol Lett 26: 509–515.
25. Xie F, Xiao P, Chen D, Xu L, Zhang B (2012) miRDeepFinder: a miRNA analysis tool for deep sequencing of plant small RNAs. Plant Mol Biol. 26. Mohamed M, Abdel-Rahman A (2000) Effect of long-term ovariectomy and
estrogen replacement on the expression of estrogen receptor gene in female rats. European Journal of Endocrinology 142: 307–314.
27. El-Mas MM, Abdel-Rahman AA (2004) Effects of long-term ovariectomy and estrogen replacement on clonidine-evoked reductions in blood pressure and hemodynamic variability. Journal of Cardiovascular Pharmacology 43: 607– 615.
28. Calkins KG (2005) Applied Statistics: Correlation Coefficients.Andrews University. Retrieved on June.5.2013online from http://www.andrews.edu/ ,calkins/math/edrm611/edrm05.htm.
29. Cook NL, Kleinig TJ, van den Heuvel C, Vink R (2010) Reference genes for normalising gene expression data in collagenase-induced rat intracerebral haemorrhage. BMC Mol Biol 11: 7.
Table 9.Cont.
Model system
Experimental condition
Statistical method
Genes
Ranked Reference
Top Least
C57BL6 mice Ovariectomized, Uterus, Estradiol Basic Statistics
RPL13A, 18S GAPDH, HPRT1, PPIA, B2M, GUSB, ACTB, HSP90AB1
PMID: 19219570[36]
Male and female fathead minnow fish Estrogen, Liver, Gonad Basic Statistics
18S, RPL8, HPRT1,TBP
EF1A, G6PD, Bactin, GAPDH
PMID 17288598[37]
Basic Statistics: bi/multivariable; parametric/non-parametric hypothesis testing (e.g. t-test, ANOVA) and clustering methods. doi:10.1371/journal.pone.0094311.t009
Reference Genes for Ethanol and Endocrinology Study
30. Lardizabal MN, Nocito AL, Daniele SM, Ornella LA, Palatnik JF, et al. (2012) Reference genes for real-time PCR quantification of microRNAs and messenger RNAs in rat models of hepatotoxicity. PLoS One 7: e36323.
31. Tea M, Michael MZ, Brereton HM, Williams KA (2013) Stability of small non-coding RNA reference gene expression in the rat retina during exposure to cyclic hyperoxia. Mol Vis 19: 501–508.
32. Pohjanvirta R, Niittynen M, Linden J, Boutros PC, Moffat ID, et al. (2006) Evaluation of various housekeeping genes for their applicability for normaliza-tion of mRNA expression in dioxin-treated rats. Chem Biol Interact 160: 134– 149.
33. Caldani M, Batailler M, Thiery JC, Dubois MP (1988) LHRH-immunoreactive structures in the sheep brain. Histochemistry 89: 129–139.
34. Cook NL, Vink R, Donkin JJ, van den Heuvel C (2009) Validation of reference genes for normalization of real-time quantitative RT-PCR data in traumatic brain injury. J Neurosci Res 87: 34–41.
35. Bonefeld BE, Elfving B, Wegener G (2008) Reference genes for normalization: a study of rat brain tissue. Synapse 62: 302–309.
36. Schroder AL, Pelch KE, Nagel SC (2009) Estrogen modulates expression of putative housekeeping genes in the mouse uterus. Endocrine 35: 211–219. 37. Filby AL, Tyler CR (2007) Appropriate ‘housekeeping’ genes for use in
expression profiling the effects of environmental estrogens in fish. BMC Mol Biol 8: 10.
38. Galal N, El-Beialy W, Deyama Y, Yoshimura Y, Tei K, et al. (2010) Up-regulation of the G3PDH ‘housekeeping’ gene by estrogen. Mol Med Rep 3: 111–113.
39. Kim I, Yang D, Tang X, Carroll JL (2011) Reference gene validation for qPCR in rat carotid body during postnatal development. BMC Res Notes 4: 440. 40. Nelissen K, Smeets K, Mulder M, Hendriks JJ, Ameloot M (2010) Selection of
reference genes for gene expression studies in rat oligodendrocytes using quantitative real time PCR. J Neurosci Methods 187: 78–83.
41. Verma AS, Shapiro BH (2006) Sex-dependent expression of seven housekeeping genes in rat liver. J Gastroenterol Hepatol 21: 1004–1008.
42. Boujedidi H, Bouchet-Delbos L, Cassard-Doulcier AM, Njike-Nakseu M, Maitre S, et al. (2012) Housekeeping gene variability in the liver of alcoholic patients. Alcohol Clin Exp Res 36: 258–266.
43. Cabiati M, Raucci S, Caselli C, Guzzardi MA, D’Amico A, et al. (2012) Tissue-specific selection of stable reference genes for real-time PCR normalization in an obese rat model. J Mol Endocrinol 48: 251–260.
44. Wang GP, Xu CS (2010) Reference gene selection for real-time RT-PCR in eight kinds of rat regenerating hepatic cells. Mol Biotechnol 46: 49–57. 45. Di Pasquale C (1986) [Economics of oral health and socio-economic
development]. Odontostomatol Trop 9: 175–181.
Reference Genes for Ethanol and Endocrinology Study