www.ann-geophys.net/28/1157/2010/ doi:10.5194/angeo-28-1157-2010
© Author(s) 2010. CC Attribution 3.0 License.
Annales
Geophysicae
Communica
tes
Clear-sky direct aerosol radiative forcing variations over mega-city
Delhi
S. Singh, K. Soni, T. Bano, R. S. Tanwar, S. Nath, and B. C. Arya
Radio and Atmospheric Sciences Division, National Physical Laboratory (CSIR), New Delhi-110012, India Received: 17 January 2010 – Revised: 4 May 2010 – Accepted: 18 May 2010 – Published: 21 May 2010
Abstract. The direct aerosol radiative forcing (DARF) has been estimated for the clear-sky conditions over Delhi from January 2006 to January 2007 using Santa Barbara DISORT Atmospheric Radiative Transfer model (SBDART) in the wavelength range 300–3000 nanometer. The single scatter-ing albedo (SSA) and the asymmetry parameter used in this model were estimated using the Optical Properties of Aerosol and Cloud (OPAC) model. The annual average AOD ob-served at 500 nm was∼0.86±0.42 with an average Angstrom exponent∼0.68±0.35. The average monthly AOD through-out the year over Delhi was found to be in the range 0.56 to 1.22 with the Angstrom exponent in the range 0.38 to 0.96. A high monthly average BC concentration in the range 4– 15 µg m−3led to monthly average SSA in the range 0.90±0.4 to 0.74±0.3 during the year. Consequently, the monthly av-erage clear-sky DARF at the surface was found to vary in the range−46±8 W m−2to−110±20 W m−2, at TOA in the range−1.4±0.4 to 21±2 W m−2, whereas in the atmosphere it was in the range 46±9 W m−2to 115±19 W m−2 through-out the year. As the dust concentration in the atmosphere was highest (May–June) the SSA showed an increase with wave-length however when dust concentration was low the SSA decreased with the wavelength.
Keywords. Atmospheric composition and structure (Aerosols and particles)
1 Introduction
The atmospheric aerosols have assumed greater significance recently in climate studies because of their potential to per-turb the radiation balance of the earth at regional and global scales (Charlson et al., 1992; Haywood and Shine, 1995;
Correspondence to:S. Singh ([email protected])
Haywood and Boucher, 2000; Penner et al., 2004). It causes changes in radiation balance of the earth by direct as well as indirect interactions with the solar radiation, giving rise to the aerosol radiation forcings that are generally classified as direct and indirect. The direct aerosol radiative forcing (DARF) involves scattering and absorption of solar radiation by atmospheric aerosols, which, depending upon the nature of aerosols and the surface albedo may produce negative or positive radiation forcing at the surface. The indirect radia-tive forcing is the mechanism by which aerosols modify the microphysical and hence the radiative properties, amount and lifetime of clouds (IPCC, 2007, and the references therein). The estimation of indirect radiation forcing is far more com-plex than the estimation of direct radiative forcing. The present study is limited only to the direct aerosol radiative forcing during the clear-sky conditions.
Aerosol radiation forcing at any layer in the atmosphere is defined as the difference in the net fluxes (down minus up) with and without aerosols at that layer. The magnitude and sign of ARF is determined by different aerosol species, their size distribution, and chemical characteristics. Partic-ularly the absorbing aerosols like black carbon and some of the mineral dust aerosols significantly alter the magnitude and sign of the ARF by altering the aerosol single scattering albedo (SSA). The existing scientific literature extensively documents the mineral dust aerosols (Duce, 1995; Miller and Tegen, 1998; Quijano et al., 2000; Prospero et al., 2002; Tegen et al., 2004; Zhu et al., 2007) and the carbonaceous aerosols (Penner, 1995; Jacobson, 2001; Chung and Sein-feld, 2002; Wang, 2004) in the atmosphere and their impacts on aerosol radiation forcing.
from the Indian Ocean Experiment (INDOEX), the Bay of Bengal Monsoon Experiment (BOBMEX), the Arabian sea Monsoon Experiment (ARMEX), the Integrated Campaign for Aerosols, gases and Radiation Budget (ICARB) and the East Asian Studies of Tropospheric Aerosols: An Interna-tional Regional Experiment (EAST-AIRE). The overview of these campaigns are given by Ramanathan et al. (2001); Bhat et al. (2001); Moorthy et al. (2008), and Li et al. (2007). These experiments have provided a wealth of information on aerosol characterization, size distribution and aerosol radia-tion forcing in the targeted region during the campaign pe-riod.
Similarly, in the north Indian region also there are some studies on aerosol characterization and forcing but they are limited to pre-monsoon season only (Singh et al., 2005; Prasad et al., 2007; Pandithurai et al., 2008; Beegum et al., 2008). Present study, for the first time, is focused on the monthly variation of clear sky direct aerosol radiation forc-ing (DARF) over a north Indian station, Delhi, for the whole year during January 2006 to January 2007. Being a part of the Indo-Gangetic Basin the aerosol optical properties over Delhi may resemble what it has been reported earlier from the Indo-Gangetic basin (Dey et al., 2008). It is expected that the anthropogenic aerosols rich in its black carbon (BC) content, present in the atmosphere throughout the year, gets mixed with the mineral dust aerosols from deserts during pre-monsoon months, April–June. The DARF in the wavelength range 300–3000 nm has been estimated during clear sky days every month during January 2006 to January 2007 to see its seasonal variation over Delhi. It has been estimated using the Santa Barbara DISORT Atmospheric Radiative Trans-fer model (SBDART). The input to run this model was ob-tained using the ground based observations and with the help of aerosol optical properties obtained using the model OPAC (Optical Properties of Aerosol and Clouds). The average sur-face albedo values were retrieved from the Aura OMI ver-sion 3 reflectivity data through Giovanni online data system, developed and maintained by the NASA GES DISC.
2 Experimental site and instruments
Delhi, the capital of India, located between the latitudes of 28◦24′17′′and 28◦53′00′′North and longitudes of 76◦50′24′′ and 77◦20′37′′ East, having an area of 1483 sq. km, is one of the most densely populated cities in Asia (10 340 per-sons km−2). It is located in a semi-arid region close to the Thar and Margo desert in the West and experiences ex-treme weather conditions. Summer temperature peak goes more than 45◦C during daytime and the lowest temperature in winter season reaches 1◦C in the night. The rainy sea-son for Delhi is during July and August when higher hu-midity levels exist. During the year 2006, the total rain-fall was 708 mm out of which a maximum of about 260 mm occurred during the end of July. In the pre-monsoon
pe-riod (April–June), frequent dust storms from western and north-western desert regions cause large scale loading of dust aerosols over Delhi. This causes considerable reduc-tion in visibility and in the radiareduc-tion flux reaching the face (Singh et al., 2005). According to the economic sur-vey report of Delhi 2007–2008 (http://delhiplanning.nic.in/ Economic20Survey/ES2007-08/ES2007-08.htm), the aver-age suspended particulate matter (SPM) and respirable sus-pended particulate matter (RSPM) concentration over Delhi during 2006 was 433 µg m−3and 174 µg m−3, much higher than the permissible safe limits. It also states that most of the local pollution in Delhi is attributed to the vehicular emis-sion (∼80%). The vehicular density here is more than 10 times the average vehicular density of the country with more than 5.5 Million vehicles. It is further increasing at an av-erage annual rate of 8–10%. The industry and domestic use contribute 12 and 8%, respectively, in the total pollution of Delhi. The estimated vehicular emission load in Delhi for particulate matter alone is about 13 ton per day.
For the present study, the aerosol optical depths (AOD) were measured with recently calibrated MICROTOPS-II sunphotometer (Solar Light Co., USA) at five wavelengths, 380, 500, 675, 870 and 1020 nm (full width at half maxi-mum, FWHM:±2–10 nm). The MICROTOPS-II observa-tions are susceptible to filter degradation errors and needs periodic filter calibration (Morys et al., 2001). The pointing accuracy of the instrument is better than 0.1◦and long-term stability of the filter is better than 0.1 nm year−1. The accu-racy of measurements for precision and consistency of the MICROTOPS-II instruments are discussed in detail by Sri-vastava et al. (2006). The accuracy of the MICROTOPS-II was found within 1.8%. For AOD retrieval from direct sun measurements, as in the case of MICROTOPS-II, theoretical and/or observations error in AOD can vary in the range of 0.002–0.021 in the visible to near infrared wavelength range, maximum being at 340 nm and minimum at 1020 nm (Eck et al., 1999; Schmid et al., 1999).
optical path in the Aethalometer filter with an increasing fil-ter load, also referred to as the “shadowing effect” (Weingart-ner et al., 2003); and due to multiple scattering of light in the fiber matrix of the filter (Arnott et al., 2005). In addition, the uncertainty due to change in sampling conditions and instru-ment noise may also be present but this will be considerably reduced in the present case as we are taking long averaging periods. Weingartner et al. (2003) have suggested a correc-tion factor of 2.14 for multiple scattering correccorrec-tions. In the present case we have used a value of 1.9 which may lead to an over estimation of about 12% in BC concentration. Con-sidering all other factors the overall uncertainty in the BC measurements may be around 20%.
In addition, the regular measurements on aerosol num-ber size distribution have also been made using a 15-Channel portable aerosol optical particle counter (OPC) from GRIMM (Model: 1.108). The instrument has been widely used for aerosol size distribution measurements (Jayaraman et al., 2006; Pant et al., 2006). This instrument uses a light-scattering technology for single-particle counts, whereby a semiconductor laser serves as the light source. The scattered signal from the particle passing through the laser beam is col-lected at approximately 90◦by a mirror and transferred to a recipient-diode. The signal of the diode passes, after a cor-responding reinforcement to a multi-channel size classifier. A pulse height analyzer then classifies the signal transmit-ted in each channel. The instrument sucks in the ambient air and segregates the aerosols in accordance with the aero-dynamic diameter into one of its 15 size modes. The OPC provides cumulative aerosol number concentration in 15 dif-ferent size modes ranging from>0.3 µm to>20.0 µm with a detection range in 1–106counts per liter with a sensitivity of 1 particle per liter. The uncertainty in number of counts may depend upon the relative humidity, due to clogging of particles. In order to avoid this, the instrument was kept in-side an all weather housing to maintain the humidity inin-side the instrument at 50% RH. Further precaution was taken in the present case to operate the instrument only till RH was 75%. More details about the instruments can be found at http://www.grimm-aerosol.com.
3 AOD, Angstrom exponent and aerosol size distribution
The aerosol optical depths were measured at five wave-lengths 380, 500, 675, 870 and 1020 nm during clear-sky conditions using MICROTOPS-II sunphotometer. The clear sky conditions here imply the cloud free days or the inter-vals of the day that were cloud free. The microtops observa-tions were taken only when the sun was completely visible. The data was taken nearly every half an hour during the day time 09:00 to 16:00 h on cloud free days. On partially cloudy days data was taken during the intervals that were cloud free. Care was taken so that the field of view remains cloud free
α
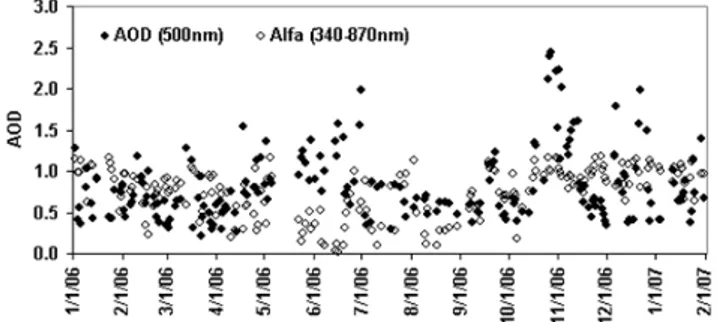
Fig. 1.Variation of AOD (500 nm) and Angstrom exponentα(340–
870 nm) over Delhi during January 2006 to January 2007 during clear-sky days.
during the observations. A minimum of three continuous ob-servations (within a short span<20 s) were made every time the instrument was pointed towards the sun. Out of these three observations the one with minimum AOD at 500 nm was used for further analysis. This was done to ensure better pointing of microtops towards the sun as the minimum AOD will correspond to maximum pointing accuracy at the given time. The daily average was calculated only for those days which had at least six clear sky observations during the day.
α
Fig. 2. Variation of monthly averages of observed AOD at 500 nm
(circle) over Delhi during January 2006–January 2007, and the Angstrom exponentα(triangle) calculated from observation.
The variation of monthly averaged AOD and αhas been plotted in Fig. 2. The monthly averaged data included a minimum of ten days of average (during August) and a maximum of 22 days (in November). The annual aver-age AOD at 500 nm during the period of present observa-tions is ∼0.86±0.42 with an average Angstrom exponent ∼0.68±0.35. The average monthly AOD showed maximum values during the months of October (1.22±0.20) and May (1.12±0.30). The high value in May is due to the enhance-ment in natural desert dust aerosols whereas during Octo-ber it is mainly due to anthropogenically-enhanced pollution during the festival month. The average monthly Angstrom exponent values during these months were 0.89±0.27 and 0.54±0.32, respectively, indicating that the fine mode par-ticles dominated more during polluted month of October. On the other hand the minimum monthly average AOD for the whole year occurred during the months of March (0.56±0.29) and August (0.59±0.10) with the averageα val-ues being 0.80±0.19 and 0.53±0.21, respectively. As there are considerable variations in AOD and α throughout the year, it is expected that the average aerosol radiation forcing will also vary during different seasons at Delhi.
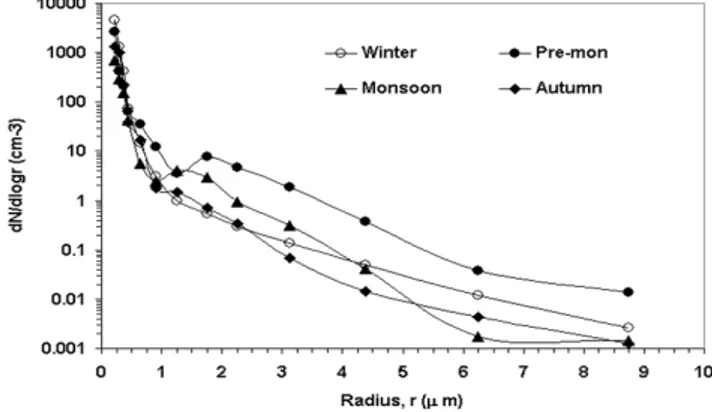
The monthly average number-size distribution of aerosols were measured at the surface and it was found that in general for all the months particles with diameter less than 1 µm dom-inated in number. Figure 3 shows the four kinds of distin-guished number size distribution observed over Delhi. Dur-ing winters the size distribution is more or less unimodal. For all other seasons the distribution is strongly bimodal. During pre-monsoon period the coarse particle (>1 µm) concentra-tion increases significantly showing an increase of 1–2 or-der as compared to other seasons. The autumn season is relatively clean showing lowest concentration in the coarse mode. During monsoon season the concentration of both fine and coarse mode particles decreases. However, the decrease is more pronounced in the coarse mode.
Fig. 3.Aerosol number size distribution over Delhi during different
seasons during 2006.
4 Estimation of SSA and asymmetry parameter
The single scattering albedo (SSA) and the asymmetry pa-rameter are very critical to the estimation of aerosol radi-ation forcing. The SSA is the fraction of energy removed from the incident wave that reappears as scattered radiation whereas the asymmetry parameter is the average or statisti-cally expected value of the cosine of the scattered angle for the scattered radiation. As we do not have the provision of measuring these two parameters directly, it is being estimated in the present case using the OPAC (Optical Properties of Aerosol and Clouds) model. The model, developed by Hess et al. (1998) provides microphysical and optical properties of aerosols and clouds in the solar and terrestrial spectral range of atmospheric particulate matter. The optical prop-erties of aerosol and clouds components are all calculated in the model for 1 particle cm−3and the program allows for a mixture of aerosol components to aerosol types consist-ing of several components and to calculate a wide range of their optical properties. As the aerosol in the atmosphere is a mixture of different components that can be obtained either through the ground measurements or by the use of typical mixtures, called aerosol types, given in the OPAC model it-self. Thus multiplying the stored optical properties data with realistic number densities obtained either with the observed data or the model values available in the OPAC, gives ab-solute optical properties of aerosol in the atmosphere. The model can give optical properties at up to 61 wavelengths between 0.3 µm and 40 µm and for up to 8 relative humidity values.
Fig. 4. Variation of monthly averages of Black Carbon (BC) con-centration during daytime over Delhi during January 2006 to Jan-uary 2007.
using the Aethalometer (described earlier) have been used in the model to estimate the optical properties of the aerosols. Figure 4 shows the monthly average of the daytime measure-ments of black carbon (soot) concentration along with their standard deviations over Delhi during 2006. Significant vari-ation in the concentrvari-ation of BC during winter and summer months even during the day time may be noticed, which can cause large variations in the SSA. It is to be mentioned here that as the BC concentration data for the month of Novem-ber 2006 was not available hence an average value of the same for the month of November 2005 (BC=9.57 µg m−3) has been used in the SSA estimation done later on. This was done because the average monthly BC concentrations, partic-ularly during the winter months of year 2005 were not much different from those in the year 2006. The average BC con-centration was highest during December 2006 (16.7 µg m−3) and lowest during August (3.26 µg m−3).
Since aerosol particles in the atmosphere exist as a mix-ture of several aerosol components, in the present study, the external mixing approach of the OPAC model has been used to estimate the SSA of the aerosol. Generally the “urban” aerosol type of the OPAC model was taken as a base where the different components of aerosols, for example water sol-uble, insoluble and soot, concentration was varied month to month as per the observation and available data. During the pre monsoon period, due to the abundance of desert dust over Delhi, a combination of two aerosol types “urban” and “desert” of the OPAC model has been used to represent the average aerosol composition that included mineral dust in ac-cumulation and coagulation modes apart from the soot water soluble and insoluble components. The validity of aerosol structure during pre-monsoon period has already been tested in an earlier study by Singh et al. (2005) using OPAC and SBDART model.
As the OPAC model also estimates the AOD along with the SSA and Asymmetry Parameter, it can be used to cross check the assumed aerosol structure. For a given aerosol component and its concentration the OPAC model was used
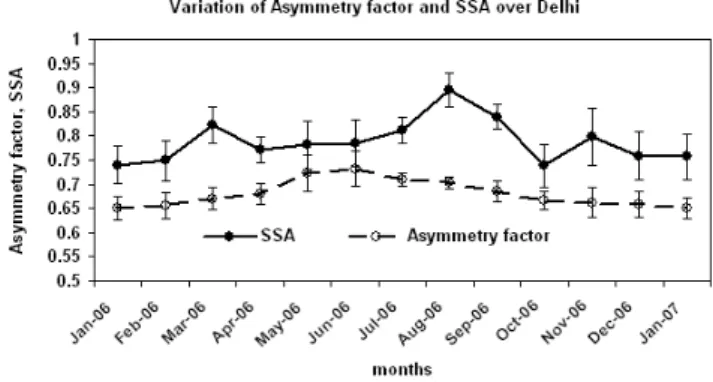
Fig. 5. Variation of monthly averages of single scattering albedo
(SSA) and Asymmetry factor estimated over Delhi during January 2006 to January 2007.
to calculate the AOD at 500 nm and compared with the ob-served AOD values. The AOD obtained by the model has been constrained by the urban aerosol structure of the model along with the actual BC measurements at surface as de-scribed above. In absence of the measurements of vertical profile of aerosols, the default aerosol profile of the model has been used in the calculation. However, the boundary layer height was chosen as 1 km during winters and 2 km dur-ing the summers. This assumption is quite reasonable as sim-ilar values are also observed by the sodar measurements over Delhi. The AOD values thus obtained from the OPAC model on all clear-sky-days were compared with the observed AOD and the ARF calculations were done for those days where the two AODs at 500nm matched within±0.05. The Angstrom exponentαwas also compared for these days and was found to agree within 5%.
The single scattering albedo thus obtained has been plot-ted as monthly average during January 2006 to January 2007 along with the Asymmetry Parameter in Fig. 5. The vertical bars denote the 1σ standard deviation from the mean val-ues. The average SSA at 500 nm over Delhi during the whole period of observation was found to be 0.79±0.05. It was minimum during January at an average value of 0.74±0.03 and maximum during the month of August with a value of 0.89±0.04. The average asymmetry factor during the pe-riod had a value of 0.68±0.03 with a maximum at 0.73±0.04 during June and minimum at 0.65±0.03 during January. In general the SSA over Delhi showed low values, which were mainly due to high concentration of absorbing BC aerosols. Minimum SSA occurred during winter months when high BC concentrations were also observed. The SSA gradually increased from winter month of January to reach a maximum during monsoon month of August when the BC concentra-tion was also found minimum.
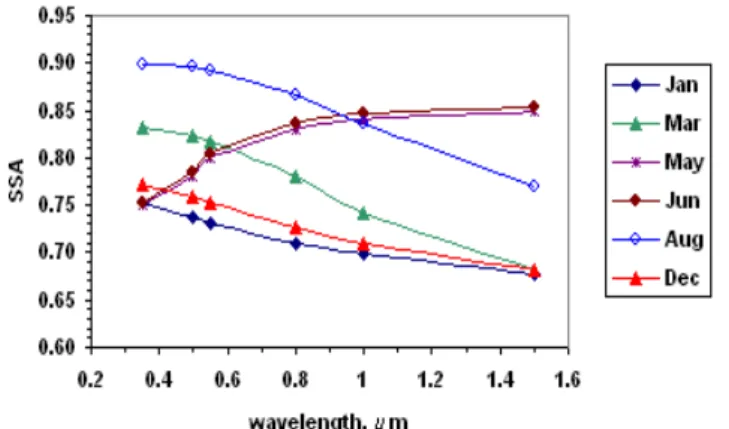
Fig. 6. Variation of single scattering albedo with wavelength as es-timated using OPAC model during typical months in different sea-sons over Delhi.
al., 2004), at Kanpur during December 2004 it was reported 0.76 (Tripathi et al., 2005), at Chennai during February– March 2001 it was 0.77 (Ramachandran, 2005), and at Hissar during December 2004 it was 0.88 (Ramachandran et al, 2006). All these observations including the present one in-dicates strong absorbing nature (mainly due to BC) of the aerosol in the region. This may be compared with the ob-servations from a relatively clean site Manora Peak where Pant et al. (2006) have reported BC concentration to vary be-tween 0.85 to 2.6 µg m−3 and the SSA varied from 0.94 to 0.87. Another study over Delhi during March to June 2006 by Pandithurai et al. (2008) reported SSA in the range of 0.74 to 0.84, estimated with the PREDE Sky-radiometer. The val-ues that we have estimated using OPAC model during the same period are in the range 0.77 to 0.82. The SSA val-ues are generally low during winters (0.74 during January 06), which gradually increase in pre-monsoon as more dust aerosols are added in the atmosphere, and peak during Au-gust, the monsoon season, as BC is low and atmosphere has more water soluble particles which have higher SSA. After this, SSA again starts increasing as the BC concentration in-creases.
It is also to be mentioned that the SSA values are found to be affected by particle morphology (shape and size), and composition (Parungo, 1997; Dubovik et al., 2006). Re-cently, Mishra et al. (2008) have shown the effect of dust particle shape and composition on SSA in a case study from the Great Indian Desert. They have shown that SSA increases as the hematite content increases in dust. The effect is how-ever maximum at UV and negligible at NIR wavelengths. It is important to include the effects of shape and composition of dust particles in assessing DARF but in the present study it has not been attempted. It is however interesting to see the spectral variation of SSA during the different seasons of the year. Figure 6 shows the SSA variation obtained by OPAC model in the wavelength range 0.35 to 1.50 µm during different seasons. During winters (represented by
Decem-Fig. 7. Effect of change in BC concentration over AOD, SSA and
asymmetry factor estimated using OPAC urban aerosol model.
ber and January) when local pollutions dominate the SSA was found to decrease with the increase in wavelength. On the other hand when the dust aerosols dominated during the pre-monsoon season (represented by May and June months), the SSA increased with the wavelength. Huge differences in SSA values of the order of 0.15 may be noticed for the dust and pollution dominant months at higher wavelengths (1.0 and 1.5 µm). During August, which is the cleanest month in terms of aerosols/BC the SSA at shorter wavelength shows the highest value and also the decrease in SSA with wave-length is steepest (0.13 asλchanges from 0.35 to 1.50 µm). During winters for pollution ridden aerosols the variation is nearly flat with minimum slope. For other months when pol-lution and dust may be mixed the SSA again decreases with wavelength and lies in between the extreme values found dur-ing August and January. Somewhat similar observation of increase in SSA with wavelength during high dust concen-tration and decrease in SSA during low dust concenconcen-tration has been reported by Holler et al. (2003) during ACE-Asia (Aerosol Characterization Experiment) campaign at a coastal site near the Sea of Japan. At a nearby location Kanpur, simi-lar observations have also been reported by Prasad and Singh (2007).
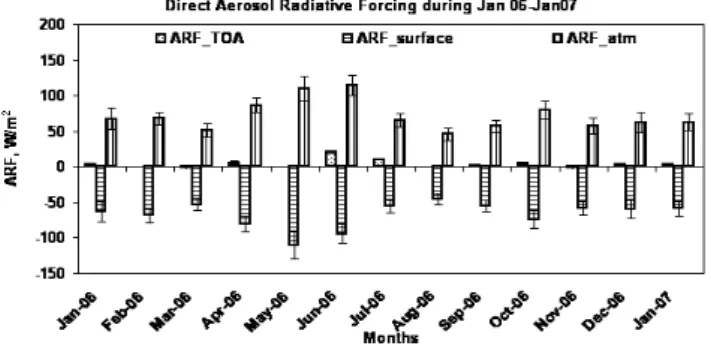
Fig. 8. Variation of monthly averages of clear-sky direct aerosol radiation forcing (DARF) over TOA, surface and in the atmosphere during January 2006 to January 2007 over Delhi.
were estimated. Figure 7 shows the result of this exercise where changes in optical properties of the aerosol with vary-ing concentration of BC have been plotted. One can notice that an increase in BC concentration from 2 to 20 µg m−3 leads to a decrease in SSA from 0.90 to 0.60. The change in asymmetry parameter is from 0.68 to 0.63 and an increase in AOD at 500 nm is from 0.57 to 0.91. Thus we can see that on an average in the range of simulation (2–20 µg m−3 BC concentration) an increase of 2 µg m−3of BC can cause an average change in SSA of about 0.03 (0.05 at 4 µg m−3 and 0.02 at 20 µg m−3). As the maximum BC concentration measured was 16.7 µg m−3 as a result the maximum uncer-tainty in BC could be about 3.4 µg m−3which can lead to a maximum uncertainty of 0.07 in the SSA estimation. The standard deviation of the monthly averages of SSA also lies in the range 0.03 to 0.06.
5 Direct aerosol radiation forcing
The aerosol radiation forcing at any level in the atmosphere is defined as the difference in the net solar flux (down minus up) with and without aerosol, keeping all other parameters constant. In the present case direct aerosol radiation forcing (DARF) has been estimated in terms of W m−2at the sur-face and at the top of the atmosphere. The difference of the two therefore gives the DARF in the whole atmosphere. The DARF was estimated using the Santa Barbara DISORT At-mospheric Radiative Transfer model (SBDART). The model was developed at the University of California, Santa Barbara by Ricchiazzi et al. (1998) based upon reliable physical mod-els developed by the atmospheric science community and is being used widely for the radiative transfer calculations. The model uses a large number of parameters to estimate the ra-diation flux at different layers in the atmosphere. The pa-rameters critical for DARF estimations are the AOD, sin-gle scattering albedo (SSA), asymmetry parameter, surface albedo, profiles of atmospheric parameters (temperature, hu-midity, ozone and other gases), and solar geometry of lo-cation. The profiles of atmospheric parameters are
gener-ally fixed by once choosing the model atmosphere out of the available options in the model.
On the basis of prevailing weather conditions and the mea-sured meteorological parameters, we have used the mid-latitude summer atmospheric model in the present case. In order to have a better representation of the atmosphere, we have also used the integrated column ozone and the average integrated water vapor values for Delhi. The surface albedo values were obtained for the year 2006 from the Aura OMI version 3 reflectivity data through Giovanni online data sys-tem, developed and maintained by the NASA GES DISC. The average monthly values of surface albedo during win-ters ranged from 0.15 to 0.20 and during the months June– August, it ranged from 0.25 to 0.30. The other two critical parameters SSA and Assymetry parameters were estimated using the OPAC model as described in the above section. Us-ing these parameters the SBDART model was run with eight streams to obtain the TOA and the surface downward and upward fluxes at 1-h interval for a 24-h period with aerosols and without aerosols separately. DARF was then calculated at TOA and surface.
Figure 6 shows the average variation in DARF along with the standard deviations obtained over Delhi at the surface, TOA and in the atmosphere every month. The average forcing for the whole period of observations at the surface was of the order of −67 W m−2, at the top of the atmo-sphere it was about 4 W m−2, giving rise to an atmospheric forcing of about +71 W m−2. The DARF at the surface is found to be maximum (maximum negative) during the pre-monsoon months of May (−110±20 W m−2)and min-imum (least negative) during August (−46±8 W m−2). The TOA forcing was maximum during June at 21±2 W m−2 and minimum at −1.4±0.4 W m−2 during November. The DARF in the atmosphere showed maximum value in the month of June (115±19 W m−2)and minimum during Au-gust (46±9 W m−2). The DARF values were generally high during summers and low during winters. The value increased from March to reach a maximum during May as the contribu-tion of dust aerosols generally increased in the atmosphere. Afterwards, as the monsoon started during July–August the values decreased and remained more or less constant during winters (after September), except for the month of October, which also had high AOD due to the increase in smoke and particulate matter owing to fire cracker burning during this festival months.
by varying one property at a time while keeping the oth-ers constant. It is thus used to find the sensitivity to the range of observed values and expressed as the radiative forc-ing efficiency. It is found that for 0.1 change in SSA the TOA forcing changes by −8.7 W m−2 and surface forcing by 14.7 W m−2. Similarly, for AOD the radiative forcing efficiency at TOA is 7.4 W m−2 and at the surface it is −12.7 W m−2.
6 Conclusions
The monthly mean variations of the aerosol optical proper-ties like, AOD, SSA and the asymmetry factor along with the surface albedo were studied over the mega-city of Delhi dur-ing the year 2006. Their subsequent impacts on the DARF at TOA and at the surface were estimated. We have ob-served a high AOD value and a very high load of BC aerosols throughout the year. The AOD showed peaks during pre-monsoon months of May–June and again in October. The former was due to the heavy load of desert dust aerosols aris-ing due to sandstorms duraris-ing pre-monsoon and the later was due to burning of crackers during festivities. Consequently they have a bearing on the DARF estimation over Delhi dur-ing the year. From the present study of aerosols optical char-acteristics over Delhi during January 2006 to January 2007 and the estimation of DARF, the following conclusions can be made:
1. The annual average AOD at 500 nm during the period of present observations is∼0.86±0.42 with an average Angstrom exponent∼0.68±0.35. The average monthly AOD and Angstrom exponent throughout the year are found to be in the range 0.56 to 1.22 and 0.38 to 0.96, respectively.
2. The monthly variations of aerosols over Delhi have three characteristic features: (a) During pre-monsoon period high AOD values associated with very lowα val-ues are observed showing dominance of desert aerosols, (b) in the post monsoon to winter period moderate AOD values are associated with the moderate to highα val-ues, indicating dominant anthropogenic aerosols in the atmosphere, and (c) during autumn season moderate to low AOD are associated with the moderate to high α values, indicating mixed aerosol over Delhi.
3. The monthly average SSA over Delhi is found to be in the range 0.70 to 0.89 which is largely affected by the BC concentration that lies in the range 4–15 µg m−3as monthly average during daytime.
4. When the dust concentration was highest (May–June) the SSA increased with wavelength, however, when dust concentration was low the SSA decreased with the wavelength.
5. The monthly average clear-sky DARF at the surface var-ied in the range−45 W m−2to−110 W m−2 through-out the year. The value of monthly DARF at TOA was found to be in the range−1 to 21 W m−2and in the at-mosphere it was in the range 46 W m−2to 115 W m−2 throughout the year.
Acknowledgements. A part of this work was sponsored by the ISRO-GBP during ICARB campaign. The author TB is thankful to CSIR for her Senior Research Fellowship being provided during this work.
Topical Editor P. Drobinski thanks one anonymous referee for her/his help in evaluating this paper.
References
Angstrom, A.: The parameters of atmospheric turbidity, Tellus, 16, 64–75, 1964.
Arnott, W. P., Hamasha, K., Moosmuller, H., Shredian, P. J., and Or-gen, J. A.: Towards aerosol light-absorption measurements with a 7-wavelength aethalometer: Evaluation with a photoacoustic instrument and 3-wavelength nephelometer, Aerosol Sci. Tech-nol., 39, 17–29, 2005.
Attri, A. K., Kumar, U., and Jain, V. K.: Formation of ozone by fireworks, Nature, 411, 1015, 2001.
Beegum, S. N., Moorthy, K. K., Nair, V. S., Babu, S. S., et al.: Characteristics of spectral aerosol optical depths over India dur-ing ICARB, J. Earth Syst. Sci., 117, 303–313, 2008.
Bhat, G. S., Gadgil, S, Kumar, P. V. H., Kalsi, S. R., et al.: BOB-MEX: The Bay of Bengal monsoon experiment, B. Am. Meteo-rol. Soc., 82, 2217–2243, 2001.
Charlson, R. J., Schwartz, S. E., Hales, J. M., Ces, R. D., Coakley Jr., J. A., Hansen, J. E., and Hoffman, D. J.: Climate forcing by anthropogenic aerosols, Science, 255, 423–430, 1992.
Chung, S. H. and Seinfeld, J. H.: Global distribution and climate forcing of carbonaceous aerosols, J. Geophys. Res., 107(D19), 4407, doi:10.1029/2001JD001397, 2002.
Dey, S., Tripathi, S. N., Singh, R. P., and Holben, B. N.: In-fluence of dust storm on the aerosol optical properties over the Indo-Gangetic basin, J. Geophys. Res., 109, D20211, doi:10.1029/2004JD004924, 2004.
Dey, S., Tripathi, S. N., and Mishra, S. K.: Probable mixing state of aerosols in the Indo-Gangetic Basin, northern India, Geophys. Res. Lett., 35, L03808, doi:10.1029/2007GL032622, 2008. Dubovik, O., Holben, B., Eck, T. F., Smirnov, A., Kaufman, Y, J.,
King, M. D., Tanre, D., and Slutsker, I.: Variability of absorption and optical properties of key aerosol types observed in world-wide locations, J. Atmos. Sci., 59, 590–608, 2002.
Dubovik, O., Sinyuk, A., Lapyonok, T., Holben, B. N., et al.: Ap-plication of spheroid models to account for aerosol particle non-sphericity in remote sensing of desert dust, J. Geophys. Res., 111, D11208, doi:10.1029/2005JD006619, 2006.
Duce, R. A.: Sources, distributions, and fluxes of mineral aerosols and their relationship to climate, in: Aerosol Forcing of Climate, edited by: Charlson, R. J. and Heintzenberg, J., Wiley, New York, 43–72, 1995.
depen-dence of the optical depth of biomass burning, urban, and desert dust aerosols, J. Geophys. Res., 104, 31333–31349, 1999. Hansen, A. D. A., Rosen, H., and Novakov, T.: The aethalometer, an
instrument for the real-time measurement of optical absorption by aerosol particles, Sci. Total Environ., 36, 191–196, 1984. Hansen, A. D. A., Kapustin, V. N., Kopeikin, V. M., Gillette, D. A.,
Bodhaine, B. A.: Optical absorption by aerosol black carbon and dust in a desert region of central Asia, Atmos. Environ., 27(A), 2527–2531, 1993.
Hansen, A. D. A.: Magee Scientific aethalometer user’s guide, Magee Sci. Co., Berkeley, Calif., 56 p., 1996.
Haywood, J. and Boucher, O.: Estimates of the direct and indi-rect radiative forcing due to tropospheric aerosols: a review, Rev. Geophys., 38(4), 513–543, 2000.
Haywood, J. M. and Shine, K. P.: The effect of anthropogenic sul-fate and soot aerosol on the clear-sky planetary radiation budget, Geophys. Res. Lett., 22(5), 603–606, 1995.
Hess, M., Koepke, P., and Schultz, I.: Optical properties of aerosols and clouds: The software package OPAC, B. Am. Meteorol. Soc., 79, 831–844, 1998.
Holben, B. N., Eck, T. F., Slutsker, I., Tanre, D., et al.: AERONET – A federated instrument network and data archive for aerosol characterization, Rem. Sen. Environ., 66, 1–16, 1998.
Holler, R., Ito, K., Tohno, S., and Kasahara, M.: Wavelength-dependent aerosol single-scattering albedo: Measurements and model calculations for a coastal site near the Sea of Japan during ACE-Asia, J. Geophys. Res., 108(D23), 8648, doi:10.1029/2002JD003250, 2003.
Intergovernmental Panel on Climate Change (IPCC): Climate change 2007: The physical science basis: Contribution of Work-ing Group I to the Fourth Assessment Report of the Intergovern-mental Panel on Climate Change, Chapter 2, pp 129, 2007. Jacobson, M. Z.: Strong radiative heating due to the mixing state
of black carbon in atmospheric aerosols, Nature, 409, 695–697, 2001.
Jayaraman, A., Gadhavi, H., Ganguly, D., Misra, A., Ramachan-dran, S., and Rajesh, T. A.: Spatial variations in aerosol charac-teristics and regional radiative forcing over India: Measurements and modeling of 2004 road campaign experiment, Atmos. Envi-ron., 40, 6504–6515, 2006.
Li, Z., Chen, H., Cribb, M., Dickerson, R., et al.: Preface to spe-cial section on East Asian Studies of Tropospheric Aerosols: An International Regional experiment (EAST-AIRE), J. Geophys. Res., 112, D22S00, doi:10.1029/2007JD008853, 2007. Miller, R. L. and Tegen, I.: Climate response to soil dust aerosols,
J. Climate, 11(12), 3247–3267, 1998.
Mishra, S. K., Day, S., and Tripathi, S. N.: Implications of parti-cle composition and shape to dust radiative effect: A case study from the Great Indian Desert, Geophys. Res. Lett., 35, L23814, doi:10.1029/2008GL036058, 2008.
Moorthy, K. K., Satheesh, S. K., Babu, S. S., and Dutt, S. B. S.: Integrated campaign for aerosols, gases and radiation budget (ICARB): An overview, J. Earth Sys. Sci., 117, 243–262, 2008. Morys, M., Mims III, F. M., Hagerup, S., Anderson, S. E., Baker,
A., Kia, J., and Walkup, T.: Design, calibration, and performance of Microtops II handheld ozone monitor and sun photometer, J. Geophys. Res., 106, 14573–14582, 2001.
Pandithurai, G., Pinker, R. T., Takamura, T., and Devara, P. C. S.: Aerosol radiative forcing over a tropical urban site in India,
Geo-phys. Res. Lett., 31, L12107, doi:10.1029/2004GL019702, 2004. Pandithurai, G., Dipu, S., Dani, K. K., Tiwari, S., Bisht, D. S., De-vara, P. C. S., and Pinker, R. T.: Aerosol radiative forcing dur-ing dust events over New Delhi, India, J. Geophys. Res., 113, D13209, doi:10.1029/2008JD009804, 2008.
Pant, P., Hegde, P., Dumka, U. C., Sagar, R., Satheesh, S. K., Moor-thy, K. K., Saha, A., and Srivastava M. K.: Aerosol character-istics at a high-altitude location in central Himalayas: Optical properties and radiative forcing, J. Geophys. Res., 111, D17206, doi:10.1029/2005JD006768, 2006.
Prasad, A. K. and Singh, R. P.: Changes in aerosol parameters dur-ing major dust storm events (2001–2005) over the Indo-Gangetic Plains using AERONET and MODIS data, J. Geophys. Res., 112, D09208, doi:10.1029/2006JD007778, 2007.
Parungo, F.: Asian dust storms and their effect on radiation and climate: Part 4, NOAA Science Technology Report, 3134, 1997. Penner, J. E.: Carbonaceous aerosols influencing atmospheric radi-ation: Black and organic carbon, in: Aerosol Forcing of Climate, edited by: Charlson, R. J. and Heintzenberg, J., pp. 91–108, Wi-ley, New York, 1995.
Penner, J. E., Dong, X., and Chen, Y.: Observational evidence of a change in radiative forcing due to indirect aerosol effect, Nature, 427, 231–234, 2004.
Prasad, A. K., Singh, S., Chauhan, S. S., Srivastava, M. K., Singh, R. P., Singh, R., and Holben, B.: Large aerosol radiative forcing over the Indo-Gangetic plains during major dust storms, Atmos. Environ., 41, 6289–6301, doi:10.1016/j.atmosenv.2007.03.060, 2007.
Prospero, J. M., Ginoux, P., Torres, O., Nicholson, S. E., and Gill, T. E.: Environmental characterization of global sources of at-mospheric soil dust identified with the Nimbus 7 Total Ozone Mapping Spectrometer (TOMS) absorbing aerosol product, Rev. Geophys., 40(1), 1002, doi:10.1029/2000RG000095, 2002. Quijano A. L., Sokolik, I. N., and Toon, O. B.: Radiative heating
rates and direct radiative forcing by mineral dust in cloudy atmo-spheric conditions, J. Geophys. Res., 105, 12207–12219, 2000. Ramachandran, S.: Aerosol radiative forcing over Bay of
Ben-gal and Chennai: Comparison with maritime, continental, and urban aerosol models, J. Geophys. Res., 110, D21206, doi:10.1029/2005JD005861, 2005.
Ramachandran, S., Rengarajan, R., Jayaraman, A., Sarin, M. M., and Das, S. K.: Aerosol radiative forcing during clear, hazy, and foggy conditions over a continental polluted lo-cation in north India, J. Geophys. Res., 111, D20214, doi:10.1029/2006JD007142, 2006.
Ramanathan, V., Crutzen, P. J., Lelieveld, J., Mitra, A. P., et al.: In-dian Ocean Exoeriment: An integrated analysis of the climate forcing and effects of the great Indo-Asian haze, J. Geophys. Res., 106, 28371–28398, 2001.
Ricchiazzi, P., Yang, S., Gautier, C., and Sowle, D.: SBDART: A research and teaching software tool for plane-parallel radiative transfer in the earth’s atmosphere, B. Am. Meteorol. Soc., 79, 2101–2114, 1998.
Schmid, B., Michalsky, J., Halthore, R., Beauharnois, M., Har-rison, L., Livingston, J., Russell, P., Holben, B., Eck, T., and Smirnov, A.: Comparison of aerosol optical depth from four so-lar radiometers during the fall 1997 ARM Intensive Observation Period, Geophys. Res. Lett., 26, 2725–2728, 1999.
Delhi during pre-monsoon months: Characteristics and effects on surface radiation forcing, Geophys. Res. Lett., 32, L13808, doi:10.1029/2005GL023062, 2005.
Srivastava, M. K., Singh, S., Saha, A., Dumka, U. C., Hegde, P., Singh, R., and Pant, P.: Direct solar ultraviolet irradiance over Nainital, India, in the central Himalayas for clear-sky day con-ditions during December 2004, J. Geophys. Res., 111, D08201, doi:10.1029/2005JD006141, 2006.
Tegen, I., Werner, M., Harrison, S. P., and Kohfeld, K. E.: Rela-tive importance of climate and land use in determining present and future global soil dust emission, Geophys. Res. Lett., 31, L05105, doi:10.1029/2003GL019216, 2004.
Tripathi, S. N., Day, S., Tare, V., and Satheesh, S. K.: Aerosol black carbon radiative forcing at an industrial city in northern India, Geophys. Res. Lett., 32, L08802, doi:10.1029/2005GLO22515, 2005.
Wang, C.: A modeling study on the climate impacts of black carbon aerosols, J. Geophys. Res., 109, D03106, doi:10.1029/2003JD004084, 2004.
Weingartner, E., Saathoff, H., M. Schnaiter, Streit, N., Bitnar, B., and Baltensperger, U.: Absorption of light by soot particles: de-termination of the absorption coefficient by means of aethalome-ters, J. Aerosol Sci., 34(10), 1445–1463, 2003.