ACPD
14, 31515–31550, 2014A novel methodology for assessing the
DARF
E. T. Sena and P. Artaxo
Title Page
Abstract Introduction
Conclusions References
Tables Figures
◭ ◮
◭ ◮
Back Close
Full Screen / Esc
Printer-friendly Version Interactive Discussion
Discussion
P
a
per
|
Discussion
P
a
per
|
Discussion
P
a
per
|
Discussion
P
a
per
|
Atmos. Chem. Phys. Discuss., 14, 31515–31550, 2014 www.atmos-chem-phys-discuss.net/14/31515/2014/ doi:10.5194/acpd-14-31515-2014
© Author(s) 2014. CC Attribution 3.0 License.
This discussion paper is/has been under review for the journal Atmospheric Chemistry and Physics (ACP). Please refer to the corresponding final paper in ACP if available.
A novel methodology using MODIS and
CERES for assessing the daily radiative
forcing of smoke aerosols in large scale
over the Amazonia
E. T. Sena and P. Artaxo
Institute of Physics, University of São Paulo, São Paulo, Brazil
Received: 8 October 2014 – Accepted: 28 November 2014 – Published: 15 December 2014
Correspondence to: E. T. Sena ([email protected])
ACPD
14, 31515–31550, 2014A novel methodology for assessing the
DARF
E. T. Sena and P. Artaxo
Title Page
Abstract Introduction
Conclusions References
Tables Figures
◭ ◮
◭ ◮
Back Close
Full Screen / Esc
Printer-friendly Version Interactive Discussion
Discussion
P
a
per
|
Discussion
P
a
per
|
Discussion
P
a
per
|
Discussion
P
a
per
|
Abstract
A new methodology was developed for obtaining daily retrievals of the direct radia-tive forcing of aerosols (24h-DARF) at the top of the atmosphere (TOA) using satellite remote sensing. For that, simultaneous CERES (Clouds and Earth’s Radiant Energy System) shortwave flux at the top of the atmosphere (TOA) and MODIS (Moderate
5
Resolution Spectroradiometer) aerosol optical depth (AOD) retrievals were used. This methodology is applied over a large region of Brazilian Amazonia. We focused our studies on the peak of the biomass burning season (August to September) from 2000 to 2009 to analyse the impact of forest smoke on the radiation balance.
To assess the spatial distribution of the DARF, background scenes without biomass
10
burning impacts, were defined as scenes with MODIS AOD<0.1. The fluxes at the TOA retrieved by CERES for those clean conditions (Fcl) were estimated as a function
of the illumination geometry (θ0) for each 0.5 ◦
×0.5◦grid cell. The instantaneous DARF was obtained as the difference between cleanFcl(θ0) and the polluted mean flux at the
TOA measured by CERES in each cell (Fpol(θ0)). The radiative transfer code SBDART
15
(Santa Barbara DISORT Radiative Transfer model) was used to expand instantaneous DARFs to 24 h averages. With this methodology it is possible to assess the DARF both at large scale and at high temporal resolution. This new methodology also showed to be more robust, because it considerably reduces statistical sources of uncertainties in the estimates of the DARF, when compared to previous assessments of the DARF
20
using satellite remote sensing.
The spatial distribution of the 24h-DARF shows that, for some cases, the mean 24h-DARF presents local values as high as −30 W m−2. The temporal variability of the 24h-DARF along the biomass burning season was also studied and showed large intraseasonal and interannual variability. In an attempt to validate the radiative
forc-25
ACPD
14, 31515–31550, 2014A novel methodology for assessing the
DARF
E. T. Sena and P. Artaxo
Title Page
Abstract Introduction
Conclusions References
Tables Figures
◭ ◮
◭ ◮
Back Close
Full Screen / Esc
Printer-friendly Version Interactive Discussion
Discussion
P
a
per
|
Discussion
P
a
per
|
Discussion
P
a
per
|
Discussion
P
a
per
|
(1.07±0.04)DARF24 hAERONET −(0.0±0.6). This is a significant result, considering that the 24h-DARF retrievals were obtained by applying completely different method-ologies, and using different instruments. The instantaneous CERES-MODIS DARF was also compared with radiative transfer evaluations of the forcing. To validate the aerosol and surface models used in the simulations, downward shortwave fluxes at
5
the surface evaluated using SBDART and measured by pyranometers were compared. The simulated and measured downward fluxes are related through FBOAPYRANOMETER =
(1.00±0.04)FBOASBDART −(20±27), indicating that the models and parameters used in the simulations were consistent. The relationship between CERES-MODIS instanta-neous DARF and calculated SBDART forcing was satisfactory, with DARFCERES-MODIS
10
=(0.86±0.06)DARFSBDART −(6±2). Those analysis showed a good agreement be-tween satellite remote sensing, ground-based and radiative transfer evaluated DARF, demonstrating the robustness of the new proposed methodology for calculated radia-tive forcing for biomass burning aerosols. To our knowledge, this was the first time satellite remote sensing assessments of the DARF were compared with ground based
15
DARF estimates.
1 Introduction
The Amazonia is the largest tropical rainforest of the world, occupying an area of more than 6.6 million km2in South America. This large ecosystem plays a crucial role in regulating global and regional climate and the hydrological cycle, powering global
20
atmospheric circulation, transporting heat and moisture to continental areas (Artaxo et al., 2013; Davidson and Artaxo, 2004). In the last decades, anthropogenic ac-tivities, such as deforestation for agricultural and urban expansion have highly dis-turbed this important environment (Betts et al., 2008; Bowman et al., 2009; Davidson et al., 2012). During the wet season, the Amazon Basin is one of the few continental
25
ACPD
14, 31515–31550, 2014A novel methodology for assessing the
DARF
E. T. Sena and P. Artaxo
Title Page
Abstract Introduction
Conclusions References
Tables Figures
◭ ◮
◭ ◮
Back Close
Full Screen / Esc
Printer-friendly Version Interactive Discussion
Discussion
P
a
per
|
Discussion
P
a
per
|
Discussion
P
a
per
|
Discussion
P
a
per
|
The population of aerosols during the wet season is dominated by primary biogenic coarse mode particles (Martin et al., 2010), and presents typical concentration of about 300 particles cm−3(Artaxo et al., 2002). This scenario changes dramatically during the dry season, with particle concentration reaching around 20 000 particles cm−3 due to biomass burning emissions (Andreae et al., 2002; Artaxo et al., 2009; Echalar et al.,
5
1998; Holben et al., 1996). Furthermore, not only does the absolute concentration of particles strongly increases, but there are also tremendous modifications in the size distribution of aerosols, since most of the particles emitted during burning events be-long to the fine mode (Dubovik et al., 2002; Eck et al., 2003; Schafer et al., 2008).
Aerosol particles can modify the Earth’s radiative balance in two ways: (i) directly,
10
by interacting with solar radiation, through scattering and absorption processes (eg., Charlson et al., 1992; Chylek and Wong, 1995), and (ii) indirectly, by modifying the microphysical structure of clouds, such as droplet size distribution, cloud albedo and other properties (eg., Albrecht et al., 1989; Andreae et al., 2004; Coakley et al., 1987; Koren et al., 2008; Twomey et al., 1977). These effects depend on the concentration
15
and on the horizontal and vertical distributions of particles in the atmosphere, on their optical properties, such as single scattering albedo, size distribution, phase function, hygroscopicity, and on the surface reflectance properties of the underlying region (eg., Haywood and Boucher, 2000; Yu et al., 2006). In particular, biomass burning aerosols play an important role in modifying the radiative energy balance of the affected region
20
because fine mode particles interact efficiently with solar radiation (Liou, 2002). The direct aerosol radiative forcing (DARF) in Amazonia was previously assessed us-ing radiative transfer models coupled with either ground-based remote sensus-ing (Proco-pio et al., 2004) or intensive field-campaigns in-situ measurements (Ross et al., 1998). Although these approaches may provide detailed insight about a specific burning event
25
ACPD
14, 31515–31550, 2014A novel methodology for assessing the
DARF
E. T. Sena and P. Artaxo
Title Page
Abstract Introduction
Conclusions References
Tables Figures
◭ ◮
◭ ◮
Back Close
Full Screen / Esc
Printer-friendly Version Interactive Discussion
Discussion
P
a
per
|
Discussion
P
a
per
|
Discussion
P
a
per
|
Discussion
P
a
per
|
TOA combined with MODIS (Moderate Resolution Spectroradiometer) or MISR (Multi-angle Imaging Spectroradiometer) aerosol optical depth (AOD) to assess the mean DARF over Amazonia during the biomass burning season and analyzes its spatial vari-ability (Patadia et al., 2008; Sena et al., 2013). This technique (CERES+MODIS) has also been widely applied to evaluate the mean DARF over a time period (usually 2–
5
3 months) in several other regions (eg., Christopher, 2011; Zhang et al., 2005; Feng and Christopher, 2014; Sundström et al., 2014). Although these studies focused on averages are useful, they lack the high temporal resolution needed to observe impor-tant details on the changes of the radiative balance due to the short residence time of aerosols in the atmosphere. During the dry season, aerosol residence time within
10
the boundary layer is estimated in about 4 to 6 days (Edwards et al., 2006; Freitas et al., 2005). Also, biomass burning aerosols can be transported over great distances away from their sources (Andreae et al., 2001; Longo et al., 2009), depending on the prevalent dynamics in the studied area. Due to their short lifetime and to the dynam-ics of transport of these particles, aerosols present highly inhomogeneous spatial and
15
temporal distributions. With that in mind, this work has developed a methodology for calculating DARF in Amazonia with higher spatial and temporal resolution than previ-ous assessments (0.5◦×0.5◦and 1 day, respectively) using satellite remote sensing.
The main goals of this work were:
1. to introduce a new methodology to assess the daily direct radiative forcing of
20
biomass burning aerosols in large scale over the Amazonia using satellite remote sensing (Sect. 2);
2. to analyse the intraseasonal and interannual variability of the daily average DARF as well as its mean daily spatial distribution pattern over Amazonia (Sects. 3.1 and 3.2);
25
ACPD
14, 31515–31550, 2014A novel methodology for assessing the
DARF
E. T. Sena and P. Artaxo
Title Page
Abstract Introduction
Conclusions References
Tables Figures
◭ ◮
◭ ◮
Back Close
Full Screen / Esc
Printer-friendly Version Interactive Discussion
Discussion
P
a
per
|
Discussion
P
a
per
|
Discussion
P
a
per
|
Discussion
P
a
per
|
We also believe that this methodology could be easily applied to study the DARF24h in other regions of the world, impacted by biomass burning or even urban pollution.
2 Data and methods
In this work, combined CERES shortwave flux at the top of the atmosphere (TOA) and MODIS aerosol optical depth (AOD) at 550 nm retrievals were used to assess the
5
direct radiative forcing of biomass burning aerosols over the Amazon Basin for cloud-free conditions. Both these instruments are aboard NASA’s Terra and Aqua satellites.
CERES sensors are passive scanning radiometers that measure the upward radi-ance in three broadband channels: (i) between 0.3 to 5.0 µm, to measure the short-wave radiation reflected in the solar spectrum, (ii) between 8 and 12 µm, to measure
10
the thermal radiation emitted by the Earth in the atmospheric window spectral region, and (iii) between 0.3 and 200 µm to measure the total radiation spectrum emerging at the TOA (Wielicki et al., 1996). Radiance measurements are converted into broadband radiative fluxes through the use of angular distribution models (ADMs) (Loeb et al., 2005).
15
MODIS sensor measure the radiance at the TOA in 36 narrow spectral bands be-tween 0.4 and 14.4 µm (Salomonson et al., 1989). Among its various applications, MODIS observations have been widely used to monitor land surface, oceans and atmo-sphere properties and to provide information about clouds and aerosols optical prop-erties, their spatial and temporal variations, and the interaction between aerosols and
20
clouds (King et al., 1992).
CERES Single Scanner Footprint (CERES-SSF) product provides simultaneous re-trievals of the upward flux at the TOA derived by CERES on three broadband channels, and properties of aerosols and clouds reported by MODIS. In this product, MOD04 aerosol and clouds properties, that are originally reported with a 10 km spatial
reso-25
ACPD
14, 31515–31550, 2014A novel methodology for assessing the
DARF
E. T. Sena and P. Artaxo
Title Page
Abstract Introduction
Conclusions References
Tables Figures
◭ ◮
◭ ◮
Back Close
Full Screen / Esc
Printer-friendly Version Interactive Discussion
Discussion
P
a
per
|
Discussion
P
a
per
|
Discussion
P
a
per
|
Discussion
P
a
per
|
For the development of the new methodology presented here, we used CERES-SSF Edition 3A shortwave flux at the TOA retrievals from Terra satellite over the Amazon Basin from 1 July to 31 October from 2000 to 2009. The studied area was limited between the coordinates 3◦N–20◦S, 45–65◦W and 3◦N–11◦S, 65–74◦W. Pixels with 1 km resolution MODIS cloud fraction above 0.5 % and with a clear area in the MODIS
5
250 m resolution lower than 99.9 % were removed. To limit distortions we removed from our analysis pixels that presented view and solar zenith angles greater than 60◦. The DARF was calculated with a 0.5◦×0.5◦ latitude/longitude spatial resolution, according to the methodology described in the next section.
2.1 Evaluation of the daily direct RF of biomass burning aerosols 10
The direct radiative forcing of aerosols (DARF) can be defined as the difference be-tween the upward radiation flux at the TOA measured in background conditions (Fcl)
and in polluted conditions (Fpol).
DARF=Fcl−Fpol. (1)
For each scene observed by CERES,Fpolcan be obtained directly from the mean flux
15
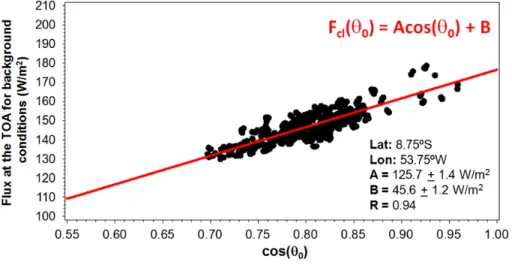
at the TOA for each 0.5◦×0.5◦grid cell. To calculate the instantaneous DARF, we need to estimate what would be the flux at the TOA for background conditions (Fcl) for the
same illumination geometry of the polluted scene. To perform this estimate, scenes that presented aerosol optical depth (AOD) smaller than 0.1 were selected, and considered as background scenes. For each cell, the flux at the TOA observed for background
20
scenes (Fcl) during the 40 months studied period was plotted against the cosine of the
solar zenith angle (cos(θ0)). An example of this plot, for the grid cell centred at latitude
8.75◦S and longitude 53.75◦W, is shown in Fig. 1. A correlation coefficient of 0.94 betweenFcland cos(θ0) was observed for the data points within this cell indicating the
adequacy of the linear aproximation.
25
ACPD
14, 31515–31550, 2014A novel methodology for assessing the
DARF
E. T. Sena and P. Artaxo
Title Page
Abstract Introduction
Conclusions References
Tables Figures
◭ ◮
◭ ◮
Back Close
Full Screen / Esc
Printer-friendly Version Interactive Discussion
Discussion
P
a
per
|
Discussion
P
a
per
|
Discussion
P
a
per
|
Discussion
P
a
per
|
linearly with cos(θ0). By adjusting a linear fit to the data points within each cell we can
calculateFcl(θ0) for any illumination geometry, according to Eq. (2),
Fcl(θ0)=Acos(θ0)+B, (2)
whereAandBcorrespond to the slope and the intercept of the linear fit, respectively. To assess the instantaneous DARF, the mean solar zenith angle within each cell
5
during the satellite passage time was identified for every polluted scene. For each cell, the instantaneous DARF was evaluated as the difference betweenFcl(θ0) and the
mean flux at the TOA retrieved by CERES in polluted conditions (Fpol(θ0)), as previously
stated in Eq. (1). The uncertainty of the DARF in each cell (σDARF), was computed using
error propagation, according to the following equation:
10
σDARF2 =σA2cos2(θ0)+σB2+2cov(A,B) cos(θ0)+σFpol2 , (3)
whereσA,σB and cov(A,B) are the uncertainty of the slope, intercept and the covari-ance between the slope and the intercept, respectively;σFpol is the uncertainty of the
of the flux in each cell for the polluted condition.
2.2 Correction of the DARF according to empirical ADMs 15
As already discussed, to convert CERES radiances measurements to radiative flux at the TOA it is necessary to define the angular distribution models (ADMs) for dif-ferent scenes (Loeb et al., 2005). In a recent work, Patadia et al. (2011) pointed out that the angular distribution models currently used by CERES team to derive short-wave fluxes at the TOA over land in cloud-free conditions do not take into account
20
aerosol properties in the observed scene. This can result in large errors in the short-wave fluxes derived by this sensor for areas with high concentrations of aerosols, such as the Amazonia during the biomass burning season. To estimate the impact of the anisotropy caused by high aerosol loading on the flux at the TOA, Patadia et al. (2011) developed a methodology to obtain new empirical angular distribution models for the
ACPD
14, 31515–31550, 2014A novel methodology for assessing the
DARF
E. T. Sena and P. Artaxo
Title Page
Abstract Introduction
Conclusions References
Tables Figures
◭ ◮
◭ ◮
Back Close
Full Screen / Esc
Printer-friendly Version Interactive Discussion
Discussion
P
a
per
|
Discussion
P
a
per
|
Discussion
P
a
per
|
Discussion
P
a
per
|
Amazon Basin region during the dry season. For this, the authors used radiance mea-surements obtained by CERES shortwave channel over the Amazonia for different view and solar illumination geometries between 2000 and 2008. In a later work they have assessed the difference between the DARF evaluated using both, CERES ADMs and their new empirical ADMs (Patadia and Christopher, 2014). They have found that, on
5
average, CERES DARF relates to the corrected DARF calculated with their empirical ADMs, according to the following equation:
DARFcorrected=DARF−52.27AOD−2.71+35.15AOD+1.78. (4)
The correction proposed by Patadia and Christopher (2014) was applied to the CERES-MODIS DARF estimates introduced in the previous section.
10
A discrete-ordinate radiative transfer (DISORT) code (Stamnes et al., 1988) was used to expand the instantaneous radiative forcing, calculated for the satellite passage time, to 24 h averages. MODIS BRDF/Albedo Model (MCD43B1) retrievals (Schaaf et al., 2002) over the studied area were used to develop the surface albedo models used in the radiative transfer calculations. Aerosol optical properties retrieved by the
15
AERONET (Aerosol Robotic Network) ground-based sun-photometers (Dubovik and King, 2000) located in the Amazonia during the dry season were also used in this com-putation. For a detailed description of the methodology used to perform this expansion please refer to Sena et al. (2013).
3 Results and discussions 20
In this section we will present and explore the main results obtained by applying the methodology introduced in Sect. 2.1 to assess the DARF. Some examples of the spatial distribution and the temporal variability of the 24h-DARF along the biomass burning season are shown and discussed in the next subsections. In Sect. 3.3, the average of the DARF during the biomass burning season of each year is computed and compared
25
ACPD
14, 31515–31550, 2014A novel methodology for assessing the
DARF
E. T. Sena and P. Artaxo
Title Page
Abstract Introduction
Conclusions References
Tables Figures
◭ ◮
◭ ◮
Back Close
Full Screen / Esc
Printer-friendly Version Interactive Discussion
Discussion
P
a
per
|
Discussion
P
a
per
|
Discussion
P
a
per
|
Discussion
P
a
per
|
3.1 Examples of the spatial distribution of the 24h-DARF
Aerosols can be transported over long distances away from their sources and, there-fore, can cover large areas (Prins et al., 1998). Two examples of the spatial distribution of the 24h-DARF, for 13 and 15 August 2005, are shown in Fig. 2, with their respective uncertainties. Composite images from MODIS’s red, blue and green spectral channels,
5
are also shown in this figure.
Figure 2 shows that, on 13 August 2005, the smoke plume covers a large area of the Brazilian Amazonia, between 4 and 12◦S and 55 and 70◦W. The 24h-DARF over the area was particularly high for that day, varying from about−15 to−30 W m−2. On 15 Au-gust 2005, we note that the smoke plume has moved Southeast, following the Andes
10
mountain range line, strongly impacting the Southern Amazonia, Western Bolivia and Northern Paraguay. The area located between 8 and 20◦S and 57 and 65◦W showed the highest 24h-DARF values for that day, also ranging from −15 to−30 W m−2. The 24h-DARF showed in Fig. 2b was, on average,−14.3±0.3 W m−2 on 13 August and
−15.6±0.3 W m−2 on 15 August. These results clearly show the importance of wind
15
circulation in the transport of aerosol plumes and how atmospheric dynamics may in-fluence the shortwave radiative balance of the region.
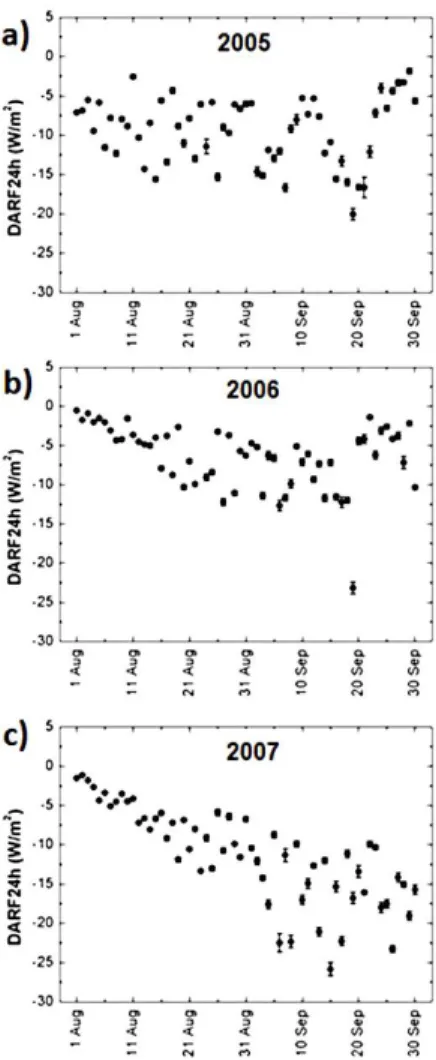
3.2 Temporal variability of the DARF along the biomass burning season
Due to the short lifetime of aerosols in the atmosphere, the DARF may vary largely along the 2 months of the biomass burning season. To analyze this temporal variability,
20
the average of the 24h-DARF over the studied area was calculated for each day of the year. Examples of the time series of the mean daily DARF during the biomass burning season of 2005, 2006 and 2007 are illustrated in Fig. 3.
Figure 3 shows that, besides its large interannual variability, the DARF also varies widely along the biomass burning season. Different temporal patterns along the
25
ACPD
14, 31515–31550, 2014A novel methodology for assessing the
DARF
E. T. Sena and P. Artaxo
Title Page
Abstract Introduction
Conclusions References
Tables Figures
◭ ◮
◭ ◮
Back Close
Full Screen / Esc
Printer-friendly Version Interactive Discussion
Discussion
P
a
per
|
Discussion
P
a
per
|
Discussion
P
a
per
|
Discussion
P
a
per
|
On the other hand, in 2007, the DARF became gradually more negative, starting around 0 W m−2 in the beginning of August and reaching values of the order of−25 W m−2 at the end of September. However, 2005 and 2007, both, present similar mean 24h-DARF during the burning season, as will be shown in the next section (Fig. 5). The temporal variation pattern during the biomass burning season of 2006 presents an intermediate
5
trend to those observed in 2005 and 2007. That is, the DARF becomes more negative until the beginning of September, when it saturates and finally turns less negative. The DARF variations from one day to the other, shown in these figures, are due to changes in cloudiness and at the area scanned by MODIS, that varies according to the satellite track.
10
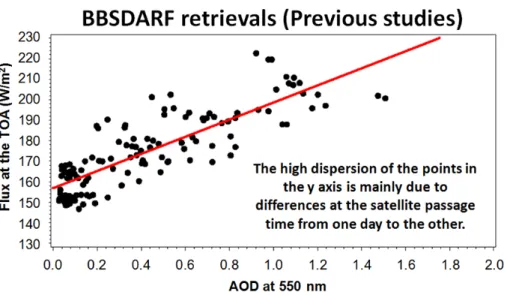
3.3 Average of the DARF during the biomass burning season
In previous studies (Patadia et al., 2008; Sena et al., 2013), the average of the direct radiative forcing of aerosols during the biomass burning season over the Amazonia was also calculated using CERES and MODIS sensors. In those approaches, the average flux for clean conditions during the biomass burning season (BBSFcl) for each cell
15
grid was estimated from the intercept of the regression between TOA fluxes and AOD retrievals from August to September (Fig. 4). The mean DARF during the biomass burning season (BBSDARF) was then calculated by subtracting the mean flux at the TOA (BBSFpol) from the mean flux for clean conditions (BBSFcl) observed as averages
during the two-months studied period.
20
The new methodology introduced here (Sect. 2.1), provides the 24h-DARF for each individual day of the year, that is, in a much higher temporal resolution than the one used in previous studies. In this section we aim to compare the DARF obtained using the new methodology introduced in Sect. 2.2 with the seasonal DARF values calcu-lated previously by Sena et al., 2013. For this comparison, the daily DARF, obtained in
25
this work, was averaged between the months of August and September of each year (h24hDARFiBBS). To ensure that we make a fair comparison, the corrections proposed
ACPD
14, 31515–31550, 2014A novel methodology for assessing the
DARF
E. T. Sena and P. Artaxo
Title Page
Abstract Introduction
Conclusions References
Tables Figures
◭ ◮
◭ ◮
Back Close
Full Screen / Esc
Printer-friendly Version Interactive Discussion
Discussion
P
a
per
|
Discussion
P
a
per
|
Discussion
P
a
per
|
Discussion
P
a
per
|
this paper (Sect. 2.2), were also applied a posteriori to the Sena et al., 2013 seasonal forcing (BBSDARF). Figure 5 shows the mean AOD at 550 nm during the biomass burning, and the comparison betweenh24hDARFiBBS and BBSDARF, calculated over
the studied area, from 2000 to 2009.
Figure 5 shows that theh24hDARFiBBSis consistently lower than the BBSDARF. The
5
average of the BBSDARF for this 10 year period (2000 to 2009) was−8.2±2.1 W m−2, while the 10 year average of theh24hDARFiBBSwas smaller at−5.2±2.6 W m
−2
. Part of this difference may be explained by the different references used for the evaluation of the flux for clean conditions. In the old methodology used by Sena et al., 2013, BBSFcl was defined considering AOD=0, since the clean condition was chosen as
10
the intercept between fluxes and AOD=0. This methodology leads to the effect that the contribution of background aerosols (AOD approximately 0.1) was not accounted for in the final evaluation of BBSDARF. On the other hand, in the new methodology introduced here,Fcl was defined specifically for more realistic background conditions,
according to Sect. 2.1. Therefore, it was expected that the h24hDARFiBBS would be
15
less negative than the BBSDARF. Radiative transfer calculations done with SBDART (Santa Barbara DISORT Radiative Transfer model) (Richiazzi et al., 1998) suggest that the contribution of background aerosols at AOD=0.1 to the 24h-DARF over the Amazonia is about−2 W m−2. Therefore, the contribution of background aerosols may explain the magnitude of the differences in the radiative forcings obtained from 2005
20
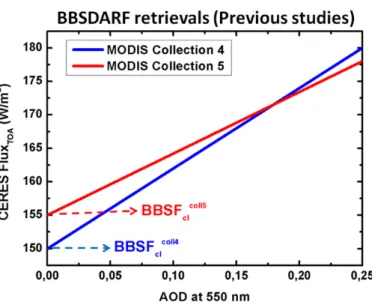
on, but not before that year. Part of the DARF differences observed from 2000 to 2003, are most certainly associated with the aerosol optical properties contained in CERES-SSF product, Edition 3A, that was used both in this work and by Sena et al. (2013). This product provides aerosol optical properties calculated using MODIS aerosol algorithm MOD04 – collection 4 until mid-2005, and MOD04 – collection 5 after that date. A major
25
ACPD
14, 31515–31550, 2014A novel methodology for assessing the
DARF
E. T. Sena and P. Artaxo
Title Page
Abstract Introduction
Conclusions References
Tables Figures
◭ ◮
◭ ◮
Back Close
Full Screen / Esc
Printer-friendly Version Interactive Discussion
Discussion
P
a
per
|
Discussion
P
a
per
|
Discussion
P
a
per
|
Discussion
P
a
per
|
lower resolution, it may be overestimated, since negative AOD values were removed from the average. Thus, when applying the methodology used by Patadia et al. (2008) and Sena et al. (2013), to CERES-SSF data that contained MOD04 – collection 4 AOD, the BBSFclis underestimated and, therefore, the BBSDARF is overestimated (Fig. 6). This explains the differences between both DARF evaluations observed in Fig. 5.
5
The solar zenith angle strongly influences the upward flux at the TOA (FTOA). CERES
fluxes retrievals obtained over the same surface, for the same aerosol loading and same atmospheric conditions, and at different illumination geometry will present diff er-entFTOA. In the previous methodology used in Sena et al., 2013, two months of data
were used to estimate the BBSDARF through the linear fit ofFTOA by AOD. Thus, flux
10
measurements performed on different days and at different times (and therefore dif-ferent solar zenith angles) contributed to increase the dispersion of the points on the
y axis, increasing the uncertainty of BBSDARF (Fig. 4). In the new methodology, the DARF is obtained as a function of the solar zenith angle, which eliminates the noise caused by solar zenith angle variations, observed in previous studies. This was another
15
important improvement of the methodology proposed in this work over the previously used methodology.
The mean correlations between the AOD 550 nm and theh24hDARFiBBSfrom 2000
to 2009 was −0.86±0.03, higher than the mean correlations between the AOD and BBSDARF previously obtained, of−0.75±0.05. This is another indication that the new
20
daily methodology proposed here is more robust to evaluate the DARF than the sea-sonal averaged methodology used in previous studies.
4 Validation of aerosol radiative forcing
The methodology proposed in this work uses upward TOA fluxes estimates from CERES-MODIS sensors aboard Terra for evaluating the DARF over the Amazonia and
25
ACPD
14, 31515–31550, 2014A novel methodology for assessing the
DARF
E. T. Sena and P. Artaxo
Title Page
Abstract Introduction
Conclusions References
Tables Figures
◭ ◮
◭ ◮
Back Close
Full Screen / Esc
Printer-friendly Version Interactive Discussion
Discussion
P
a
per
|
Discussion
P
a
per
|
Discussion
P
a
per
|
Discussion
P
a
per
|
date, the validation of these TOA fluxes has only been made indirectly, by comparing TOA fluxes retrieved by broadband radiometers aboard different satellites (Loeb et al., 2007). As previously discussed, the use of different ADMs to convert broadband radi-ance measurements into flux may introduce large differences in the DARF calculated using satellite remote sensors (Patadia and Christopher, 2014). We have applied a
cor-5
rection to the DARF based on Patadia et al. (2011) empirical ADMs that account for the influence of aerosols in the anisotropy of scattered radiation. Nevertheless, those new angular distribution functions are also not validated and, since there are no in-struments that directly measure the upward flux at the TOA, it is not possible to truly validate neither CERES ADMs nor Patadia’s empirical ADMs.
10
As an attempt to indirectly validate the DARF results obtained here, we compared the DARF, calculated in this work, with both ground-based measurements and radiative transfer models forcing estimates. In Sect. 4.1 we analyzed the intercomparison be-tween CERES-MODIS forcings, with those reported by AERONET’s (AErosol RObotic NETwork) radiative forcing product. In Sect. 4.2, CERES-MODIS forcings are also
com-15
pared with radiative forcing evaluations computed using SBDART (Santa Barbara DIS-ORT Atmospheric Radiative Transfer model) radiative transfer code (Richiazzi et al., 1998).
4.1 Intercomparison between CERES-MODIS and AERONET 24h-DARF
AERONET is one of the most successful ground-based global networks of sun/sky
20
radiometers for studying and monitoring aerosol physical properties around the world (Holben et al., 1998). Direct and almulcantar measurements from AERONET radiome-ters are used to retrieve the AOD and several column averaged aerosol optical and physical properties in different spectral bands. Extinction measurements on the spec-tral channel centered at 940 nm are used to assess column water vapour (Halthore
25
ACPD
14, 31515–31550, 2014A novel methodology for assessing the
DARF
E. T. Sena and P. Artaxo
Title Page
Abstract Introduction
Conclusions References
Tables Figures
◭ ◮
◭ ◮
Back Close
Full Screen / Esc
Printer-friendly Version Interactive Discussion
Discussion
P
a
per
|
Discussion
P
a
per
|
Discussion
P
a
per
|
Discussion
P
a
per
|
surface models used in GAME are based on mean column averaged aerosol optical properties retrieved by AERONET’s inversion algorithm (Dubovik and King, 2000) and surface properties retrieved by MODIS bidirectional reflectance product (Lucht et al., 2000; Schaaf et al., 2002), respectively.
The CERES-MODIS DARF, calculated according to the methodology described in
5
Sect. 2.1, was compared with the DARF reported by AERONET’s inversion product. For this, we selected forcing results, located within ±25 km of the AERONET sites that were operating in the Amazonia during the studied period (Abracos Hill, Alta Flo-resta, Balbina, Belterra, Cuiabá, Ji-Paraná and Rio Branco). AERONET sunphotome-ters, only perform the almulcantar measurements, needed to calculate the radiative
10
forcing when the solar zenith angle is larger than 50◦. However, during the dry season, at the time Terra overpasses the studied region (around 10:30 LT), the solar zenith an-gle is on average around 33◦. For this reason, there were no coincident instantaneous DARF retrievals from CERES-MODIS radiometers and AERONET sunphotometers. To compare the results, the instantaneous DARF, obtained by both CERES-MODIS and
15
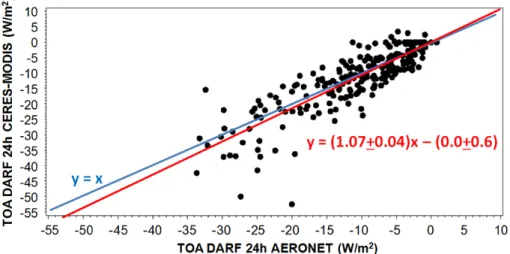
AERONET, were expanded to 24 h average DARF using the methodology described in Sena et al., 2013. A comparison between the 24h-DARF at the TOA obtained using AERONET and CERES-MODIS is shown in Fig. 7.
By applying a linear fit to the data points of Fig. 7, we see that the 24h-DARF derived from CERES-MODIS relates with the 24h-DARF reported by AERONET through the
20
following equation:
DARF24 hCERES-MODIS=(1.07±0.04)DARF24 hAERONET−(0.0±0.6). (5)
According to this equation, the slope of the regression is compatible with 1 within 2 un-certainties and the intercept is zero. This is a remarkable result, since the 24h-DARF retrievals, showed in Fig. 7, were obtained by applying completely different
method-25
ACPD
14, 31515–31550, 2014A novel methodology for assessing the
DARF
E. T. Sena and P. Artaxo
Title Page
Abstract Introduction
Conclusions References
Tables Figures
◭ ◮
◭ ◮
Back Close
Full Screen / Esc
Printer-friendly Version Interactive Discussion
Discussion
P
a
per
|
Discussion
P
a
per
|
Discussion
P
a
per
|
Discussion
P
a
per
|
that were used to calculate the 24h-DARF, compared in our analysis, were performed at different hours of the day. All those differences contribute to the dispersion of about 5 W m−2around the adjusted line. The uncertainties involved in the surface and aerosol optical models used in GAME’s radiative transfer code to calculate the DARF reported by AERONET can also contribute somewhat to this dispersion. These results indicate
5
a high agreement between the 24h-DARF obtained by these two independent proce-dures.
4.2 Intercomparison between CERES-MODIS and SBDART instantaneous DARF
It is important to intercompare satellite remote sensing retrievals with ground based measurements. In order to properly do that it was compared CERES-MODIS
determi-10
nations at the TOA with SolRad-NET (Solar Radiation Network) pyranometers at the bottom of the atmosphere (BOA), using SBDART calculations to link BOA to TOA. To formulate the surface models used in SBDART, we selected 50 km×50 km areas cen-tred at the AERONET stations, listed in Sect. 4.1. For each selected area, the spectral surface albedo was obtained from the linear interpolation of MODIS MCD43B1 surface
15
albedo retrievals in 7 wavelengths (Lucht et al., 2000; Schaaf et al., 2002). Daily aver-ages of aerosol optical properties retrieved by AERONET inversion product were used to define the aerosol models used in these simulations. The aerosol optical depth and column water vapour measured by AERONET sunphotometers within±1/2 h of Terra’s timepass over each site were also used as inputs in the radiative transfer code. The
20
shortwave downward flux at the surface and the DARF at the TOA were computed with SBDART and compared with ground-based sensors solar flux measurements and with CERES-MODIS DARF, respectively.
Figure 8 shows the comparison between the downward flux at the surface (F↓BOA)
calculated by SBDART between 0.3 and 2.8 µm and coincident solar flux
measure-25
ACPD
14, 31515–31550, 2014A novel methodology for assessing the
DARF
E. T. Sena and P. Artaxo
Title Page
Abstract Introduction
Conclusions References
Tables Figures
◭ ◮
◭ ◮
Back Close
Full Screen / Esc
Printer-friendly Version Interactive Discussion
Discussion
P
a
per
|
Discussion
P
a
per
|
Discussion
P
a
per
|
Discussion
P
a
per
|
(FBOASBDART) indicate that these variables are related through the following equation:
FBOAPYRANOMETER=(1.00±0.04)FBOASBDART−(20±27). (6) According to the adjusted parameters of this fit and their uncertainties, the slope and intercept of the linear fit (Eq. 6) are compatible with 1 and 0, respectively, within one uncertainty. The apparent mismatch of about 20 W m−2 between the calculated and
5
measured values represents approximately 2.2 % of the downward flux at the surface, and this is close to the instrumental uncertainty of the pyranometer, reported as 2 %. These results show a good agreement between the downward irradiance at the surface, calculated using SBDART and SolRad-NET pyranometers measurements.
The intercomparison between the instantaneous TOA DARF obtained using
CERES-10
MODIS and calculated using SBDART is shown in Fig. 9. The data points in this graph have a dispersion of about 10 W m−2around the 1 : 1 line. A linear fit of the data plotted in Fig. 9 shows that the instantaneous TOA DARF obtained from CERES-MODIS and from SBDART relate through the following equation:
DARFCERES-MODIS=(0.86±0.06)DARFSBDART−(6±2), (7)
15
indicating that the curve obtained by linear regression of the points is close toy =xline for the range of values analysed.
Several issues in this comparison must be taken into account. First the upward flux is strongly influenced by the surface reflection. MODIS sensor presents low spectral resolution in the shortwave spectrum and this limits the surface albedo model used as
20
input in SBDART. Secondly, the atmosphere has to be taken into account twice: on the downward and upward path. This amplifies any inaccuracy in the optical properties assumed in the SBDART calculations.
Small deviations in the estimates of aerosol single scattering albedo can generate large differences in the forcing calculated by radiative transfer codes (Loeb and Su,
25
ACPD
14, 31515–31550, 2014A novel methodology for assessing the
DARF
E. T. Sena and P. Artaxo
Title Page
Abstract Introduction
Conclusions References
Tables Figures
◭ ◮
◭ ◮
Back Close
Full Screen / Esc
Printer-friendly Version Interactive Discussion
Discussion
P
a
per
|
Discussion
P
a
per
|
Discussion
P
a
per
|
Discussion
P
a
per
|
different single scattering albedo values, the 24h-DARF was computed in SBDART as a function of AOD at 550 nm for different values of single scattering albedo at 440 nm (ω0=0.89, 0.92 and 0.95) (Fig. 10). The differences of ±0.03 for ω0, used in these
simulations, correspond to the uncertainty of the single scattering albedo inverted by the AERONET algorithms. According to Fig. 10, a variability of 0.03 in the estimate of
5
the single scattering albedo can generate a difference in the computed 24h-DARF of about 5 to 6 W m−2 when AOD=1 and 12 to 14 W m−2 when AOD=5. These values are very significant, and shows that the critical parameter in assessing the correct DARF is actually the aerosol single scattering albedo.
Considering all potential sources of uncertainties on the aerosol and surface albedo
10
models used in SBDART simulations on computing DARF, it is possible to consider the validation showed on Fig. 9 as satisfactory. It is important to note that this validation consist of an indirect comparison, since, as previously discussed, it is not possible to obtain the flux at the TOA by direct methods.
5 Summary and conclusions
15
This work proposed a new methodology for assessing the direct radiative forcing of biomass burning aerosols in large scale over the Amazonia using satellite remote sens-ing. Ten years of simultaneous CERES and MODIS retrievals, from 2000 to 2009, were used in this evaluation. An important correction (Patadia and Christopher, 2014) was applied to the DARF, to account for the anisotropic scattering of smoke aerosols.
20
The spatial and temporal distributions of the mean daily DARF were analysed. Those analysis showed that due to the wind dynamics and fast transport of particles along the Amazon Basin, the spatial distribution of the DARF may considerably change even during short periods of time. The DARF varies strongly along the biomass burning sea-son, showing up to 20 W m−2daily variation. The intraseasonal behaviour of the DARF
25
ACPD
14, 31515–31550, 2014A novel methodology for assessing the
DARF
E. T. Sena and P. Artaxo
Title Page
Abstract Introduction
Conclusions References
Tables Figures
◭ ◮
◭ ◮
Back Close
Full Screen / Esc
Printer-friendly Version Interactive Discussion
Discussion
P
a
per
|
Discussion
P
a
per
|
Discussion
P
a
per
|
Discussion
P
a
per
|
with different climatic conditions and other socioeconomical changes (Davidson et al., 2012).
The average of DARF during the biomass burning season were computed and pared with DARF results obtained in a previous study (Sena et al., 2013). This com-parison showed a mean difference of about 3 W m−2 on the DARF, depending on the
5
methodology applied. This difference was mainly caused by two factors: (i) the diff er-ence in the referer-ence used to represent the clean scene in these two methodologies, and (ii) the fact that, before 2005, CERES-SSF product contains properties of aerosols from an older MODIS collection (collection 4), which overestimates the forcing com-puted for those years when the previous methodology in applied.
10
An important part of our efforts focused on linking satellite remote sensing with ground based aerosol and radiation flux measurements. The intercomparison between DARF results assessed using the new methodology proposed in this work, AERONET and SBDART were very satisfactory. This validation also indicates the importance of taking into account the angular distribution model corrections proposed by Patadia and
15
Christopher, 2014, and used in the present study. To our knowledge, this was the first time satellite remote sensing assessments of the DARF were compared with ground based DARF estimates.
The new methodology introduced in this work assesses the radiative forcing of biomass burning aerosols over the Amazonia in large scale and at higher temporal
res-20
olution than previous studies. It also shows an advantage over previous approaches for evaluating the DARF using satellite remote sensing, because it considerably decreases the statistical noise in the estimates of the DARF, resulting in higher correlation be-tween DARF and AOD, compared to previous assessments. This new methodology could also be applied to assess the DARF in other places of the world under urban or
25
biomass burning aerosol influences, if suitable and robust aerosol optical parameters are available.
Acknowledgements. The authors would like to thank the Atmospheric Science Data Center
ACPD
14, 31515–31550, 2014A novel methodology for assessing the
DARF
E. T. Sena and P. Artaxo
Title Page
Abstract Introduction
Conclusions References
Tables Figures
◭ ◮
◭ ◮
Back Close
Full Screen / Esc
Printer-friendly Version Interactive Discussion
Discussion
P
a
per
|
Discussion
P
a
per
|
Discussion
P
a
per
|
Discussion
P
a
per
|
data. We thank Leandro Mariano and Otaviano Helene for the helpful discussions on uncer-tainties. We also thank FAPESP scholarships associated with the projects 2009/08442-7 and 2013/08582-9. This research was funded by the FAPESP projects 2008/58100-2, 2013/05014-0 and CNPq project 457843/22013/05014-013-6 and 475735-22013/05014-012-9. We thank Alcides C. Ribeiro, Ana L. Loureiro, Fábio de Oliveira Jorge and Simara Morais for technical support. We thank
5
Brent Holben, Joel Schafer and Fernando Morais for support on long term AERONET opera-tions in Amazonia.
References
Albrecht, B. A.: Aerosols, cloud microphysics, and fractional cloudiness, Science, 245, 1227– 1230, 1989.
10
Andreae, M. O.: Aerosols before pollution, Science, 315, 50–51, 2007.
Andreae, M. O., Artaxo, P., Fischer, H., Freitas, S. R., Grégoire, J. M., Hansel, A., Hoor, P., Kormann, R., Krejci, R., Lange, L., Lelieveld, J., Lindinger, W., Longo, K., Peters, W., de Reus, M., Scheeren, B., Dias, M., Strom, J., van Velthoven, P. F. J., and Williams, J.: Transport of biomass burning smoke to the upper troposphere by deep convection in the equatorial
15
region, Geophys. Res. Lett., 28, 951–954, doi:10.1029/2000GL012391, 2001.
Andreae, M. O., Artaxo, P., Brandao, C., Carswell, F. E., Ciccioli, P., da Costa, A. L., Culf, A. D., Esteves, J. L., Gash, J. H. C., Grace, J., Kabat, P., Lelieveld, J., Malhi, Y., Manzi, A. O., Meixner, F. X., Nobre, A. D., Nobre, C., Ruivo, M., Silva-Dias, M. A., Stefani, P., Valtini, R., von Jouanne, J., and Waterloo, M. J.: Biogeochemical cycling of carbon, water,
en-20
ergy, trace gases, and aerosols in Amazonia: the LBA-EUSTACH experiments, J. Geophys. Res.-Atmos., 107, 8066, doi:10.1029/2001JD000524, 2002.
Andreae, M. O., Rosenfeld, D., Artaxo, P., Costa, A. A., Frank, G. P., Longo, K. M., and Silva-Dias, M. A. F.: Smoking rain clouds over the Amazon, Science, 303, 1337–1342, 2004. Artaxo, P., Martins, J. V., Yamasoe, M. A., Procopio, A. S., Pauliquevis, T. M., Andreae, M. O.,
25
Guyon, P., Gatti, L. V., and Leal, A. M. C.: Physical and chemical properties of aerosols in the wet and dry seasons in Rondonia, Amazonia, J. Geophys. Res.-Atmos., 107, LBA 49-1–LBA 49-14, doi:10.1029/2001JD000666, 2002.
Artaxo, P., Rizzo, L. V., Paixao, M., de Lucca, S., Oliveira, P. H., Lara, L. L., Wiedemann, K. T., Andreae, M. O., Holben, B., Schafer, J., Correia, A. L., and Pauliquevis, T. M.: Aerosol
ACPD
14, 31515–31550, 2014A novel methodology for assessing the
DARF
E. T. Sena and P. Artaxo
Title Page
Abstract Introduction
Conclusions References
Tables Figures
◭ ◮
◭ ◮
Back Close
Full Screen / Esc
Printer-friendly Version Interactive Discussion
Discussion
P
a
per
|
Discussion
P
a
per
|
Discussion
P
a
per
|
Discussion
P
a
per
|
ticles in Amazonia: their composition, role in the radiation balance, cloud formation, and nutrient cycles, Geoph. Monog. Series, 186, 233–250, doi:10.1029/2008GM000778, 2009. Artaxo, P., Rizzo, L. V., Brito, J. F., Barbosa, H. M. J., Arana, A., Sena, E. T., Cirino, G. G.,
Bastos, W., Martin, S. T., and Andreae, M. O.: Atmospheric aerosols in Amazonia and land use change: from natural biogenic to biomass burning conditions, Faraday Discuss., 165,
5
203–235, doi:10.1039/C3FD00052D, 2013.
Betts, R. A., Malhi, Y., and Roberts, J. T.: The future of the Amazon: new perspectives from climate, ecosystem and social sciences, Philos. T. R. Soc. B, 363, 1729–1735, 2008. Boucher, O., Randall, D., Artaxo, P., Bretherton, C., Feingold, G., Forster, P., Kerminen, V.-M.,
Kondo, Y., Liao, H., Lohmann, U., Rasch, P., Satheesh, S. K., Sherwood, S., Stevens, B.,
10
and Zhang, X. Y.: Clouds and aerosols, in: Climate Change 2013: The Physical Science Basis. Contribution of Working Group I to the Fifth Assessment Report of the Intergovern-mental Panel on Climate Change, edited by: Stocker, T. F., Qin, D., Plattner, G.-K., Tignor, M., Allen, S. K., Boschung, J., Nauels, A., Xia, Y., Bex, V., and Midgley, P. M., Cambridge Univer-sity Press, Cambridge, UK, New York, NY, USA, 571–657, 2013.
15
Bowman, D. M. J. S., Balch, J. K., Artaxo, P., Bond, W. J., Carlson, J. M., Cochrane, M. A, D’Antonio, C. M., Defries, R. S., Doyle, J. C., Harrison, S. P., Johnston, F. H., Keeley, J. E., Krawchuk, M. A., Kull, C. A., Marston, J. B., Moritz, M. A., Prentice, I. C., Roos, C. I., Scott, A. C., Swetnam, T. W., van der Werf, G. R., and Pyne, S. J.: Fire in the Earth sys-tem, Science, 324, 481–484, doi:10.1126/science.1163886, 2009.
20
Charlson, R. J., Schwartz, S. E., Hales, J. M., Cess, R. D., Coakley, J. J., Hansen, J. E., and Hofmann, D. J.: Climate forcing by anthropogenic aerosols, Science, 255, 423–430, 1992. Christopher, S. A.: Satellite remote sensing methods for estimating clear sky shortwave top of
atmosphere fluxes used for aerosol studies over the global oceans, Remote Sens. Environ., 115, 3002–3006, 2011.
25
Chylek, P. and Wong, J.: Effect of absorbing aerosols on global radiation budget, Geophys. Res. Lett., 22, 929–931, 1995.
Coakley, J. A., Bernstein, R. L., and Durkee, P. A.: Effect of ship-stack effluents on cloud reflec-tivity, Science, 237, 1020–1022, 1987.
Davidson, E. A. and Artaxo, P.: Globally significant changes in biological processes of the
30
ACPD
14, 31515–31550, 2014A novel methodology for assessing the
DARF
E. T. Sena and P. Artaxo
Title Page
Abstract Introduction
Conclusions References
Tables Figures
◭ ◮
◭ ◮
Back Close
Full Screen / Esc
Printer-friendly Version Interactive Discussion
Discussion
P
a
per
|
Discussion
P
a
per
|
Discussion
P
a
per
|
Discussion
P
a
per
|
Davidson, E. A., Araújo A. C., Artaxo, P., Balch, J. K., Brown, I. F., Bustamante, M. M. C., Coe, M. T., DeFries R. S., Keller M., Longo M., Munger J. W., Schroeder W., Soarez-Filho B. S., Souza C. M., and Wofsy S. C.: The Amazon Basin in transition, Nature, 481, 321–328, doi:10.1038/nature10717, 2012.
Dubovik, O. and King, M. D.: A flexible inversion algorithm for retrieval of aerosol optical
prop-5
erties from Sun and sky radiance measurements, J. Geophys. Res., 105, 20673–20696, doi:10.1029/2000JD900282, 2000.
Dubovik, O., Holben, B., Eck, T., Smirnov, A., Kaufman, Y., King, M., Tanré D., and Slutsker, I.: Variability of absorption and optical properties of key aerosol types observed in worldwide locations, J. Atmos. Sci., 59, 590–608, 2002.
10
Dubuisson, P., Buriez. J. C., and Fouquart, Y.: High spectral resolution solar radiative transfer in absorbing and scattering media: application to the satellite simulation, J. Quant. Spectrosc. Ra., 55, 103–126, 1996.
Echalar, F., Artaxo, P., Martins, J. V., Yamasoe, M., Gerab, F., Maenhaut, W., and Holben, B.: Long-term monitoring of atmospheric aerosols in the amazon basin: source identification and
15
apportionment, J. Geophys. Res., 103, 31849–31864, 1998.
Eck, T. F., Holben, B. N., Reid, J. S., O’Neill, N. T., Schafer, J. S., Dubovik, O., Smirnov, A., Yamasoe, M. A., and Artaxo, P.: High aerosol optical depth biomass burning events: a com-parison of optical properties for different source regions, Geophys. Res. Lett., 30, 2035, doi:10.1029/2003GL017861, 2003.
20
Edwards, D. P., Emmons, L. K., Gille, J. C., Chu, A., Attié, J. L., Giglio, L., Wood, S. W., Hay-wood, J., Deeter, M. N., Massie, S. T., Ziskin, D. C., and Drummond, J. R.: Satellite ob-served pollution from Southern Hemisphere biomass burning, J. Geophys. Res.-Atmos., 111, D14312, doi:10.1029/2005JD006655, 2006.
Feng, N. and Christopher, S. A.: Clear sky direct radiative effects of aerosols over Southeast
25
Asia based on satellite observations and radiative transfer calculations, Remote Sens. Envi-ron., 152, 333–344, 2014.
Freitas, S. R., Longo, K. M., Silva Dias, M. A. F., Silva Dias, P. L., Chatfield, R., Prins, E., Artaxo, P., and Recuero, F. S.: Monitoring the transport of biomass burning emissions in South America, Environ. Fluid Mech., 5, 135–167, doi:10.1007/s10652-005-0243-7, 2005.
30
ACPD
14, 31515–31550, 2014A novel methodology for assessing the
DARF
E. T. Sena and P. Artaxo
Title Page
Abstract Introduction
Conclusions References
Tables Figures
◭ ◮
◭ ◮
Back Close
Full Screen / Esc
Printer-friendly Version Interactive Discussion
Discussion
P
a
per
|
Discussion
P
a
per
|
Discussion
P
a
per
|
Discussion
P
a
per
|
Haywood, J. and Boucher, O.: Estimates of the direct and indirect radiative forcing due to tropo-spheric aerosols: a review, Rev. Geophys., 38, 513–543, doi:10.1029/1999RG000078, 2000. Holben, B. N., Setzer, A., Eck, T. F., Pereira, A., and Slutsker, I.: Effect of dry-season biomass
burning on Amazon basin aerosol concentrations and optical properties, 1992–1994, J. Geo-phys. Res.-Atmos., 101, 19465–19481, doi:10.1029/96jd01114, 1996.
5
Holben, B. N., Eck, T. F., Slutsker, I., Tanre, D., Buis, J. P., Setzer, A., Vermote, E., Reagan, J. A., Kaufman, Y. J., Nakajima, T., Lavenu, F., Jankowiak, I., and Smirnov, A.: AERONET – a fed-erated instrument network and data archive for aerosol characterization, Remote Sens. En-viron., 66, 1–16, doi:10.1016/S0034-4257(98)00031-5, 1998.
King, M. D., Kaufman, Y. J., Menzel, W., and Tanre, D.: Remote sensing of cloud, aerosol, and
10
water vapor properties from the Moderate Resolution Imaging Spectrometer (MODIS), IEEE T. Geosci. Remote, 30, 2–27, 1992.
Koren, I., Martins, J. V., Remer, L. A., and Afargan, H.: Smoke invigoration versus inhibition of clouds over the Amazon, Science, 321, 946–949, 2008.
Liou, K. N.: An Introduction to Atmospheric Radiation, Vol. 84, Academic Press, San Diego,
15
California, 2002.
Loeb, N. G. and Su, W.: Direct aerosol radiative forcing uncertainty based on a radiative per-turbation analysis, J. Climate, 23, 5288–5293, 2010.
Loeb, N. G., Kato, S., Loukachine, K., and Manalo-Smith, N.: Angular distribution models for top-of-atmosphere radiative flux estimation from the Clouds and the Earth’s Radiant Energy
20
System instrument on the Terra satellite. Part I: Methodology, J. Atmos. Ocean. Tech., 22, 338–351, doi:10.1175/JTECH1712.1, 2005.
Loeb, N. G., Kato, S., Loukachine, K., Manalo-Smith, N., and Doelling, D. R.: Angular distribu-tion models for top-of-atmosphere radiative flux estimadistribu-tion from the Clouds and the Earth’s Radiant Energy System instrument on the Terra satellite. Part II: Validation, J. Atmos. Ocean.
25
Tech., 24, 564–584, doi:10.1175/JTECH1983.1, 2007.
Longo, K., de Freitas, S. R., Andreae, M. O., Yokelson, R., and Artaxo, P.: Biomass burning in Amazonia: emissions, long-range transport of smoke and its regional and remote im-pacts, in: Amazonia and Global Change, edited by: Keller, M., Bustamante, M., Gash, J., and Dias, P. S., American Geophysical Union, Washington, D. C., Geophysical Monograph
30
ACPD
14, 31515–31550, 2014A novel methodology for assessing the
DARF
E. T. Sena and P. Artaxo
Title Page
Abstract Introduction
Conclusions References
Tables Figures
◭ ◮
◭ ◮
Back Close
Full Screen / Esc
Printer-friendly Version Interactive Discussion
Discussion
P
a
per
|
Discussion
P
a
per
|
Discussion
P
a
per
|
Discussion
P
a
per
|
Lucht, W., Schaaf, C. B., and Strahler, A. H.: An algorithm for the retrieval of albedo from space using semiempirical BRDF models, IEEE T. Geosci. Remote, 38, 977–998, doi:10.1109/36.841980, 2000.
Martin, S. T., Andreae, M. O., Artaxo, P., Baumgardner, D., Chen, Q., Goldstein, A. H., Guen-ther, A. B., Heald, C. L., Mayol-Bracero, O. L., McMurry, P. H., Pauliquevis, T., Pöschl, U.,
5
Prather K. A., Roberts G. C., Saleska S. R., Silva Dias M. A., Spracklen D. V., Swietlicki E., and Trebs I.: Sources and properties of amazonian aerosol particles, Rev. Geophys., 48, RG2002, doi:10.1029/2008RG000280, 2010.
Patadia, F. and Christopher, S. A.: Assessment of smoke shortwave radiative forcing using empirical angular distribution models, Remote Sens. Environ., 140, 233–240, 2014.
10
Patadia, F., Gupta, P., Christopher, S. A., and Reid, J. S.: A Multisensor satellite-based assess-ment of biomass burning aerosol radiative impact over Amazonia, J. Geophys. Res, 113, D12214, doi:10.1029/2007JD009486, 2008.
Patadia, F., Christopher, S. A., and Zhang, J.: Development of empirical angular distribution models for smoke aerosols: methods, J. Geophys. Res.-Atmos., 116, 1984–2012, 2011.
15
Prins, E. M., Feltz, J. M., Menzel, W. P., and Ward, D. E.: An overview of goes-8 diurnal fire and smoke results for scar-b and 1995 fire season in South America, J. Geophys. Res.-Atmos., 103, 31821–31835, 1998.
Procopio, A., Artaxo, P., Kaufman, Y., Remer, L., Schafer, J., and Holben, B.: Multiyear analysis of Amazonian biomass burning smoke radiative forcing of climate, Geophys. Res. Lett., 31,
20
L03108–L03112, doi:10.1029/2003GL018646, 2004.
Remer, L. A., Kaufman, Y., Tanré, D., Mattoo, S., Chu, D. A., Martins, J. V., Li, R., Ichoku, C., Levy, R., Kleidman, R., Eck, T. F., Vermote, E., and Holben, B. N.: The MODIS aerosol algorithm, products and validation, J. Atmos. Sci., 62, 947–973, 2005.
Ricchiazzi, P., Yang, S., Gautier, C., and Sowle, D.: SBDART: a research and teaching software
25
tool for plane-parallel radiative transfer in the Earth’s atmosphere, B. Am. Meteorol. Soc., 79, 2101–2114, 1998.
Ross, J., Hobbs, P., and Holben, B.: Radiative characteristics of regional hazes dominated by smoke from biomass burning in Brazil: closure tests and direct radiative forcing, J. Geophys. Res., 103, 31,925–31, 1998.
30
ACPD
14, 31515–31550, 2014A novel methodology for assessing the
DARF
E. T. Sena and P. Artaxo
Title Page
Abstract Introduction
Conclusions References
Tables Figures
◭ ◮
◭ ◮
Back Close
Full Screen / Esc
Printer-friendly Version Interactive Discussion
Discussion
P
a
per
|
Discussion
P
a
per
|
Discussion
P
a
per
|
Discussion
P
a
per
|
Schaaf, C. B., Gao, F., Strahler, A. H., Lucht, W., Li, X., Tsang, T., Strugnell, N. C., Zhang, X., Jin, Y., Muller, J.-P., Lewis, P., Barnsley, M., Hobson, P., Disney, M., Dunderdale, M., Doll, C., d’Entremont, R. P., Hu, B., Liang, S., Privette, J. L., and Roy, D.: First operational BRDF, albedo nadir reflectance products from MODIS, Remote Sens. Environ., 83, 135–148, doi:10.1016/S0034-4257(02)00091-3, 2002.
5
Schafer, J. S., Eck, T. F., Holben, B. N., Artaxo, P., and Duarte, A.: Characteriza-tion of the optical properties of atmospheric aerosols in Amazonia from long term AERONET monitoring (1993–1995; 1999–2006), J. Geophys. Res.-Atmos., 113, D04204, doi:10.1029/2007JD009319, 2008.
Sena, E. T., Artaxo, P., and Correia, A. L.: Spatial variability of the direct radiative forcing of
10
biomass burning aerosols and the effects of land use change in Amazonia, Atmos. Chem. Phys., 13, 1261–1275, doi:10.5194/acp-13-1261-2013, 2013.
Smith, G. L.: Effects of time response on the point spread function of a scanning radiometer, Appl. Optics, 33, 7031–7037, 1994.
Stamnes, K., Tsay, S., Wiscombe, W., and Jayaweera, K.: Numerically stable algorithm for
15
discrete–ordinate-method radiative transfer in multiple scattering and emitting layered media, Appl. Optics, 27, 2502–2509, 1988.
Sundström, A.-M., Arola, A., Kolmonen, P., Xue, Y., de Leeuw, G., and Kulmala, M.: On the use of satellite remote sensing based approach for determining aerosol direct radiative ef-fect over land: a case study over China, Atmos. Chem. Phys. Discuss., 14, 15113–15147,
20
doi:10.5194/acpd-14-15113-2014, 2014.
Twomey, S.: The influence of pollution on the shortwave albedo of clouds, J. Atmos. Sci., 34, 1149–1152, 1977.
Wielicki, B. A., Barkstrom, B. R., Harrison, E. F., Lee, R. B., Smith, G. L., and Cooper, J. E.: Clouds and the Earth’s Radiant Energy System (CERES): an Earth observing system
exper-25
iment, B. Am. Meteorol. Soc., 77, 853–868, 1996.
Yu, H., Kaufman, Y. J., Chin, M., Feingold, G., Remer, L. A., Anderson, T. L., Balkanski, Y., Bel-louin, N., Boucher, O., Christopher, S., DeCola, P., Kahn, R., Koch, D., Loeb, N., Reddy, M. S., Schulz, M., Takemura, T., and Zhou, M.: A review of measurement-based assessments of the aerosol direct radiative effect and forcing, Atmos. Chem. Phys., 6, 613–666,
doi:10.5194/acp-30
ACPD
14, 31515–31550, 2014A novel methodology for assessing the
DARF
E. T. Sena and P. Artaxo
Title Page
Abstract Introduction
Conclusions References
Tables Figures
◭ ◮
◭ ◮
Back Close
Full Screen / Esc
Printer-friendly Version Interactive Discussion
Discussion
P
a
per
|
Discussion
P
a
per
|
Discussion
P
a
per
|
Discussion
P
a
per
|