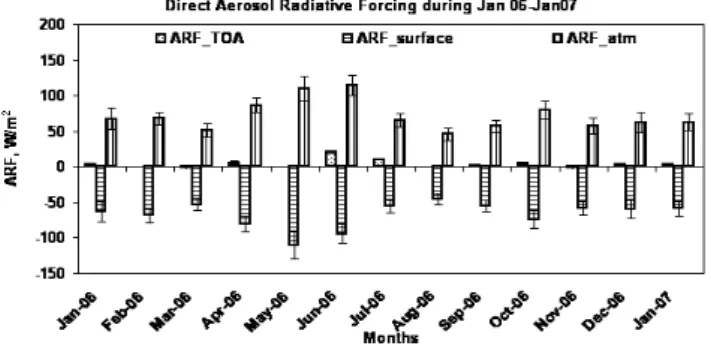
Clear-sky direct aerosol radiative forcing variations over mega-city Delhi
Texto
Imagem
Documentos relacionados
Relationship between aerosol number concentration and cloud droplet number concen- tration (CDNC) with (a) showing that the volcanically induced cloud albedo e ff ect is larger
To calculate radiative forcing and quantify the impact of varying sources of uncertainty, we need data including aerosol amount (e.g. optical depth) in both the present day and
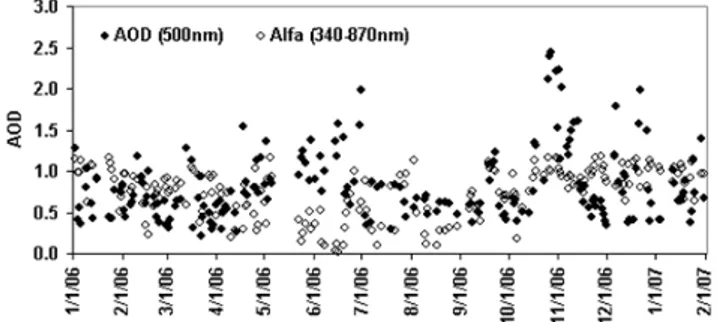
Here we assess the aerosol optical depth ( τ ), direct radiative effect (DRE) by natural and anthropogenic aerosols, and direct climate forcing (DCF) by anthropogenic aerosols,
The model has been used to study the impact of aerosol direct radiative e ff ect on East Asian climate (Zhang et al., 2012a), direct radiative forcing of anthropogenic aerosols (Bond
As a first step, the total e ff ects of clouds on aerosol radiative forcing is quantified through the di ff erence of all-sky minus clear-sky radiative forcings, shown for the
We analyze aerosol optical depth (sulfate, BC, and OC), aerosol climate forcing (direct and indirect), and climate response (temperature, precipitation rate, liq- uid water path, and
(a) MODIS mean aerosol optical depth at 550 nm over Amazonia during the dry season (b) and mean direct aerosol radiative forcing of aerosols (DARF24h) during the peak of the
During airborne in situ measurements of particle size distributions in a forest fire plume originating in North- ern Canada, an accumulation mode number mean diameter of 0.34 µ m
