ISSN 1549-3652
© 2007 Science Publications
Corresponding Author: Mohammed Issa Shahateet, Princess Sumaya University for Technology, P. O. Box 1438, Al-Jubaiha, Amman 11941, Jordan
The Determinants of Deprivation in Jordan: Empirical Study
Mohammed Issa Shahateet
Princess Sumaya University for Technology, P. O. Box 1438, Al-Jubaiha, Amman 11941, Jordan
Abstract: The objective of this study was to determine and explain the factors that affect deprivation in Jordan. To do so, this study constructs and tests a model that determines the factors, which affect deprivation. It employs an econometric analysis to examine the relationship between some main socioeconomic variables and the status of deprivation in Jordan. It looks at how changes in income, unemployment, education, health, housing conditions and access to services, as well as pollution, will affect the status of deprivation. The study uses the raw data of the national Household Income and Expenditure Survey HIES, which was conducted by the Jordanian Department of Statistics during 2002/2003 and covered 12,792 households. The study concludes that deprivation was caused by low income, unemployment, low educational attainment, bad type of housing, barriers to essential services, poor health and pollution. However, the effect of these factors varies. Simulation results of the model predicts that if income deprivation, unemployment and education deprivation are reduced by 1% the overall deprivation index will decrease by 0.7%, holding other variables without change. Realizing such reductions, however, will require policies to further increase wages and salaries, encourage investment in human capital and job creation.
Key words: deprivation, income, unemployment, education, poverty, simulation INTRODUCTION
There has been an increasing interest in studying deprivation as an alternative to poverty which is an abstract measure, commonly expressed by monetary terms. Unlike poverty, deprivation is a more complex term that combines monetary and non-monetary indicators to define the deprived into more detailed aspects or domains such as deprivation of income, deprivation of education, deprivation of health and so forth. As such, deprivation measures can be used as an effective measure to justify or evaluate economic policies directed to help the poor getting out of their despair and misery.
Though ‘poverty’ and ‘deprivation’ have often been used interchangeably, many have argued that a clear distinction should be made between them. The condition of poverty means not having enough financial resources to meet needs. Deprivation on the other hand refers to unmet need, which is caused by a lack of resources of all kinds, not just financial. The terms ‘poverty’ and ‘social exclusion’ have also been used on occasions interchangeably. Townsend 1987 argues that ‘people can be said to be deprived if they lack the types of diet, clothing, housing, household facilities and fuel and environmental, educational, working and social conditions, activities and facilities which are customary…’ People are in poverty if they lack the resources to escape deprivation.[1] Townsend elaborates distinctions between social and material deprivation. The former – which he acknowledges is
more difficult to measure – he describes as ‘providing a useful means of generalising the condition of those who do not or cannot enter into ordinary forms of family or
other relationships’. The more easily measured material deprivation relates to diet, health, clothing, housing, household facilities, environment and work. By identifying both social and material deprivation, he is anticipating some aspects of what one might now call ‘social exclusion’. In this study Townsend also lays down the foundation for articulating multiple deprivations as an accumulation of several types of deprivation.[2] Though Townsend’s work mainly though not entirely referred to individuals experiencing deprivation – single or multiple – the arguments can, in modified form, extend to area based measures. However, limitations of data availability inevitably cause some of the sophistication of his original concept to be lost in practice. Moreover, it could be argued that measures of consumption are themselves problematic as lack of certain items may be by choice rather than inability to pay for them.[3] More recent studies have moved away from measuring and analysing poverty to measuring deprivation.[4]
In Jordan, poverty and deprivation remain the daily experience of many citizens. Large numbers of the disadvantaged live in rural areas, yet most research attention has been focused on poverty as expressed only in monetary terms. Recent macroeconomic studies that addressed poverty in Jordan are few.[5-12] In addition, there is only one study that focused on measuring the level of deprivation but not on the factors that determine deprivation.[13]
MATERIALS AND METHODS
examines the raw data provided by the Household Income and Expenditure Survey HIES of 2002/2003 to measure the effect of seven variables on deprivation. The dependent variable is a specifically created composite measure of deprivation using household survey data from Jordan. All independent variables are also indicators, expressed in percentages, which are composed of a number of indicators. Measuring different aspects of deprivation and combining these into an overall multiple deprivation measure raises a number of questions. Perhaps the most important one is which indicators should compose a certain deprivation domain. In fact, there is no easy answer for such question except consulting previous studies. Following deprivation studies in England[14-22], Wales[23], Scotland[24], Ireland[25-26],South Africa[27], India[28] and New Zeeland[14], this study applies seven domains and 26 indicators. Each domain is a weighted average of certain simple rates. These rates represent the proportion of deprived households members to total households members. In other words, domains are derived by combining deprivation indicators. For each governorate, a certain domain say income domain is computed as a weighted average of simple rates of deprived households to total households, as follows:
Di =
ik ik l
k i
TH
DH
l
W
∑
=1
1
; i = 1, 2, …, 12.
Where D represents any domain such as income domain, Wi is the weight of governorate i which is the
total number of households in that governorate divided by the total number of households in Jordan, DH is the number of deprived households, TH is the total number of households, and l is the number of indicators. For some domains such as education and health domains, as seen in Appendix 1, the domain is computed as the weighted average of simple rates of deprived individuals to total number of individuals at the same age. Obviously,12 1
1
=
∑
= i
i
W .
At the first phase, the model tests the effect of each independent variable on the overall deprivation index applying the ordinary least squares, OLS, method on a simple linear model. This is done to see which variables can affect deprivation more than others. Statistics such as the determination coefficient R2, the computed t
values, and the level of significance of β are obtained as
a prima-facie result aiming at selecting independent
variables. These results are shown in Table 2.
The second phase involves a multiple linear regression model. The method of estimation applied is the Stepwise regression method assuming a probability-of-F-to-enter ≤ 0.050 and a probability-of-F-to-remove ≥ 0.100. Regression results are presented in Table 3.
In the third phase, the effectiveness of some policy measures aimed at reducing deprivation in Jordan are assessed. The effects of these policy changes are
evaluated through a simulation model which applies a traditional simulation technique to measure the effect of a one-unit decrease in the most important socioeconomic variables on the overall deprivation. The model introduced five scenarios. The exogenous variables of the five models were decreased using the hypotheses summarized in Table 4.
Sample of the study: Empirical results and conclusions of this study are based on the raw data of the Household Income and Expenditure Survey HIES Questionnaires 1 and 5 which was conducted by Jordan's Department of Statistics. The HIES of 2002 covered a sample of 12,792 households using two-stage stratified cluster sampling technique designed to give reliable estimates of socioeconomic variables at the sub-district level.
The quality of data raised two issues. The first is related to the degree of accuracy of data collected by the Department of Statistics through a sample survey. Obviously, it would be naïve to regard all household data as being free of errors in absolute sense. Rather, they are constructs, worth knowing, and of special value when they are compared across regions. Given the large number of households, the distribution of these households, and the sampling methodology, one can safely assume that the HIES was a representative socioeconomic survey of the living standards of households in all governorates of Jordan. The second issue is concerned with the inclusion or exclusion of some socioeconomic variables. For this issue, there is no theoretically accepted set of indicators to construct deprivation indices.
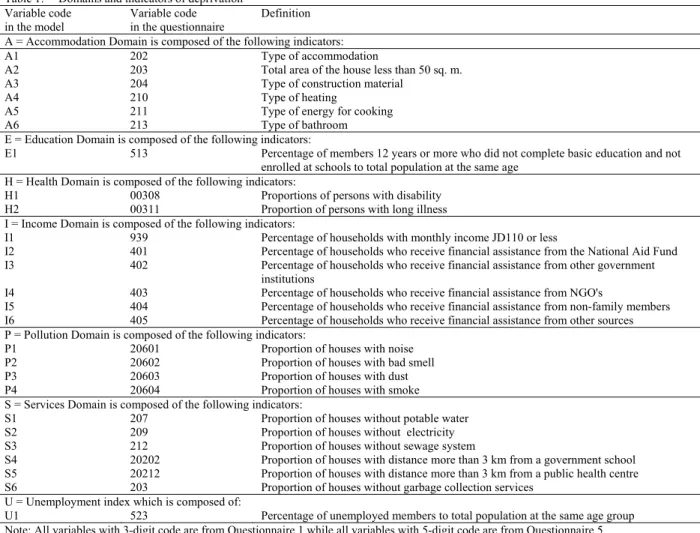
Table 1: Domains and indicators of deprivation Variable code
in the model
Variable code in the questionnaire
Definition
A = Accommodation Domain is composed of the following indicators:
A1 202 Type of accommodation
A2 203 Total area of the house less than 50 sq. m.
A3 204 Type of construction material
A4 210 Type of heating
A5 211 Type of energy for cooking
A6 213 Type of bathroom
E = Education Domain is composed of the following indicators:
E1 513 Percentage of members 12 years or more who did not complete basic education and not enrolled at schools to total population at the same age
H = Health Domain is composed of the following indicators:
H1 00308 Proportions of persons with disability
H2 00311 Proportion of persons with long illness
I = Income Domain is composed of the following indicators:
I1 939 Percentage of households with monthly income JD110 or less
I2 401 Percentage of households who receive financial assistance from the National Aid Fund I3 402 Percentage of households who receive financial assistance from other government
institutions
I4 403 Percentage of households who receive financial assistance from NGO's
I5 404 Percentage of households who receive financial assistance from non-family members I6 405 Percentage of households who receive financial assistance from other sources P = Pollution Domain is composed of the following indicators:
P1 20601 Proportion of houses with noise
P2 20602 Proportion of houses with bad smell
P3 20603 Proportion of houses with dust
P4 20604 Proportion of houses with smoke
S = Services Domain is composed of the following indicators:
S1 207 Proportion of houses without potable water
S2 209 Proportion of houses without electricity
S3 212 Proportion of houses without sewage system
S4 20202 Proportion of houses with distance more than 3 km from a government school S5 20212 Proportion of houses with distance more than 3 km from a public health centre
S6 203 Proportion of houses without garbage collection services
U = Unemployment index which is composed of:
U1 523 Percentage of unemployed members to total population at the same age group Note: All variables with 3-digit code are from Questionnaire 1 while all variables with 5-digit code are from Questionnaire 5
Table 2: Summary of the results of simple linear regression
Independent variable R2 Rank of R2 Constant β Significance Level of β
Accommodation deprivation 0.01 7 12.547
11.719
0.048 0.275
0.788
Education deprivation 0.70 2 4.921
3.309
0.320 5.038
0.000
Health deprivation and disability 0.42 5 18.431
8.317
1.275 2.815
0.017
Income deprivation 0.63 3 7.863
7.346
0.636 4.309
0.001
Pollution 0.13 6 13.246
14.831
0.097 0.275
0.234
Services deprivation 0.62 4 7.900
7.337
0.384 4.249
0.001
Unemployment 0.73 1 3.860
2.444
0.472 5.409
0.000
Notes: Dependent variable: Deprivation index D. t-values are between brackets
He adds that "it is always convenient to blame an external agency for a problem that is essentially domestic in origin."[30]
Among other factors that impact deprivation are low income, unemployment, low educational
anxiety and hostility, reduces social cohesion and increases social unrest, thereby weakening the society. There is also a concrete evidence that deprivation motivates the poor to engage in crime, riots, and other disruptive activities.[31-33]
Domains and indicators: With the existing data, deprivation is only composed of seven domains that comprise 26 indicators, as shown in Table 1. It is obvious that the analysis of more domains and indicators, disaggregated clearly, deserves further research. The model contains seven domains which relate to:
* Income derivation * Employment derivation * Education deprivation * Health deprivation and disability * Barriers to services
* Barriers to housing Accommodation * Living environment deprivation Pollution
Most deprivation indicators assume that there is a broad consensus on what types of goods and services families should be able to afford, and that an inability to afford those items implies deprivation.
On the other hand, each domain contains a number of indicators, totalling 26 overall, as shown in Table 1. As mentioned above, the criteria for determining the number of indicators in each domain are based on the availability of data and previous studies. These indicators should satisfy the following conditions: a. Domain specific, i.e., not used in more than one
domain;
b. Measuring major features of the domain and experienced by a sizable number of people or areas; c. Up-to-date;
d. Capable of being updated in future HIES's; e. Statistically robust and consistent in definition. The model: The study postulates that deprivation is determined by seven exogenous variables as below
Dij = fAij, Eij, Hij, Iij, Pij, Sij, Uij
for i = 1, 2, …, 12 and j = 1, 2, …, ni
Assuming a multiple linear relationship and omitting the subscripts i and j, for simplicity, the assumed model can be written as follows:
D = β0 + β1 A + β2 E + β3 H + β4 I + β5 P + β6 S + β7
U + ε
Where
D = Deprivation index;
A = Accommodation deprivation index;
E = Education deprivation index;
H = Health deprivation index;
I = Income deprivation index;
P = Pollution index;
S = Services deprivation index;
U = Unemployment index;
i = 1, 2, …, 12 is an index for governorates;
j = 1, 2, …, ni is an index for the number of
observations in the ith governorate;
ni = Number of observations in governorate i;
β's = Parameters to be estimated;
ε= Error term which is assumed to has mean zero and constant variance.
RESULTS
We first examine the effect of each domain on the index of multiple deprivation. The OLS regression results of Table 2 reveals that all the coefficients of the seven domains have the expected positive signs and are significant at the 5% level, except for accommodation deprivation and pollution. For this reason, these two domains are excluded from stepwise regression in the second phase. Empirical analysis also produced interesting results towards the negligible effect of health deprivation domain in determining deprivation levels, as the coefficient of determination is below 50%. The results of multiple regressions concerning the relationship between deprivation and socioeconomic variables, presented in Table 3, show that all of the coefficients are significant at the 5% level, except for services deprivation and health deprivation, as seen in Model V which includes 5 exogenous variables. In other words, there is little effect of both services deprivation and health deprivation, but this effect is insignificant at the 5% level, as seen in Models IV and V in Table 3. This result is supported by the results of Model III. The signs of all coefficients, obtained from stepwise regression have the expected signs and significant at the 5% level, indicating that any form of deprivation affects positively the overall index of deprivation. In sum, using data from a national household survey, empirical findings indicate that the most significant factor in affecting deprivation is unemployment followed by education deprivation then income deprivation, as shown in Model V in Table 3.
Judging from the estimated models, we can conclude that, among the five models in Table 3, Model III can best explain the factors affecting deprivation. Furthermore, the strong statistical results of the regression analysis give strong indication that the model is correctly specified. Since the estimates are derived from cross-section data, no test for serial correlation of residuals is needed, and naturally no lags can be introduced in the model.
Simulating the effects of deprivation reduction efforts: Having estimated the model, simulations are run to predict the changes in deprivation levels that will result from postulated changes in the main socioeconomic variables. Obviously, a large number of simulations can be introduced. However, we are interested to see the effect of one-unit change on deprivation levels.
Table 3: Summary of Stepwise regression results
Model Predictors β Standard Error t Significance level
I Constant 3.860 1.579 2.444 .033
Unemployment .472 .087 5.409 .000
II Constant 2.514 1.160 2.167 .055
Unemployment .301 .077 3.901 .003
Education .191 .053 3.576 .005
III Constant 2.690 .562 4.790 .001
Unemployment .223 .040 5.604 .000
Education .153 .027 5.739 .000
Income .303 .052 5.812 .000
IV Constant 2.737 .609 4.495 .002
Unemployment .218 .044 4.956 .001
Education .150 .029 5.184 .001
Income .291 .066 4.424 .002
Services .015 .046 0.327 .752
V Constant .730 1.835 .398 .703
Unemployment .218 .043 5.047 .001
Education .188 .043 4.363 .003
Income .271 .067 4.051 .005
Services .028 .046 .611 .561
Health .238 .205 1.157 .285
Dependent variable: Deprivation index D.
Pollution and accommodation deprivation variables are excluded from the models because the prima-facie regression results, shown in Table 2, indicate that their coefficients were statistically insignificant at the 5% significance level.
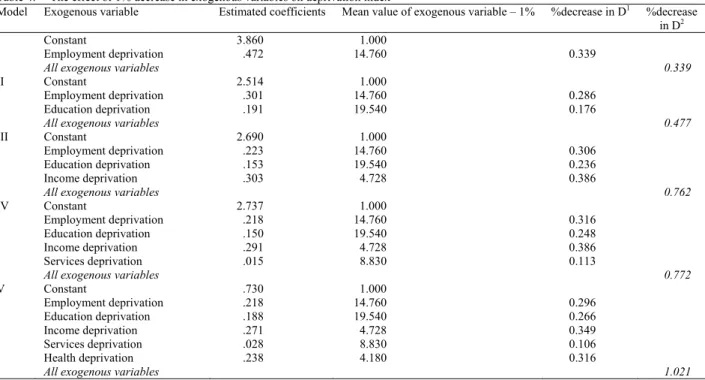
Table 4: The effect of 1% decrease in exogenous variables on deprivation index
Model Exogenous variable Estimated coefficients Mean value of exogenous variable – 1% %decrease in D1 %decrease
in D2
I Constant 3.860 1.000
Employment deprivation .472 14.760 0.339
All exogenous variables 0.339
II Constant 2.514 1.000
Employment deprivation .301 14.760 0.286
Education deprivation .191 19.540 0.176
All exogenous variables 0.477
III Constant 2.690 1.000
Employment deprivation .223 14.760 0.306
Education deprivation .153 19.540 0.236
Income deprivation .303 4.728 0.386
All exogenous variables 0.762
IV Constant 2.737 1.000
Employment deprivation .218 14.760 0.316
Education deprivation .150 19.540 0.248
Income deprivation .291 4.728 0.386
Services deprivation .015 8.830 0.113
All exogenous variables 0.772
V Constant .730 1.000
Employment deprivation .218 14.760 0.296
Education deprivation .188 19.540 0.266
Income deprivation .271 4.728 0.349
Services deprivation .028 8.830 0.106
Health deprivation .238 4.180 0.316
All exogenous variables 1.021
Note: The mean of the overall deprivation index, D, is 11.166.
1
Resulting from a 1% decrease in only one exogenous variable.
2 Resulting from a 1% decrease in all exogenous variables.
deprivation index by about 0.35% to 0.39%, as seen in Models II, IV, and V. The second important decrease in
decrease could reduce the overall deprivation by about 0.29% to 0.32%. The third important decrease in the overall deprivation may result from a 1% decrease in education deprivation. This decrease could reach 0.27%.
If each significant variable is decreased by 1%, the decrease in the overall deprivation could reach as much as 0.76%, as shown in Model III. Health and services interventions are shown to be less effective. However, the effect of 1% reduction in services and health variables, although insignificant, along with a 1% decrease in the above three significant variables could decrease the overall deprivation by 1.02%, as shown in Model V.
The importance of producing such simulations stems from allowing policy makers and planners to make a quantitative judgement of the likely effect on deprivation. Simulation results, presented in Table 4, are obtained by applying traditional static approach which is usually applied in simulation models which deal with mean-value estimations of assumed functions. At the same time, there are certainly situations when the most pessimistic or optimistic scenarios have to be considered.
CONCLUSION
This study has concentrated on analyzing and modelling the determinants of deprivation in Jordan. Empirical results, obtained from using five models, point to six main conclusions:
First, the findings lead quite clearly to the importance of decreasing income deprivation which is not coincidental. In fact, much of the Jordan's economic malaise was the result of policies that perpetrated disincentives to produce income and allocate resources efficiently.
Second, it is fair to conclude that the Jordanian economic and social policies directed towards the reduction of deprivation should concentrate on a reduction in unemployment.
Third, is a need to adopt a policy that includes reallocation of public expenditures for education rather than other services. In other words, there is a need for an active policy of investment in developing human capabilities including universal and high quality education.
Fourth, concentrating on improving health services and enhancing pollution environment will decrease deprivation but with a relatively minimal effect. Although health programmes are often advocated on humanitarian grounds, they also represent investments in human resources that have payoffs for both the recipients and society.
Fifth, reducing deprivation requires a major social transformation and real structural changes, not marginal tinkering and ad hoc reformist palliatives. Structural changes are more than mere financial and budgetary
discipline and fragmented welfare and safety nets for the poor.
Sixth, an economic policy to reduce deprivation should look at deprivation as a multidimensional approach which implies giving attention to empowerment and reducing livelihood insecurity as well as maximizing income growth, educational attainment and employment. A sustainable deprivation reduction strategy needs to search for alternative driving forces for a self-sustaining accumulation process. This is not a matter of merely giving credit to the poor on delivering fragmented services. It is a matter of embarking on a new pattern of growth with the poor saving, even at low levels of income and learning first to transform their efficiency and work into assets. Naturally, effective implementation of economic policies concerning deprivation reduction is more likely to succeed when there is regular monitoring, evaluation and revision of economic strategy.
Finally, it should be emphasized that these policies are neither easy to implement nor guaranteed to alleviate deprivation or other economic woes. They are only the framework which would maximize the opportunity to reduce deprivation.
REFERENCES
1. Townsend, P. 1987 Deprivation, Journal of Social Policy, Vol. 16, Part 2, pp. 125-146. 2. Noble, M. et al. 2004 The English Indices of
Deprivation 2004 revised, Office of the Deputy Prime Minister, HMSO, London. 3. Jordan, Ministry of Social Development 2002
Poverty Alleviation for a Stronger Jordan: A Comprehensive National Strategy, Ministry of Social Development. Amman.
4. Jordan and World Bank 2004a Jordan Poverty Assessment - Vol. 1: Executive Summary; 150 5. Amman and Washington, D.C., December. 6. Jordan and World Bank 2004b Jordan Poverty
Assessment - Vol. 2: Main Report, Amman and Washington, D.C., December.
7. Jordan, Department of Statistics 2003 Household Income and Expenditure Survey 2002/2003, Unpublished Data, Department of Statistics, Amman.
8. Nathan Associates 2004 Final Report: Jordan Poverty Alleviation Project, Phase I. Prepared for USAID/Jordan.
9. Pellekaan, J., Van Holst, W., and Seijaparova, D. 2004 Jordan: An Evaluation of World Bank Assistance for Poverty Reduction, Health and Education. A Country Assistance Evaluation, Washington D.C.: World Bank.
11. World Bank 2001 Poverty Alleviation in Jordan in the 1990s: Lessons for the Future, Executive Summary and Main Report, World Bank.
12. Abu Kharma, S., Shahateet, M. and Abu Sondus, J. 2003 Measuring Deprivation in Jordan, Unpublished Report by Jordanian Department of Statistics, Amman.
13. Bradshaw, J. 2003 Review for the Neighbourhood Renewal Unit of the Blueprint for the Index of Multiple Deprivation at small area level, www.neighbourhood.gov.uk, accessed on 17 November 2006.
14. Bramley, G. 2003 Updating the English Indices of Deprivation 2000: Proposals for the construction of the indicator ‘Difficulty of Access to Owner Occupation’, www.neighbourhood.gov.uk, accessed on 17 November 2006.
15. Bramley, G. and Evans, M. 2002 Getting the Smaller Picture: Small-Area Analysis of Public Expenditure Incidence and Deprivation in Three English Cities, Fiscal Studies, 21:2 231
16. Neighbourhood Renewal Unit 2002 Updating the Indices of Deprivation 2000: Stage 1
Consultation Report, www.neighbourhood.gov.uk, accessed on 2
November 2006.
17. Neighbourhood Renewal Unit 2003 Updating the English Indices of Deprivation 2000: Stage 2 ‘Blueprint’ Consultation Report, www.neighbourhood.gov.uk, accessed on 23 October 2005
18. Noble, M., Smith, G., Penhale B., Wright, G., Dibben, C., Owen, T. and Lloyd, M. 2000a Measuring Multiple Deprivation at the Local Level: The Indices of Deprivation 2000 DETR.
19. Noble, M., Smith, G., Penhale, B., Wright, G., Dibben, C., Owen, T. and Lloyd, M. 2000b Measuring Multiple Deprivation at the Small Area Level: The Indices of Deprivation 2000 DETR, Regeneration Research Summary, Number 37, 2000.
20. Noble, M., Wright, G., Lloyd, M., Dibben, C., Smith, G.A.N. et al. 2003 Scottish Indices of
Deprivation 2003, http://www.scotland.gov.uk/library5/social/sio
d-00.asp, accessed on 14 November 2005.
21. Robson, B., Deas, I., Bradford, M., Wong, C. and Andersen, M. 2001 Deprivation in London: an alternative to IMD 2000, CUPS. 22. Guy, C. M. and David, G. 2004 Measuring
physical access to 'healthy foods' in areas of social deprivation: a case study in Cardiff, International Journal of Consumer Studies, 28:3 222.
23. Noble, M., Smith, G., Wright, G., Dibben, C., Lloyd, M. and Penhale, B. 2000 Welsh Index of Multiple Deprivation 2000, The National Assembly for Wales.
24. Noble, M., Smith, G.A.N., Wright, G., Dibben, C. and Lloyd, M. 2001 The Northern Ireland Multiple Deprivation Measure 2001, Northern Ireland Statistics and Research Agency, Occasional Paper No 18.
25. Robson, B. 1994 Relative Deprivation in Northern Ireland, Northern Ireland Statistics and Research Agency.
26. Klasen, S. 2000 Measuring Poverty and Deprivation in South Africa, Review of Income and Wealth, 46:1 33
27. Sundaram, K. and Tendulkar, S. 1995 On Measuring Shelter Deprivation in India. Indian Economic Review, 30, 131- 165.
28. Salmond, C. and Crampton, P. 2002 NZDep2001 Index of Deprivation, Department of Public Health, Wellington School of Medicine and Health Sciences, New Zealand. 29. Bardhan, P. 2005 Globalization, Inequality,
and Poverty: An Overview, University of California at Berkeley.
30. Cutler, D. and Katz, L. 1992 Rising Inequality? American Economic Review, 822:546-551.
31. Harding, A. 1995 The Impact of Health, Education and Housing Outlays upon Income Distribution in Australia in the 1990s, Australian Economic Review, 281:71-86. 32. Pendakur, K. 1998 Family Income and