CPD
8, 3693–3717, 2012Southern westerlies in LGM and future (RCP4.5) climates
Y. Chavaillaz et al.
Title Page
Abstract Introduction
Conclusions References
Tables Figures
◭ ◮
◭ ◮
Back Close
Full Screen / Esc
Printer-friendly Version Interactive Discussion
Discussion
P
a
per
|
Dis
cussion
P
a
per
|
Discussion
P
a
per
|
Discussio
n
P
a
per
|
Clim. Past Discuss., 8, 3693–3717, 2012 www.clim-past-discuss.net/8/3693/2012/ doi:10.5194/cpd-8-3693-2012
© Author(s) 2012. CC Attribution 3.0 License.
Climate of the Past Discussions
This discussion paper is/has been under review for the journal Climate of the Past (CP). Please refer to the corresponding final paper in CP if available.
Southern westerlies in LGM and future
(RCP4.5) climates
Y. Chavaillaz1, F. Codron1, and M. Kageyama2
1
LMD/IPSL – UMR8539, Laboratoire de M ´et ´eorologie Dynamique, Universit ´e Pierre et Marie Curie, Case Postale 99, 4 Place Jussieu, 75252 Paris Cedex 05, France
2
LSCE/IPSL, Laboratoire des Sciences du Climat et de l’Environnement, CEA-CNRS-UVSQ – UMR8112, CE Saclay, L’Orme des Merisiers, Bat. 701, 91191 Gif-sur-Yvette Cedex, France
Received: 31 July 2012 – Accepted: 1 August 2012 – Published: 15 August 2012
Correspondence to: F. Codron ([email protected])
CPD
8, 3693–3717, 2012Southern westerlies in LGM and future (RCP4.5) climates
Y. Chavaillaz et al.
Title Page
Abstract Introduction
Conclusions References
Tables Figures
◭ ◮
◭ ◮
Back Close
Full Screen / Esc
Printer-friendly Version Interactive Discussion
Discussion
P
a
per
|
Dis
cussion
P
a
per
|
Discussion
P
a
per
|
Discussio
n
P
a
per
Abstract
Mid-latitude westerlies are a major component of the atmospheric circulation and understanding their behaviour under climate change is important for understanding
changes in precipitation, storms and atmosphere-ocean momentum, heat and CO2
ex-changes. The Southern Hemisphere westerlies, have been particularly studied in terms
5
of the latter aspects, since the Southern Ocean is a key region for the global oceanic
circulation as well as for CO2uptake. In this study, we analyse, mainly in terms of
max-imum jet-stream position, the behaviour of the southern westerlies for the Last Glacial Maximum (LGM, 21 000 yr ago, which is the last past cold extreme) and for a future cli-mate, obtained after stabilisation of the RCP4.5 scenario (hereafter RCP). The a priori
10
guess would be that the behaviour of the westerly jet-stream would be similar when examining its changes from LGM to pre-industrial (PI) conditions and from PI to RCP, i.e. in both cases a poleward shift in response to global warming. We show that this is in fact not the case, due to the impact of altitude changes of the Antarctic ice-sheet and/or to sea-ice cover changes.
15
1 Introduction
The mid-latitude westerlies are one of the major features of the Earth’s atmospheric circulation. They are strongly related to mid-latitude weather and climate, in particular because the mid-latitude high precipitation regions are zones of frequent passages of mid-latitude storms which precisely develop as instabilities along the mid-latitude
jet-20
streams. The equator to pole temperature gradient is one of the primary diving forces for the mid-latitude westerlies, which is expressed through the thermal wind relation-ship. But the eddies that develop along the mean westerlies as a result of the baroclinic instability also feedback on the mean jet-stream and can help maintaining it. The fact that mid-latitude westerlies are related to storms implies a relationship with extreme
25
CPD
8, 3693–3717, 2012Southern westerlies in LGM and future (RCP4.5) climates
Y. Chavaillaz et al.
Title Page
Abstract Introduction
Conclusions References
Tables Figures
◭ ◮
◭ ◮
Back Close
Full Screen / Esc
Printer-friendly Version Interactive Discussion
Discussion
P
a
per
|
Dis
cussion
P
a
per
|
Discussion
P
a
per
|
Discussio
n
P
a
per
|
from the present one is essential to get a better confidence in our prediction of future changes in precipitation and extreme events. Mid-latitude westerlies also represent a strong forcing for the underlying ocean: they are responsible for momentum and heat fluxes at the ocean-atmosphere interface, acting on the ocean mixed-layer and, by def-inition, piloting the wind-driven circulation. As such, the North Atlantic westerlies have
5
been the focus of many studies because of their role in driving the Gulf stream and the North Atlantic drift, but also because they are key in driving the Atlantic Meridional Overturning Circulation (e.g. Wunsch, 2002; Kuhlbrodt et al., 2007).
The Southern Hemisphere mid-latitude westerlies run nearly undisturbed by conti-nents and are associated with the strong Antarctic Circumpolar Current. Recently, they
10
have received more and more attention because they are another key to the global ocean overturning circulation (Sijp and England, 2008; Marshall and Speer, 2012) but maybe even more so because they have been suggested to play an important role in the recent (Le Qu ´er ´e et al., 2007; Lenton et al., 2009) and future (Russell et al., 2006a)
evolutions of the uptake of anthropogenic CO2 by the southern ocean. However, the
15
study of the impact of their evolution under anthropogenic forcing is currently hampered by the poor representation of the southern westerlies by climate models (Russell et al., 2006b).
Southern mid-latitude westerlies have also been proposed to play a role in explaining
the low level of atmospheric CO2concentration (185 ppmv, Monnin et al., 2001) at the
20
Last Glacial Maximum (LGM, 21 000 yr ago) and the subsequent atmospheric CO2
in-crease during the last termination. In particular, Toggweiler et al. (2006) and Banderas et al. (2012) suggest that an equatorward position of the southern jet-stream prevents
CO2 stored in the deep ocean to reach the atmosphere at the LGM, but that as soon
as the warming starts and the jet-stream shifts poleward, degassing of this CO2to the
25
atmosphere can start, therefore providing a positive feedback to the initial warming. Many other factors, in particular involving marine biology and increased dust fluxes
(e.g. Bopp et al., 2003), brine rejection and stratification-dependent ocean diffusion
CPD
8, 3693–3717, 2012Southern westerlies in LGM and future (RCP4.5) climates
Y. Chavaillaz et al.
Title Page
Abstract Introduction
Conclusions References
Tables Figures
◭ ◮
◭ ◮
Back Close
Full Screen / Esc
Printer-friendly Version Interactive Discussion
Discussion
P
a
per
|
Dis
cussion
P
a
per
|
Discussion
P
a
per
|
Discussio
n
P
a
per
CO2concentration at the LGM but the idea that a shift in the westerlies could have an
impact on atmospheric CO2 level has fostered many studies on reconstructing these
westerlies from palaeodata.
Rojas et al. (2009) provide an extensive review of palaeodata which have been used to reconstruct winds at the LGM. They classify these paleo-wind indicators in two
cat-5
egories: the “direct” wind indicators such as ocean upwelling or dust (although it could be argued that the latter also depends on dust sources, i.e. on vegetation, snow cover and soil humidity) and indirect wind indicators such as pollen or terrigeneous supply, or glacier advances (e.g. Putnam et al., 2010), which depend on the position of the mid-latitude front either via a dependence on precipitation or via a dependence on
tempera-10
ture. Hence, understanding the mechanisms controlling the position of the mid-latitude westerlies at the LGM is important not only to evaluate its possible impact on ocean
circulation and atmospheric-ocean CO2exchanges, but also to disentangle the signals
from the diverse palaeo-indicators interpreted as being related to wind. Climate models can help in such a task by assessing the consistency in e.g. westerly wind position and
15
precipitation or temperature changes. Rojas et al. (2009) have studied four LGM sim-ulations from the PMIP2 (Palaeoclimate Modelling Intercomparison Project, phase 2, Braconnot et al., 2007) in terms of changes, between the LGM and the pre-industrial climates of the southern westerlies and storm-tracks. They point to discrepancies in the models’ response to LGM boundary conditions and to the conflicting impacts of
20
the increasing meridional equator-to-pole temperature gradient at the surface and the decreasing gradient at mid-tropospheric levels.
Turning to the future evolution of the southern westerlies, climate models consistently predict a nearly year-round poleward shift in response to increasing greenhouse gas concentration (Yin, 2005; Lorenz and DeWeaver, 2007). The exception is the summer
25
CPD
8, 3693–3717, 2012Southern westerlies in LGM and future (RCP4.5) climates
Y. Chavaillaz et al.
Title Page
Abstract Introduction
Conclusions References
Tables Figures
◭ ◮
◭ ◮
Back Close
Full Screen / Esc
Printer-friendly Version Interactive Discussion
Discussion
P
a
per
|
Dis
cussion
P
a
per
|
Discussion
P
a
per
|
Discussio
n
P
a
per
|
Hartmann, 2001), that explain the dominance of jet shifts in the low-frequency natural variability, embodied by the Southern Annular Mode (SAM). These positive feedbacks also explain why the SAM dominates the atmospheric circulation response to climate forcings, but they tend to mask the initial causes. For example, the eddy lengthscale increases in future simulations (Kidston et al., 2010), which could cause a shift of the
5
jet, but it is not clear whether this larger scale is a direct impact of the warming (Kidston et al., 2011; Rivi `ere, 2011) or a response to the jet shift itself.
In any case it seems that changes in the meridional temperature gradient in the upper troposphere are a strong driver, or at least a good predictor of the jet shifts (Wilcox et al., 2012). This has been confirmed by a number of studies with idealised
dynamical-10
core models using a Held and Suarez (1994) – type setup to which a prescribed heating was added (Butler et al., 2010; Rivi `ere, 2011; Lorenz and DeWeaver, 2007). In all cases, the modeled jets shift poleward as a response to heating in the tropical upper-troposphere or cooling of the polar stratosphere. On the contrary, a warming of the polar lower-troposphere – as expected from the polar amplification predicted in the
15
Northern Hemisphere – could lead to an equatorward jet shift.
Our objective here is to study the changes in the characteristics of the Southern Hemisphere westerlies in the contrasted climates of the LGM and the future, compared to the pre-industrial reference state. We make use of the newly available CMIP5/PMIP3 simulations, performed with, for each of the 6 models analysed here, the same model
20
version for the LGM, pre-industrial and future climate simulations. After describing these simulations and the diagnostics chosen for our analyses (Sect. 2), we first assess the mean changes in southern jet-stream for both climates and study the relationship between these mean changes and the modes of interannual variability found for the pre-industrial state (Sect. 3). We then show that it is possible to derive a simple
rela-25
CPD
8, 3693–3717, 2012Southern westerlies in LGM and future (RCP4.5) climates
Y. Chavaillaz et al.
Title Page
Abstract Introduction
Conclusions References
Tables Figures
◭ ◮
◭ ◮
Back Close
Full Screen / Esc
Printer-friendly Version Interactive Discussion
Discussion
P
a
per
|
Dis
cussion
P
a
per
|
Discussion
P
a
per
|
Discussio
n
P
a
per
2 Numerical experiments and jet-stream definition
2.1 CMIP5/PMIP3 simulations
This work is based on simulations produced in the framework of the CMIP5 (Coupled Model Intercomparison Project, Taylor et al., 2012) and of the PMIP3 (Palaeoclimate Modelling Intercomparison Project, Otto-Bliesner et al., 2009; Braconnot et al., 2012)
5
projects. Since our aim is to study, in a common framework, LGM vs future changes in the Southern Hemisphere westerly jet-stream, we selected models which had both performed an LGM simulation and the RCP4.5 scenario. We chose this middle RCP scenario because the corresponding radiative forcing is roughly the opposite to that of the LGM. We studied the stabilised part of this scenario, after year 2100. For all
10
models, we have computed and analysed the climatological averages over 50 yr, from year 2251 to year 2300, for the RCP4.5 scenario. The LGM and PI (pre-industrial) simulations being equilibrium ones, we have considered averages over the final 50 years of these runs. Since we only study one RCP scenario, we will refer to these RCP4.5 simulations as the “RCP” simulations in the rest of the text.
15
At the time of analysis of these results (Spring 2012) there were 6 such models: CNRM-CM5, GISS-E2-R, IPSL-CM5A-LR, NCAR-CCSM, MIROC-ESM and MPI-ESM-P. For simplicity we will refer to them as: CNRM, GISS, IPSL, NCAR, MIROC and MPI, respectively. The LGM simulations all follow the PMIP3 protocol (https:// pmip3.lsce.ipsl.fr/wiki/doku.php/pmip3:design:21k:icesheet:index) except for the GISS
20
model which uses the ICE5.2G ice-sheets (Peltier, 2004). The PI–LGM difference in
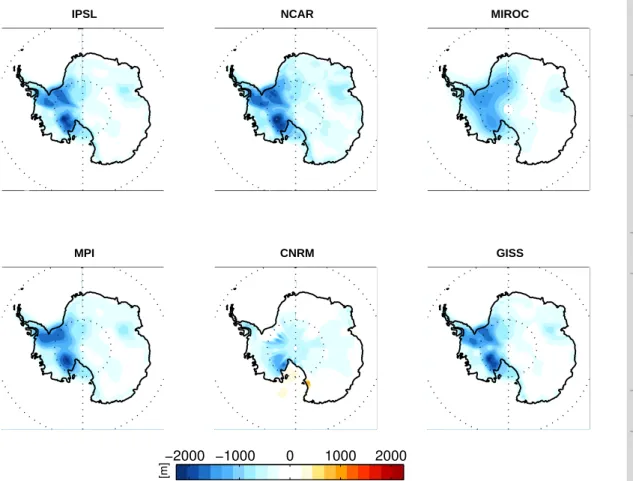
the altitude of the Antarctic ice-sheet is shown on Fig. 1. This figure shows that even though the same boundary conditions were applied to all models except GISS, the
translation of this forcing for each of the models yields different altitude differences.
These are particularly small for CNRM compared to the other four PMIP3 models. For
25
these latter models, the largest altitude changes are located over West Antarctica, with
CPD
8, 3693–3717, 2012Southern westerlies in LGM and future (RCP4.5) climates
Y. Chavaillaz et al.
Title Page
Abstract Introduction
Conclusions References
Tables Figures
◭ ◮
◭ ◮
Back Close
Full Screen / Esc
Printer-friendly Version Interactive Discussion
Discussion
P
a
per
|
Dis
cussion
P
a
per
|
Discussion
P
a
per
|
Discussio
n
P
a
per
|
GISS, while in CNRM, the altitude difference reaches only 1000 m at most and over
more restricted regions than in other models.
For our analysis of the relationship between the change in maximum jet-stream po-sition and temperature changes at the pole and in the tropics (Sect. 4), we included 6 other models for which the PI and RCP4.5 simulations were available:
IPSL-CM5A-5
MR, IPSL-CM5B-LR, bcc-csm-1, CanESM2, FGOALS-g2 and NorESM1-M. This in-creases the number of degrees of freedom for the correlation calculations in this sec-tion and helps building more significant relasec-tionships.
2.2 Jet-stream definition
To characterise the Southern Hemisphere westerly jets in the LGM, PI and RCP
sim-10
ulations, we have chosen to use the 850 hPa zonal wind. This level characterises the eddy-driven jet and its fluctuations while remaining above the surface boundary layer. The wind speed is larger at the tropopause level, but the upper-level jet mixes driving by eddies and the Hadley cell, and its position is less meaningful: a strong subtropical jet can hide changes in the near-surface winds, which are the ones interacting with the
15
ocean.
3 Southern Hemisphere jet-stream behaviour under future and glacial conditions
3.1 Mean behaviour
For an easier comparison between past and future climate changes, we examine the
20
RCP–PI anomalies on the one hand, and the PI–LGM anomalies on the other, i.e. the anomalies corresponding to a warming in both cases: warming since the LGM for the latter case, predicted future warming, compared to PI conditions, for the former case. In the following, we will refer to the “LGM anomalies” for the PI–LGM anomalies and to the “RCP anomalies” for the RCP–PI anomalies.
CPD
8, 3693–3717, 2012Southern westerlies in LGM and future (RCP4.5) climates
Y. Chavaillaz et al.
Title Page
Abstract Introduction
Conclusions References
Tables Figures
◭ ◮
◭ ◮
Back Close
Full Screen / Esc
Printer-friendly Version Interactive Discussion
Discussion
P
a
per
|
Dis
cussion
P
a
per
|
Discussion
P
a
per
|
Discussio
n
P
a
per
Figure 2 shows, for each model, the position of the maximum jet-stream in each run and the LGM and RCP zonal wind anomalies, both taken at 850 hPa as explained in Sect. 2.2. The structure of RCP anomalies are for all models a latitudinal dipole centered on the mean jet position, indicative of a poleward shift of the jet-stream. This poleward shift is quantified from the zonal mean 850 hPa zonal winds on Fig. 3 (left
5
panel). It is strongest for the IPSL model, which simulates a 3.5◦ poleward shift and
ranges from 0.7 to 1.5◦for other models. Figure 3 (right panel) shows that the maximum
speed of the jet-stream also increases in all the simulations, by 0.5 to slightly more than
1 m s−1. These changes are therefore consistent for all models, even though there are
differences in the amplitude of the anomalies. In particular the anomalies simulated by
10
the CNRM model appear as being the weakest on the maps of Fig. 2 (right panel). The LGM anomalies, in contrast, are far from being consistent for all models. This can already be seen from the maps of Fig. 2 (left panel). IPSL, CNRM and GISS simulate a poleward displacement for all longitudes, NCAR simulates a decrease of the wind speed and a slight equatorward displacement of the jet maximum while MIROC and
15
MPI simulate an equatorward displacement and strengthening of the jet-stream. This behaviour is summarised on Fig. 3.
In summary, the Southern Hemisphere westerlies show a consistent poleward shift and increase in maximum wind speed for the PI to future warming but not for the LGM to PI warming. This is intriguing because we could have expected a similar behaviour
20
for the two forcings, given that the the main forcing at LGM in the Southern Hemisphere is expected to be the one related to the lower greenhouse gas concentrations. Indeed, in contrast with the Northern Hemisphere situation for which massive ice-sheets are added to the Northern Hemisphere continents at LGM, compared to PI, in the Southern Hemisphere the Antarctic ice-sheet is present in the three types of simulation analysed
25
here. In Sect. 4 we will further analyse potential reasons for the different behaviour of
CPD
8, 3693–3717, 2012Southern westerlies in LGM and future (RCP4.5) climates
Y. Chavaillaz et al.
Title Page
Abstract Introduction
Conclusions References
Tables Figures
◭ ◮
◭ ◮
Back Close
Full Screen / Esc
Printer-friendly Version Interactive Discussion
Discussion
P
a
per
|
Dis
cussion
P
a
per
|
Discussion
P
a
per
|
Discussio
n
P
a
per
|
3.2 Relationship with PI modes of variability
As discussed in the introduction, the atmospheric circulation response to an external forcing often projects strongly on the dominant modes of internal variability: being the least damped modes, they are also the most sensitive ones.
In the Southern Hemisphere, the first EOF of the zonal-mean zonal wind, i.e. the
5
SAM, is a dipole centered on the mean jet latitude, and thus represents a meridional shift of that jet (Lorenz and Hartmann, 2001). This behavior is well reproduced by all
the models in the PI simulation (Fig. 4), with the node of the SAM following the different
mean latitudes of the simulated jet. The second EOF is by construction orthogonal to the first, and can be interpreted as a strenghtening and narrowing of the jet (conserving
10
angular mmentum), although it could also play a role in large shifts of the jet (Fyfe and Lorenz, 2005).
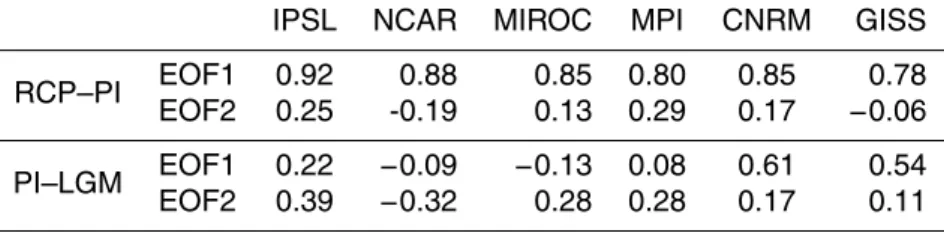
The RCP and LGM time-mean changes of the zonal-mean zonal wind at 850 hPa are shown on Fig. 4 together with the anomalies corresponding to one monthly standard deviation of the first two EOFs. In all cases, the future changes project most strongly on
15
the first EOF or SAM (average pattern correlation of 0.85), indicating that the changes are dominated by shifts of the jet (cf. Table 1). This is also true of LGM changes for the CNRM and GISS models, which both behave similarly in the past and future. For the other 4 models however, the LGM changes project better if anything on the second EOF, although the pattern correlations are weaker than for the RCP case (average
20
of 0.32).
4 A simple relationship between jet-stream and temperature differences?
In order to try and understand the different behaviours of the mean southern westerlies
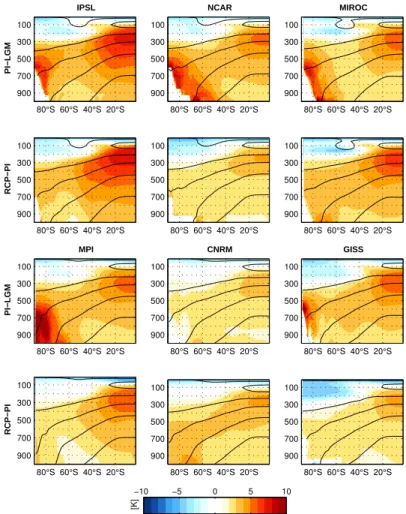
in the PI–LGM vs. RCP–PI anomalies, we first turn to the zonal temperature anomalies (Fig. 5), since the meridional thermal gradient is one of the drivers of the westerlies. For
25
CPD
8, 3693–3717, 2012Southern westerlies in LGM and future (RCP4.5) climates
Y. Chavaillaz et al.
Title Page
Abstract Introduction
Conclusions References
Tables Figures
◭ ◮
◭ ◮
Back Close
Full Screen / Esc
Printer-friendly Version Interactive Discussion
Discussion
P
a
per
|
Dis
cussion
P
a
per
|
Discussion
P
a
per
|
Discussio
n
P
a
per
warming and stratospheric cooling. The stratospheric cooling is maximum at high lati-tudes. The tropospheric warming has a maximum near the top of the troposphere in the tropics for both the past and future situations in all models, and a secondary maximum in the lower half of the troposphere at high latitudes for some models. So, at the top of the troposphere, for the past and future evolutions, models simulate a strengthening of
5
the meridional temperature gradient. This is consistent with a strengthening of the jet-stream. The poleward shift of the jet-stream is also consistent with the idealised studies (Rivi `ere, 2011) showing that a warming of the upper tropical troposphere is enough to cause a poleward shift of this jet-stream.
In another idealised simulation, Rivi `ere (2011) shows that an imposed warming in
10
the lower troposphere over Antarctica causes an equatorward shift of the jet-stream. In the models analysed here, the maximum warming in the lower half of the tropo-sphere at high latitudes is especially strong for the PI–LGM anomaly, except for the CNRM model. In fact, a comparison of Figs. 3 and 5 shows that those models with strongest warming near Antarctica, and in particular near the surface, from LGM to PI
15
(NCAR, MIROC, MPI) are those which simulate an equatorward shift of the jet-stream. In contrast, IPSL, CNRM and GISS do not show a strong warming near Antarctica at the surface and simulate a poleward shift of the westerlies. Hence, for the LGM to PI evolution, the westerlies are subject to contrasting influences: (1) the strengthening of the upper tropospheric temperature gradient and (2) the weakening of the lower
tropo-20
sphere temperature gradient. This appears to explain the range of model responses for the LGM case, with some models in which the upper-troposphere influence is larger, while in others it is the lower-troposphere influence which is most important.
To test this idea, we study the quantitative relationships between the jet-stream shift
and the temperature differences at the high-latitudes and in the tropics. To do so, we
25
define:
– Tpole as the averaged temperature for latitudes 90 to 65◦S and pressure levels
CPD
8, 3693–3717, 2012Southern westerlies in LGM and future (RCP4.5) climates
Y. Chavaillaz et al.
Title Page
Abstract Introduction
Conclusions References
Tables Figures
◭ ◮
◭ ◮
Back Close
Full Screen / Esc
Printer-friendly Version Interactive Discussion
Discussion
P
a
per
|
Dis
cussion
P
a
per
|
Discussion
P
a
per
|
Discussio
n
P
a
per
|
– Ttrop as the averaged temperature for latitudes 30◦S to the equator and for the
whole atmospheric column.
These averages are mass and area weighted. We also defineδTtropand δTpoleas the
RCP–PI or the PI–LGM anomalies inTtropandTpole,φas the latitude of the maximum
jet-stream andδφas its shift, counted positive poleward.
5
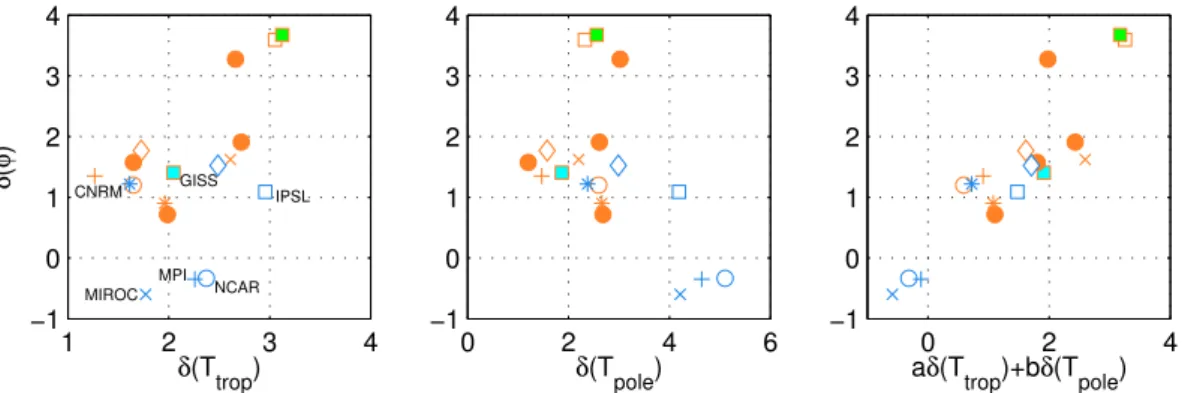
Figure 6 shows the relationships between the jet-stream latitudinal shiftδφand the
changes in Ttrop (right panel) and Tpole (middle panel). The relationship between δφ
andδTtropis quasi-linear for the RCP case, withδφincreasing for an increase inδTtrop.
The correlation between these variables is 0.78, higher than thep=0.01 level of 0.6
valid for this number of degrees of freedom. But this relationship does not hold for the
10
LGM (correlation of 0.26). On the other hand, Fig. 6 (middle panel) shows a significant
relationship betweenδφand δTpole for the LGM, with a largerδφ for smaller values
inδTpole (correlation of −0.78). But this relationship does not hold for the RCP case
(correlation of 0.25).
These results suggest that the jet-stream shift could be correlated to a combination
15
of the two indicesδTtropandδTpole. These two indices can be considered as
indepen-dent since their correlation is 0.33. Therefore we can perform a multi-linear regression attempting to find a relationship of the form:
δφ=a×δTtrop+b×δTpole.
For a=1.72 and b=0.86, we find a correlation between δφ and (a×δTtrop+
20
b×δTpole) of 0.9. This relationship is shown on the left panel of Fig. 6. This relationship
implies a ratio of 1 : 2 between the influence of the high-latitude lower troposphere tem-perature change and that of the tropical temtem-perature change (those having an opposite sign).
Figure 7 shows the contributions of each of these terms for each model, for the LGM
25
CPD
8, 3693–3717, 2012Southern westerlies in LGM and future (RCP4.5) climates
Y. Chavaillaz et al.
Title Page
Abstract Introduction
Conclusions References
Tables Figures
◭ ◮
◭ ◮
Back Close
Full Screen / Esc
Printer-friendly Version Interactive Discussion
Discussion
P
a
per
|
Dis
cussion
P
a
per
|
Discussion
P
a
per
|
Discussio
n
P
a
per
5 Summary, discussion and perspectives
In this work, we have examined the behaviour of the southern westerlies for two con-strasted climate changes compared to the pre-industrial conditions: the Last Glacial Maximum climate and the stabilised part of the RCP4.5 future scenario. Because these climates are characterised by a radiative forcing of similar amplitude from PI to RCP
5
and from LGM to PI, an a priori guess would have been to obtain a similar behaviour of the jet-stream: since the jet-streams had been shown to consistently move poleward under increased atmospheric greenhouse gas conditions, the guess was for a poleward shift from the LGM to the PI conditions as well.
We analysed the results of the 6 models for which LGM, PI and RCP4.5 simulations
10
were available (in Spring 2012) in the CMIP5 database. All models indeed show an poleward shift of the jet-stream under the RCP conditions. The additional RCP simu-lations analysed in Sect. 4 also show this poleward shift. However, in the case of the LGM to PI evolution (i.e. warming due to the deglaciation), 3 models show a modest equatorward shift of the westerlies, while the other 3 show a comparatively strong
pole-15
ward shift, of the same amplitude or larger than the shift found in the RCP simulations. A comparison with the dominant modes of variability in the PI simulation shows that the future changes project strongly on the first mode, the SAM, indicating that the jet shift dominates the response. There is however no such systematic relationship in the LGM to PI case.
20
An explanation for this a priori paradoxical behaviour of the LGM jet-stream is found in the structure of the anomaly of the latitude-height temperature fields. In the RCP case, the upper tropospheric meridional temperature gradient strengthens due to both an upper-tropospheric tropical warming and a polar stratospheric cooling. This be-haviour is also found in the evolution from LGM to PI, but an additional factor comes
25
CPD
8, 3693–3717, 2012Southern westerlies in LGM and future (RCP4.5) climates
Y. Chavaillaz et al.
Title Page
Abstract Introduction
Conclusions References
Tables Figures
◭ ◮
◭ ◮
Back Close
Full Screen / Esc
Printer-friendly Version Interactive Discussion
Discussion
P
a
per
|
Dis
cussion
P
a
per
|
Discussion
P
a
per
|
Discussio
n
P
a
per
|
even though this decrease is strong only over West Antarctica, and to possible sea-ice cover changes between the LGM and PI states.
To assess the importance of these two factors, i.e. the tropical temperature changes vs. the lower troposphere high-latitude temperature changes, we have quantified their correlation with the jet-stream latitudinal position. As expected, good correlations are
5
obtained between the jet-stream shift and the tropical temperature changes for the RCP case, while the best correlation is obtained with the lower troposphere high-latitude temperature changes in the LGM case. This can be expressed in a unified manner by performing a regression analysis between the jet-stream shift and a combination of both these temperature changes.
10
This work therefore shows that in terms of the southern westerlies, contrary to a priori expectations, the LGM to PI evolution does not necessarily ressemble the PI to future one. This is most probably due to the altitude changes of the Antarctic ice-sheet and/or to Southern Ocean sea-ice changes which could cause strong surface temper-ature changes. A perspective to this work is to test the impact of each of these changes
15
with several models. This is the only way by which we will be able to know which fac-tor is most important. As seen in the introduction, if the westerlies are so sensitive to changes in the altitude of the Antarctic ice-sheet, there are strong implications for
the understanding of the LGM climate and atmosphere-ocean CO2exchanges.
Recon-structing the past evolution of the Antarctic ice-sheet is a very difficult task, as shown by
20
the differences between the two available reconstructions (cf. https://pmip3.lsce.ipsl.fr/
wiki/lib/exe/fetch.php/pmip3:design:21k:icesheet:gaa5.pdf and corresponding discus-sion on https://pmip3.lsce.ipsl.fr/wiki/doku.php/pmip3:design:21k:icesheet:index). Our work shows that LGM to PI Antarctic ice-sheet altitude changes could have a profound
impact on the Southern Hemisphere westerlies and that the differences related to the
25
different reconstructions should be investigated further. This has also implications for
CPD
8, 3693–3717, 2012Southern westerlies in LGM and future (RCP4.5) climates
Y. Chavaillaz et al.
Title Page
Abstract Introduction
Conclusions References
Tables Figures
◭ ◮
◭ ◮
Back Close
Full Screen / Esc
Printer-friendly Version Interactive Discussion
Discussion
P
a
per
|
Dis
cussion
P
a
per
|
Discussion
P
a
per
|
Discussio
n
P
a
per
Acknowledgements. We acknowledge the World Climate Research Programme’s Working Group on Coupled Modelling, which is responsible for CMIP, and we thank the climate mod-eling groups (listed in Sect. 2.1 of this paper) for producing and making available their model output. For CMIP the US Department of Energy’s Program for Climate Model Diagnosis and Intercomparison provides coordinating support and led development of software infrastructure
5
in partnership with the Global Organization for Earth System Science Portals. We also thanks
the team led by S. Denvil at IPSL for their efficient CMIP5/PMIP3 data management.
The publication of this article is financed by CNRS-INSU.
10
References
Banderas, R., ´Alvarez-Solas, J., and Montoya, M.: Role of CO2and Southern Ocean winds in
glacial abrupt climate change, Clim. Past, 8, 1011–1021, doi:10.5194/cp-8-1011-2012, 2012. 3695
Bopp, L., Kohfeld, K., Le Qu ´er ´e, C., and Aumont, O.: Dust impact on marine
15
biota and atmospheric CO2 during glacial periods, Paleoceanography, 18, 1046, doi:10.1029/2002PA000810, 2003. 3695
Bouttes, N., Paillard, D., Roche, D. M., Waelbroeck, C., Kageyama, M., Lourantou, A., Michel, E., and Bopp, L.: Impact of oceanic processes on the carbon cycle during the last termination, Clim. Past, 8, 149–170, doi:10.5194/cp-8-149-2012, 2012. 3695
20
Braconnot, P., Otto-Bliesner, B., Harrison, S., Joussaume, S., Peterchmitt, J.-Y., Abe-Ouchi, A.,
Crucifix, M., Driesschaert, E., Fichefet, Th., Hewitt, C. D., Kageyama, M., Kitoh, A., Laˆın ´e, A.,
CPD
8, 3693–3717, 2012Southern westerlies in LGM and future (RCP4.5) climates
Y. Chavaillaz et al.
Title Page
Abstract Introduction
Conclusions References
Tables Figures
◭ ◮
◭ ◮
Back Close
Full Screen / Esc
Printer-friendly Version Interactive Discussion
Discussion
P
a
per
|
Dis
cussion
P
a
per
|
Discussion
P
a
per
|
Discussio
n
P
a
per
|
Part 1: experiments and large-scale features, Clim. Past, 3, 261–277, doi:10.5194/cp-3-261-2007, 2007. 3696
Braconnot, P., Harrison, S. P., Kageyama, M., Bartlein, P. J., Masson-Delmotte, V., Abe-Ouchi, A., Otto-Bliesner, B., and Zhao, Y.: Evaluation of climate models using palaeoclimatic data, Nat. Clim. Change, 2, 417–424, doi:10.1038/NCLIMATE1456, 2012. 3698
5
Butler, A. H., Thompson, D. W. J., and Heikes, R.: The Steady-State Atmospheric Circulation Response to Climate Change like Thermal Forcings in a Simple General Circulation Model, J. Climate, 23, 3474–3496, doi:10.1175/2010JCLI3228.1, 2010. 3697
Fyfe, J. C. and Lorenz, D. J.: Characterizing Midlatitude Jet Variability: Lessons from a Simple GCM, J. Climate, 18, 3400–3404, doi:10.1175/JCLI3486.1, 2005. 3701
10
Held, I. M. and Suarez, M. J.: A Proposal for the Intercomparison of the Dynamical Cores of Atmospheric General Circulation Models, B. Am. Meteorol. Soc., 75, 1825–1830,
doi:10.1175/1520-0477(1994)075<1825:APFTIO>2.0.CO;2, 1994. 3697
Kidston, J., Dean, S. M., Renwick, J. A., and Vallis, G. K.: A robust increase in the eddy length scale in the simulation of future climates, Geophys. Res. Lett., 37, L03806,
15
doi:10.1029/2009GL041615, 2010. 3697
Kidston, J., Vallis, G. K., Dean, S. M., and Renwick, J. A.: Can the Increase in the Eddy Length Scale under Global Warming Cause the Poleward Shift of the Jet Streams?, J. Climate, 24, 3764–3780, doi:10.1175/2010JCLI3738.1, 2011. 3697
Kuhlbrodt, T.and Griesel, A., Montoya, M., Levermann, A., Hofmann, M., and Rahmstorf, S.: On
20
the driving processes of the Atlantic meridional overturning circulation, Rev. Geophys., 45, RG2001, doi:10.1029/2004RG000166, 2007. 3695
Le Qu ´er ´e, C., R ¨odenbeck, C., Buitenhuis, E. T., Conway, T. J., Langenfelds, R., Gomez, A., Labuschagne, C., Ramonet, M., Nakazawa, T., Metzl, N., Gillett, N., and Heimann, M.:
Sat-uration of the Southern Ocean CO2 Sink Due to Recent Climate Change, Science, 316,
25
1735–1738, 2007. 3695
Lenton, A., Codron, F., Bopp, L., Metzl, N., Cadule, P., Tagliabue, A., and Le Sommer, J.: Strato-spheric ozone depletion reduces ocean carbon uptake and enhances ocean acidification, Geophys. Res. Lett., 36, L12606, doi:10.1029/2009GL038227, 2009. 3695
Lorenz, D. J. and DeWeaver, E. T.: Tropopause height and zonal wind response to
30
CPD
8, 3693–3717, 2012Southern westerlies in LGM and future (RCP4.5) climates
Y. Chavaillaz et al.
Title Page
Abstract Introduction
Conclusions References
Tables Figures
◭ ◮
◭ ◮
Back Close
Full Screen / Esc
Printer-friendly Version Interactive Discussion
Discussion
P
a
per
|
Dis
cussion
P
a
per
|
Discussion
P
a
per
|
Discussio
n
P
a
per
Lorenz, D. J. and Hartmann, D. L.: Eddy–Zonal Flow Feedback in the Southern Hemisphere,
J. Atmos. Sci., 58, 3312–3327, doi:10.1175/1520-0469(2001)058<3312:EZFFIT>2.0.CO;2,
2001. 3696, 3701
Marshall, J. and Speer, K.: Closure of the meridional overturning circulation through Southern Ocean upwelling, Nat. Geosci., 5, 171–180, doi:10.1038/ngeo1391, 2012. 3695
5
Monnin, E., Indermuhle, A., Dallenbach, A., Fluckiger, J., Stauffer, B., Stocker, T. F., Raynaud,
D., and Barnola, J.-M.: Atmospheric CO2 concentrations over the last glacial termination,
Science, 291, 112–114, 2001. 3695
Otto-Bliesner, B. L., Joussaume, S., Braconnot, P., Harrison, S. P., and Abe-Ouchi, A.: Modeling and Data Syntheses of Past Climates, EOS, 90, 93, 2009. 3698
10
Peltier, W. R.: Global glacial isostasy and the surface of the ice-age earth: The ICE-5G (VM2) model and GRACE, Ann. Rev. Earth Planet. Sci., 32, 111–149, doi:10.1146/annurev.earth.32.082503.144359, 2004. 3698
Perlwitz, J., Pawson, S., Fogt, R. L., Nielsen, J. E., and Neff, W. D.: Impact of
strato-spheric ozone hole recovery on Antarctic climate, Geophys. Res. Lett., 35, L08714,
15
doi:10.1029/2008GL033317, 2008. 3696
Putnam, A. E., Denton, G. H., Schaefer, J. M., Barrell, D. J. A., Andersen, B. G., Finkel, R. C., Schwartz, R., Doughty, A. M., Kaplan, M. R., and Schl ¨uchter, C.: Glacier advance in southern middle-latitudes during the Antarctic Cold Reversal, Nat. Geosci., 3, 700–704, 2010. 3696 Rivi `ere, G.: A dynamical interpretation of the poleward shift of the jet streams in global warming
20
scenarios, J. Atmos. Sci., 68, 1253–1272, doi:10.1175/2011JAS3641.1, 2011. 3697, 3702 Rojas, M., Moreno, P., Kageyama, M., Crucifix, M., Hewitt, C., Abe-Ouchi, A., Ohgaito, R.,
Brady, E. C., and Hope, P.: The Southern Westerlies during the last glacial maximum in PMIP2 simulations, Clim. Dynam., 32, 525–548, doi:10.1007/s00382-008-0421-7, 2009. 3696
25
Russell, J. L., Dixon, K. W., Gnanadesikan, A., Stouffer, R. J., and Toggweiler, J. R.: The
south-ern hemisphere westerlies in a warming wolrd: propping open the door to the deep ocean, J. Climate, 19, 6382–6390, 2006a. 3695
Russell, J. L., Stouffer, R. J., and Dixon, K. W.: Intercomparison of the southern ocean
circula-tions in IPCC coupled model control simulacircula-tions, J. Climate, 19, 4560–4575, 2006b. 3695
30
Sijp, W. P. and England, M. H.: The effect of a northward shift in the southern hemisphere
CPD
8, 3693–3717, 2012Southern westerlies in LGM and future (RCP4.5) climates
Y. Chavaillaz et al.
Title Page
Abstract Introduction
Conclusions References
Tables Figures
◭ ◮
◭ ◮
Back Close
Full Screen / Esc
Printer-friendly Version Interactive Discussion
Discussion
P
a
per
|
Dis
cussion
P
a
per
|
Discussion
P
a
per
|
Discussio
n
P
a
per
|
Taylor, K. E., Stouffer, R. J., and Meehl, G. A.: An Overview of CMIP5 and the Experiment
Design, B. Am. Meteorol. Soc., 93, 485–498, doi:10.1175/BAMS-D-11-00094.1, 2012. 3698 Toggweiler, J. R., Russell, J. L., and Carson, S. R.: Midlatitude westerlies,
atmo-spheric CO2, and climate change during the ice ages, Paleoceanography, 21, PA2005,
doi:10.1029/2005PA001154, 2006. 3695
5
Wilcox, L. J., Charlton-Perez, A. J., and Gray, L. J.: Trends in Austral jet position in ensembles of high- and low-top CMIP5 models, J. Geophys. Res., 117, D13115, doi:10.1029/2012JD017597, 2012. 3696, 3697
Wunsch, C.: What Is the Thermohaline Circulation?, Science, 298, 1179–1181, 2002. 3695 Yin, J. H.: A consistent poleward shift of the storm-tracks in the simulations of the 21st century
10
CPD
8, 3693–3717, 2012Southern westerlies in LGM and future (RCP4.5) climates
Y. Chavaillaz et al.
Title Page
Abstract Introduction
Conclusions References
Tables Figures
◭ ◮
◭ ◮
Back Close
Full Screen / Esc
Printer-friendly Version Interactive Discussion
Discussion
P
a
per
|
Dis
cussion
P
a
per
|
Discussion
P
a
per
|
Discussio
n
P
a
per
Table 1. Spatial (90–0◦ latitude) correlation between the 850-hPa zonal-mean zonal wind
anomalies linked to the first or second EOFs of the PI simulation, and to the PI–LGM or RCP–PI differences.
IPSL NCAR MIROC MPI CNRM GISS
RCP–PI EOF1 0.92 0.88 0.85 0.80 0.85 0.78
EOF2 0.25 -0.19 0.13 0.29 0.17 −0.06
PI–LGM EOF1 0.22 −0.09 −0.13 0.08 0.61 0.54
CPD
8, 3693–3717, 2012Southern westerlies in LGM and future (RCP4.5) climates
Y. Chavaillaz et al.
Title Page
Abstract Introduction
Conclusions References
Tables Figures
◭ ◮
◭ ◮
Back Close
Full Screen / Esc
Printer-friendly Version Interactive Discussion
Discussion
P
a
per
|
Dis
cussion
P
a
per
|
Discussion
P
a
per
|
Discussio
n
P
a
per
|
IPSL NCAR MIROC
MPI CNRM GISS
[m]
−2000 −1000 0 1000 2000
Fig. 1.LGM ice-sheets for the six models included in the present analysis: altitude PI–LGM
difference. This is a reconstructed difference using surface pressure, as topography was not
CPD
8, 3693–3717, 2012Southern westerlies in LGM and future (RCP4.5) climates
Y. Chavaillaz et al.
Title Page Abstract Introduction Conclusions References Tables Figures ◭ ◮ ◭ ◮ Back Close
Full Screen / Esc
Printer-friendly Version Interactive Discussion Discussion P a per | Dis cussion P a per | Discussion P a per | Discussio n P a per PI−LGM IPSL
0° 90° E 180° E 90° W 0° 80° S
60° S 40° S 20° S
RCP−PI IPSL
0° 90° E 180° E 90° W 0° 80° S
60° S 40° S 20° S
PI−LGM NCAR
0° 90° E 180° E 90° W 0° 80° S
60° S 40° S 20° S
RCP−PI NCAR
0° 90° E 180° E 90° W 0° 80° S
60° S 40° S 20° S
PI−LGM MIROC
0° 90° E 180° E 90° W 0° 80° S
60° S 40° S 20° S
RCP−PI MIROC
0° 90° E 180° E 90° W 0° 80° S
60° S 40° S 20° S
PI−LGM MPI
0° 90° E 180° E 90° W 0° 80° S
60° S 40° S 20° S
RCP−PI MPI
0° 90° E 180° E 90° W 0° 80° S
60° S 40° S 20° S
PI−LGM CNRM
0° 90° E 180° E 90° W 0° 80° S
60° S 40° S 20° S
RCP−PI CNRM
0° 90° E 180° E 90° W 0° 80° S
60° S 40° S 20° S
PI−LGM GISS
0° 90° E 180° E 90° W 0° 80° S
60° S 40° S 20° S
RCP−PI GISS
0° 90° E 180° E 90° W 0° 80° S
60° S 40° S 20° S
[m/s]
−4 −2 0 2 4
Fig. 2. Anomalies (in m s−1) in 850 hPa mean annual zonal wind for the six models studied here. Left column: PI–
CPD
8, 3693–3717, 2012Southern westerlies in LGM and future (RCP4.5) climates
Y. Chavaillaz et al.
Title Page
Abstract Introduction
Conclusions References
Tables Figures
◭ ◮
◭ ◮
Back Close
Full Screen / Esc
Printer-friendly Version Interactive Discussion
Discussion
P
a
per
|
Dis
cussion
P
a
per
|
Discussion
P
a
per
|
Discussio
n
P
a
per
|
IPSL NCAR MIROC MPI CNRM GISS −1
0 1 2 3 4
Poleward jet shift
IPSL NCAR MIROC MPI CNRM GISS −1.5
−1 −0.5 0 0.5 1 1.5
Wind speed change
Fig. 3.Left panel: Jet-stream poleward shift (◦of latitude) and right panel: wind speed maximum
CPD
8, 3693–3717, 2012Southern westerlies in LGM and future (RCP4.5) climates
Y. Chavaillaz et al.
Title Page
Abstract Introduction
Conclusions References
Tables Figures
◭ ◮
◭ ◮
Back Close
Full Screen / Esc
Printer-friendly Version Interactive Discussion
Discussion
P
a
per
|
Dis
cussion
P
a
per
|
Discussion
P
a
per
|
Discussio
n
P
a
per
−60 −40 −20 −4
−2 0 2 4
IPSL
zonal wind (m/s)
−60 −40 −20 −4
−2 0 2 4
NCAR
−60 −40 −20 −4
−2 0 2 4
MIROC
−60 −40 −20 −4
−2 0 2 4
MPI
zonal wind (m/s)
−60 −40 −20 −4
−2 0 2 4
latitude CNRM
−60 −40 −20 −4
−2 0 2 4
GISS
Fig. 4. Zonal-mean zonal wind at 850 hPa for all the models. Black lines: anomalies for 1σ
of the first (solid line) and second (dashed) EOF of the PI simulation. Colors: mean PI–LGM
difference (blue) and RCP-PI difference (red). The vertical line indicates the mean position of
CPD
8, 3693–3717, 2012Southern westerlies in LGM and future (RCP4.5) climates
Y. Chavaillaz et al.
Title Page Abstract Introduction Conclusions References Tables Figures ◭ ◮ ◭ ◮ Back Close
Full Screen / Esc
Printer-friendly Version Interactive Discussion Discussion P a per | Dis cussion P a per | Discussion P a per | Discussio n P a per | PI−LGM IPSL
80°S 60°S 40°S 20°S 900 700 500 300 100 NCAR
80°S 60°S 40°S 20°S 900 700 500 300 100 MIROC
80°S 60°S 40°S 20°S 900 700 500 300 100 RCP−PI
80°S 60°S 40°S 20°S 900
700 500 300 100
80°S 60°S 40°S 20°S 900
700 500 300 100
80°S 60°S 40°S 20°S 900 700 500 300 100 MPI PI−LGM
80°S 60°S 40°S 20°S 900 700 500 300 100 CNRM
80°S 60°S 40°S 20°S 900 700 500 300 100 GISS
80°S 60°S 40°S 20°S 900 700 500 300 100 RCP−PI
80°S 60°S 40°S 20°S 900 700 500 300 100 [K]
−10 −5 0 5 10 80°S 60°S 40°S 20°S 900
700 500 300 100
80°S 60°S 40°S 20°S 900
700 500 300 100
CPD
8, 3693–3717, 2012Southern westerlies in LGM and future (RCP4.5) climates
Y. Chavaillaz et al.
Title Page
Abstract Introduction
Conclusions References
Tables Figures
◭ ◮
◭ ◮
Back Close
Full Screen / Esc
Printer-friendly Version Interactive Discussion
Discussion
P
a
per
|
Dis
cussion
P
a
per
|
Discussion
P
a
per
|
Discussio
n
P
a
per
1 2 3 4
−1 0 1 2 3 4
IPSL
NCAR MIROC
MPI CNRM GISS
δ
(
φ
)
δ(T
trop)
0 2 4 6
−1 0 1 2 3 4
δ(T
pole)
0 2 4
−1 0 1 2 3 4
aδ(T
trop)+bδ(Tpole)
Fig. 6.Relationships between the anomaly of the jet-stream maximum positionδφand(a)the
anomaly in tropical temperaturesδTtrop, b) the anomaly in high-latitude lower troposphere
tem-peratureδTpole and (c) (a×δTtrop+b×δTpole). See text (Sect. 4) for the definition of these
CPD
8, 3693–3717, 2012Southern westerlies in LGM and future (RCP4.5) climates
Y. Chavaillaz et al.
Title Page
Abstract Introduction
Conclusions References
Tables Figures
◭ ◮
◭ ◮
Back Close
Full Screen / Esc
Printer-friendly Version Interactive Discussion
Discussion
P
a
per
|
Dis
cussion
P
a
per
|
Discussion
P
a
per
|
Discussio
n
P
a
per
|
IPSL NCAR MIROC MPI CNRM GISS −6
−4 −2 0 2 4 6
PI−LGM
IPSL NCAR MIROC MPI CNRM GISS −6
−4 −2 0 2 4 6
RCP−PI
Fig. 7.Contribution to (a×δTpole+b×δTtrop) for each model, for PI–LGM and RCP–PI: in red