CPD
11, 181–220, 2015Tropical cyclone genesis
J. H. Koh and C. M. Brierley
Title Page
Abstract Introduction
Conclusions References
Tables Figures
◭ ◮
◭ ◮
Back Close
Full Screen / Esc
Printer-friendly Version Interactive Discussion
Discussion
P
a
per
|
Discussion
P
a
per
|
Discussion
P
a
per
|
Discussion
P
a
per
|
Clim. Past Discuss., 11, 181–220, 2015 www.clim-past-discuss.net/11/181/2015/ doi:10.5194/cpd-11-181-2015
© Author(s) 2015. CC Attribution 3.0 License.
This discussion paper is/has been under review for the journal Climate of the Past (CP). Please refer to the corresponding final paper in CP if available.
Tropical cyclone genesis across
palaeoclimates
J. H. Koh and C. M. Brierley
Department of Geography, University College London, London WC1E 6BT, UK
Received: 10 December 2014 – Accepted: 12 January 2015 – Published: 6 February 2015 Correspondence to: C. M. Brierley ([email protected])
CPD
11, 181–220, 2015Tropical cyclone genesis
J. H. Koh and C. M. Brierley
Title Page
Abstract Introduction
Conclusions References
Tables Figures
◭ ◮
◭ ◮
Back Close
Full Screen / Esc
Printer-friendly Version Interactive Discussion
Discussion
P
a
per
|
Discussion
P
a
per
|
Discussion
P
a
per
|
Discussion
P
a
per
|
Abstract
Tropical cyclone genesis is investigated for the Pliocene, Last Glacial Maximum (LGM) and the mid-Holocene through analysis of five climate models. The genesis potential in-dex is used to estimate this from large scale atmospheric properties. The mid-Pliocene and LGM characterise periods where carbon dioxide levels were higher and lower than
5
pre-industrial respectively, while the mid-Holocene differed primarily in its orbital figuration. The number of tropical cyclones formed each year is found to be fairly con-sistent across the various palaeoclimates. Although there is some model uncertainty in the change of global annual tropical cyclone frequency, there are coherent changes in the spatial patterns of tropical cyclogenesis.
10
During the Pliocene and LGM, changes in carbon dioxide led to sea surface tem-perature changes throughout the tropics, yet the potential intensity of tropical cyclones appears relatively insensitive to these variations. Changes in tropical cyclone genesis during the mid-Holocene are observed to be asymmetric about the Equator: genesis is reduced in the Northern Hemisphere, but enhanced in the Southern Hemisphere. This
15
is clearly driven by the altered seasonal insolation. Nonetheless, the enhanced season-ality may have driven localised effects on tropical cyclone genesis, through changes to the strength of monsoons and shifting of the inter-tropical convergence zone. Trends in future tropical cyclone genesis are neither consistent between the five models studied, nor with the palaeoclimate results. It is not clear why this should be the case.
20
1 Introduction
Tropical cyclones (TC) constitute one of the most powerful forces of nature and can cause severe destruction to human life and property. How TC genesis may change in the face of climate change is thus an area of strong interest. Past studies using high resolution general circulation models (GCMs) have generally suggested that cyclone
25
CPD
11, 181–220, 2015Tropical cyclone genesis
J. H. Koh and C. M. Brierley
Title Page
Abstract Introduction
Conclusions References
Tables Figures
◭ ◮
◭ ◮
Back Close
Full Screen / Esc
Printer-friendly Version Interactive Discussion
Discussion
P
a
per
|
Discussion
P
a
per
|
Discussion
P
a
per
|
Discussion
P
a
per
|
(Knutson et al., 2010). However, recent analyses of future simulations performed as part of the Coupled Model Intercomparison Project Phase 5 (CMIP5) appear equivo-cal: statistical downscaling indicates an increase in both cyclone intensity and gene-sis (Emanuel, 2013); dynamical downscaling indicates an increase in intensity com-bined with a reduction in frequency (Knutson et al., 2013); tracking algorithms of global
5
coupled models do likewise (Camargo, 2013); large-scale cyclogenesis indices have shown both frequency increases (Emanuel, 2013) and decreases (Camargo, 2013).
Understanding past climates provides a means for scientists to contextualise future climate change impacts. Palaeoclimates with altered climate forcings, such as the el-evated levels of carbon dioxide during the Pliocene period, may provide clues about
10
how the trend of cyclone genesis would respond to ongoing anthropogenic emissions of greenhouse gases.
The mid-Piacenzian warm portion of the mid-Pliocene (around 3 million years ago, henceforth “Pliocene”) was a recent episode in Earth’s geological history where mean global temperatures were warmer by 2–3◦C compared to modern times (Haywood
15
et al., 2013), but the warming was not constant across the globe. Sea surface tempera-tures (SST) anomalies were more pronounced at the higher latitudes (up to 20◦C in the high Arctic; Ballantyne et al., 2009), while the lower latitudes exhibited minimal change in places (Dowsett et al., 2010). The geography of the continents and oceans were relatively similar to earth’s current configuration (Haywood et al., 2011). Carbon
diox-20
ide concentrations were at or near present day levels during the mid-Pliocene (Pagani et al., 2009). There is potential for using the Pliocene to learn about the equilibrium state of the earth’s warm climate following anthropogenic greenhouse gas influence (Haywood et al., 2009).
Meanwhile, the icehouse climate of the Last Glacial Maximum (LGM) at 21ka serves
25
CPD
11, 181–220, 2015Tropical cyclone genesis
J. H. Koh and C. M. Brierley
Title Page
Abstract Introduction
Conclusions References
Tables Figures
◭ ◮
◭ ◮
Back Close
Full Screen / Esc
Printer-friendly Version Interactive Discussion
Discussion
P
a
per
|
Discussion
P
a
per
|
Discussion
P
a
per
|
Discussion
P
a
per
|
LGM and pre-industrial intervals, the Palaeoclimate Model Intercomparison Project (PMIP)’s focus on these times help facilitate studies that examine the effect of carbon dioxide concentration changes on the tropical climate (Table 1).
On the other hand, simulations for the mid-Holocene at 6ka differ from pre-industrial conditions mainly in the orbital parameters that result in an increased insolation in
5
the high latitudes. The tropical region during the mid-Holocene interval might have encountered slightly elevated sea-surface temperatures (SST) of around 1◦C (Gagan et al., 1998), although recent studies indicate some uncertainty in terms of negative SST anomaly for regions such as the western Indian Ocean (Kuhnert et al., 2014). De-spite the limited proxy record agreement on whether tropical oceans may have warmed
10
(Koutavas et al., 2002; Rimbu et al., 2004; Stott et al., 2004), prior PMIP simulations suggest SST in the Northern Hemisphere was generally warmer by less than 1◦C in the mid-Holocene period compared to the pre-industrial era, and the Southern Hemisphere might have been slightly cooler (Braconnot et al., 2007).
Given the lack of data on tropical cyclone frequency for these palaeoclimates, model
15
simulation studies do not seek to verify model response on cyclone formation, but rather aim to describe tropical cyclone trends with the assumption that signals would be detectable by using indicators such as cyclogenesis potential. Using PMIP Phase 2 (PMIP2) data, studies have been conducted to investigate TC genesis activity dur-ing the LGM and mid-Holocene intervals. For the LGM, Korty et al. (2012a) observed
20
higher annual cyclone genesis relative to the pre-industrial era. For the mid-Holocene interval, Korty et al. (2012b) demonstrated that the difference in distribution of the top-of-atmosphere (TOA) radiation in comparison to the pre-industrial control altered the seasonal cycle of potential intensity in the Northern Hemisphere. There was mixed re-sponse in TC genesis for the mid-Holocene relative to the pre-industrial period, with
25
slightly lower TC activity in the Northern Hemisphere (and slightly higher in the South-ern Hemisphere).
CPD
11, 181–220, 2015Tropical cyclone genesis
J. H. Koh and C. M. Brierley
Title Page
Abstract Introduction
Conclusions References
Tables Figures
◭ ◮
◭ ◮
Back Close
Full Screen / Esc
Printer-friendly Version Interactive Discussion
Discussion
P
a
per
|
Discussion
P
a
per
|
Discussion
P
a
per
|
Discussion
P
a
per
|
ensemble (PlioMIP) is included to investigate whether there is a robust response to carbon dioxide concentrations. A further objective is to explore how TC activity in these palaeoclimates, with their equilibrium conditions, relates to that in future simulations.
The various model simulations in this study are described in Sect. 2. The calculation of genesis potential index (GPI) that underpins this study will be presented in Sect. 3
5
of this paper. Section 4 consolidates the results from the GPI analysis of the various palaeoclimates derived from the GCM ensembles. A discussion of how the climate during the Pliocene, LGM and mid-Holocene may affect TC genesis relative to the pre-industrial will be covered in Sect. 5, and the effects of elevated carbon dioxide concentration on TC genesis will also be investigated. Section 6 will summarise the
10
paper’s key findings.
2 Climate simulations
The Pliocene Model Intercomparison Project (PlioMIP), which complements the LGM and the mid-Holocene aspects of the PMIP Phase 3 (PMIP 3), coordinates the ef-forts of various international climate modelling teams to quantify uncertainties in model
15
outputs using the average interglacial conditions of the mid-Piacenzian (hereafter known as Pliocene) climate boundary conditions between 3.29 and 2.97 Ma (Haywood et al., 2011).
Nine coupled climate models participated in PlioMIP (Haywood et al., 2013), al-though only five are analysed here. The GCM selection for this study is largely
de-20
pendent on data availability for the large-scale climatic variables such as the atmo-spheric temperature and humidity profile from the PlioMIP project for the Pliocene Epoch. PMIP3 data for the LGM, mid-Holocene and pre-industrial are taken from the same GCM that is used in the Pliocene simulation, subject to data availability. Where a different GCM from the same model family has to be selected, a pre-industrial control
25
CPD
11, 181–220, 2015Tropical cyclone genesis
J. H. Koh and C. M. Brierley
Title Page
Abstract Introduction
Conclusions References
Tables Figures
◭ ◮
◭ ◮
Back Close
Full Screen / Esc
Printer-friendly Version Interactive Discussion
Discussion
P
a
per
|
Discussion
P
a
per
|
Discussion
P
a
per
|
Discussion
P
a
per
|
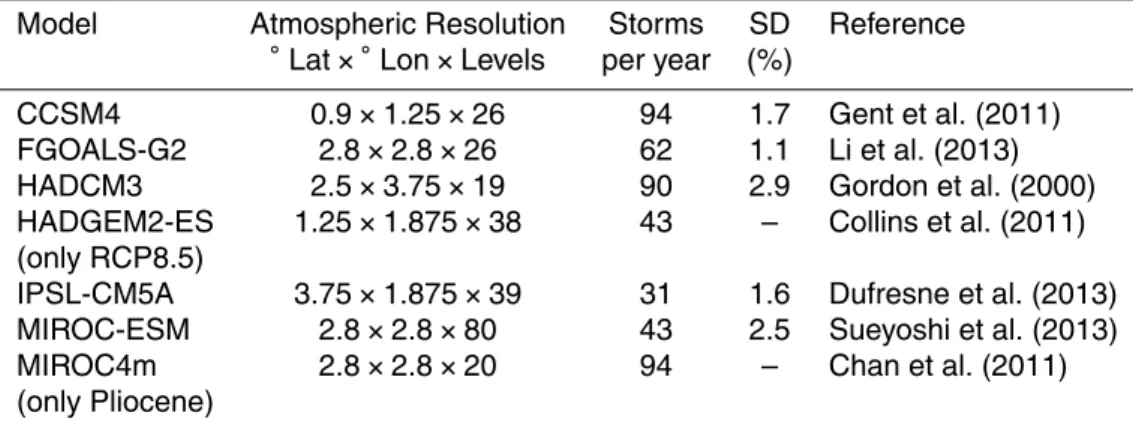
8.5) is likewise analysed as an example future elevated carbon dioxide concentration scenario. The GCMs that have been included for this study are outlined in Table 2.
In situations where a pre-computed monthly climatology of a particular simulation is not available on the Earth System Federation Grid, a 50 year time-slice from the end of the interval of interest is used to generate the monthly climatology data so as to
5
minimise stochastic effects, model drift and internal variability. To estimate the ranges associated with internal variability, ten decadal time-slices are taken from a hundred year dataset of the pre-industrial dataset of each model. The standard deviation (SD) is found to be within 1–3 % of the pre-industrial (PI) TC genesis annual frequencies simulated across the five GCMs (Table 2).
10
3 Genesis potential index
The use of a metric related to genesis potential is particularly useful to describe cy-clogenesis as the grid resolution of most GCMs is not sufficiently refined to simulate mesoscale processes taking place in TCs. Many studies have used genesis potential indices as a less computationally intensive approach to describe TC genesis (Bruyère
15
et al., 2012; Camargo et al., 2007; Emanuel and Nolan, 2004; Korty et al., 2012a, b; Menkes et al., 2012; Tippett et al., 2010).
Gray (1975) pioneered work on the genesis potential index (GPI) by demonstrating the use of selected diagnostics such as mid-troposphere humidity, vertical shear of the horizontal winds between the high and low level troposphere, low level relative
20
vorticity, and thermal parameters related to SST to characterise climatic conditions that are favourable for cyclone genesis. The subsequent GPI improved by Emanuel and Nolan (2004) is considered state-of-the-art (Tippett et al., 2010) and incorporates the potential intensity theory (Emanuel, 1988; Holland, 1997) that evaluates the maximum wind speed that may be attainable using the available thermodynamic energy imparted
25
CPD
11, 181–220, 2015Tropical cyclone genesis
J. H. Koh and C. M. Brierley
Title Page
Abstract Introduction
Conclusions References
Tables Figures
◭ ◮
◭ ◮
Back Close
Full Screen / Esc
Printer-friendly Version Interactive Discussion
Discussion
P
a
per
|
Discussion
P
a
per
|
Discussion
P
a
per
|
Discussion
P
a
per
|
The GPI proposed by Emanuel and Nolan (2004) serves to synergise the thermo-dynamic and kinematic factors affecting TC genesis into a single index. With the aim of facilitating comparison with previous investigations into palaeoclimate cyclone gen-esis, the “clipped vorticity” version of the GPI employed by Korty et al. (2012a, b) has likewise been adopted for this study:
5
GPI=b[min(|η|, 4×10
−5
)]3[max(PI−35, 0)]2
χ
4 3
m[25+Vshear]4
(1)
Here, η represents the absolute vorticity computed at the 850 hPa level (Nolan and Rappin, 2008), Vshear is the 200–850 hPa wind shear value, χm is the moist entropy
deficit. PI is the maximum potential intensity a TC can theoretically achieve (a potential intensity of less than 35 m s−1 would not be classified as a tropical storm). Due to the
10
inherent biases in convection schemes and parameterisations employed by GCMs, the global annual total TC genesis has to be calibrated (Emanuel et al., 2008b). bis therefore an empirically derived normalisation factor that calibrates the GPI to achieve a pre-industrial control annual cyclone genesis frequencies on the order of the roughly eighty storms observed per year in the modern period. Following Korty et al. (2012a,
15
b), a value of 5.55×10⁻⁵is used throughout for the value ofb.
Wind shear and absolute vorticity are the two kinematic factors of the GPI, while potential intensity and moist entropy deficit are both thermodynamic factors (Korty et al., 2012a). Wind shear, which is the vertical shear of the horizontal winds between the upper and lower troposphere, causes asymmetries in the developing cyclone which
20
results in the ventilation of the upper level warm core through the flushing of relatively cooler and drier air from the top (Frank and Ritchie, 2001). Stronger wind shear there-fore influences inflow dynamics and weakens cyclone formation (Riemer et al., 2013). While noting caveats where such two-level vector differentials may be inadequate to describe the resultant wind shear in some scenarios (Velden and Sears, 2014), this
CPD
11, 181–220, 2015Tropical cyclone genesis
J. H. Koh and C. M. Brierley
Title Page
Abstract Introduction
Conclusions References
Tables Figures
◭ ◮
◭ ◮
Back Close
Full Screen / Esc
Printer-friendly Version Interactive Discussion
Discussion
P
a
per
|
Discussion
P
a
per
|
Discussion
P
a
per
|
Discussion
P
a
per
|
study defines the wind shear as the difference between the 200 and 850 hPa winds given its ease of computation.
Meanwhile, the vorticity serves as a spin-up mechanism that initiates cyclone forma-tion in a recirculating flow that is quasi-closed in the lower troposphere. Taking the anal-ogy of a protective pouch, the quasi-closed streamlines surround the enhanced vorticity
5
while nurturing the thermodynamic and convective processes that favour TC develop-ment (Tory et al., 2012). Tippett et al. (2010) observed that vorticity has a greater influence on cyclone formation at lower latitudes, and other factors play a greater role at higher latitudes. Korty et al. (2012a, b) subsequently incorporated a “clipped vortic-ity” diagnosis in place of absolute vorticity in the GPI, so as to moderate its response
10
in over-estimating TC activity for the sub-tropics. Potentially, the clipping threshold may have varied in the past through large-scale changes in the atmosphere circulation. The sensitivity of different clipping thresholds was investigated in the case of the Pliocene period using the MIROC model. Changes in the clipping threshold appear to have little substantive impact on the resulting change in GPI for this study.
15
The non-dimensional term (χm) measures the moist entropy difference between the
mid-troposphere and the boundary layer that is derived from asymmetric cyclone mod-els (Emanuel, 1995b), as shown below:
χm=
sb−sm
s∗o−sb ≡
s∗−sm
so∗−sb (2)
sm, sb and so∗ represent the moist entropies of the mid-troposphere layer,
bound-20
ary layer, and the sea surface saturation entropy respectively. Taking the assump-tion that the lapse rate of the tropical atmosphere is largely moist adiabatic (Emanuel et al., 2008b),s∗which is the saturation entropy above the boundary layer, is assumed to be constant throughout the atmospheric column. This allows the numerator term in Eq. (2) to be evaluated at 600 hPa which is taken to represent the mid-troposphere as
25
defined by Emanuel (1994).sbands∗oare calculated at 925 hPa for the boundary layer
CPD
11, 181–220, 2015Tropical cyclone genesis
J. H. Koh and C. M. Brierley
Title Page
Abstract Introduction
Conclusions References
Tables Figures
◭ ◮
◭ ◮
Back Close
Full Screen / Esc
Printer-friendly Version Interactive Discussion
Discussion
P
a
per
|
Discussion
P
a
per
|
Discussion
P
a
per
|
Discussion
P
a
per
|
needed for an initial perturbation to moisten the middle troposphere before intensifica-tion occurs (Emanuel et al., 2008b).
Taking on the analogy of a cyclone’s evolution process as equivalent to Nature’s Carnot engine (Emanuel, 1988, 1991), the potential intensity diagnostic derived by Bis-ter and Emanuel (1998, 2002) that takes into account the effects of dissipative heating
5
is:
Potential Intensity (PI)=
s
Ck
Cd
SST To
(CAPE∗−CAPEb) (3)
Ck and Cd are the surface exchange coefficients for enthalpy and momentum. Its
ra-tio could range between 0.1 to 1.3 (Montgomery et al., 2010) and is likely between 0.75 and 1.5 for naturally occurring cyclones (Emanuel, 1995a). In this study, a ratio of
10
Ck/Cd=1 is taken to allow for ease of comparison with previous work that used a
sim-ilar assumption (Korty et al., 2012a). To is an entropy-weighted mean temperature of
the outflow. The convective available potential energy (CAPE∗) describes an air parcel of maximum wind intensity that has been earlier saturated at the sea surface, while CAPEb describes a boundary layer air parcel which has been isothermally lowered
15
from an equivalent air parcel of maximum wind intensity. Climate variables that are required for the potential intensity calculation include SST and pressure of the sea sur-face, as well as the humidity and temperature profile of the atmospheric column. The calculation of potential intensity for this study is facilitated by the use of an previously applied algorithm (Emanuel et al., 2008a).
CPD
11, 181–220, 2015Tropical cyclone genesis
J. H. Koh and C. M. Brierley
Title Page
Abstract Introduction
Conclusions References
Tables Figures
◭ ◮
◭ ◮
Back Close
Full Screen / Esc
Printer-friendly Version Interactive Discussion
Discussion
P
a
per
|
Discussion
P
a
per
|
Discussion
P
a
per
|
Discussion
P
a
per
|
4 Results
4.1 Potential intensity
In the tropical region, the Pliocene saw higher SSTs by about 2◦C relative to the pre-industrial control (and the mid-Holocene), while SSTs were lower by about 2◦C at the LGM (Fig. 1). Korty et al. (2012a) suggested that high values of potential intensity,
typ-5
ically higher than 55 m s−1, are needed to induce deep tropospheric convection in TC genesis. Interestingly the locations of the 55 m s−1potential intensity contour appears to be relatively insensitive to these wholesale SST changes. For example, the contour in the North Pacific is associated with SSTs ranging from 26◦C during the Pliocene to 22◦C at the LGM.
10
During the Pliocene, there is a reduction in potential intensity over the North Atlantic, despite an SST increase in the same region (Fig. 1b). This supports research showing that absolute SST by itself can be an inadequate indicator of storm strength (Vecchi et al., 2008). Whilst, this may appear to depart from early understanding of threshold SST values (e.g. 26◦C) in influencing cyclone genesis (Palmen, 1948), it rather
un-15
derscores the importance of other factors, such as atmospheric humidity and upper troposphere outflow temperature relative to the SST, that jointly determine the magni-tude of energy available to a tropical cyclone (Emanuel, 1998).
4.2 Pre-industrial
The pre-industrial serves as a useful reference climate as it is before Earth’s
envi-20
ronment came under substantial anthropogenic influence, especially over the tropical oceans (Lewis and Maslin, 2014). Figure 2 illustrates the genesis potential simulated from the various GCMs in their pre-industrial simulations. The Northern Hemisphere shows cyclone genesis potential for the peak storm periods of July, August, September and October (JASO), while the Southern Hemisphere corresponds to the peak storm
CPD
11, 181–220, 2015Tropical cyclone genesis
J. H. Koh and C. M. Brierley
Title Page
Abstract Introduction
Conclusions References
Tables Figures
◭ ◮
◭ ◮
Back Close
Full Screen / Esc
Printer-friendly Version Interactive Discussion
Discussion
P
a
per
|
Discussion
P
a
per
|
Discussion
P
a
per
|
Discussion
P
a
per
|
period of January, February, March, April (JFMA). Monthly storm genesis will be dis-cussed in Sect. 4.6.
The GPI distribution of the various GCMs compares favourably with the outcomes from similar model analysis by Camargo (2013) for the pre-industrial period, despite the use of different genesis indices. All models simulate cyclone genesis in the eastern
5
and western Pacific in the Northern Hemisphere during JASO, as well as the eastern Pacific near the South Pacific Convergence Zone (SPCZ) during JFMA. Stronger cy-clone genesis in the southern Indian Ocean is found during JFMA, with limited genesis in the northern Indian Ocean during JASO apart from some areas such as the north-ern Bay of Bengal. The North Atlantic features some genesis potential at the deep and
10
sub-tropics, but the South Atlantic shows almost negligible potential for TC genesis. These features are all shown in observations of tropical cyclone genesis (Knapp et al., 2010).
However the various models do show some biases. CCSM4, HadCM3 and IPSL-CM5A-LR exhibit greater intensity of cyclone genesis over the North Pacific and at the
15
SPCZ; as compared to FGOALS-G2 and MIROC-ESM which appear to have a more extensive area of cyclone genesis but with lower intensity. While IPSL-CM5A-LR sug-gests that the central-western Pacific would experience the greatest intensity of cyclone genesis, CCSM4 and HadCM3 show the greatest genesis intensity arising in the north-eastern Pacific. MIROC-ESM simulates its strongest genesis intensity in the maritime
20
continent region. FGOALS-G2 shows a relatively uniform strength of genesis potential across all the oceans, apart from an area of increased intensity in the eastern North Pacific and Philippine Sea. The genesis potential also stretches across a greater area in FGOALS-G2 relative to the other models.
The ensemble mean (Fig. 2f) is obtained by interpolating the individual model GPI
25
CPD
11, 181–220, 2015Tropical cyclone genesis
J. H. Koh and C. M. Brierley
Title Page
Abstract Introduction
Conclusions References
Tables Figures
◭ ◮
◭ ◮
Back Close
Full Screen / Esc
Printer-friendly Version Interactive Discussion
Discussion
P
a
per
|
Discussion
P
a
per
|
Discussion
P
a
per
|
Discussion
P
a
per
|
the highest intensity of genesis potential is located between the 10–20◦ latitude belts of the respective peak storm periods of both hemispheres, and both are of comparable cumulative genesis magnitude of between 3–5 occurrences m−2month−1(not shown). The pre-industrial climate thus exhibits consistency in cyclogenesis between the PMIP3 and PMIP2 simulations (only HadCM3 occurs in both ensembles).
5
4.3 Mid-Holocene
The key difference between the mid-Holocene and pre-industrial climate lies in the changes in solar insolation arising from different angular precession (Table 1). As a result, the Northern Hemisphere receives proportionally greater insolation during its storm season compared to the Southern Hemisphere. The summer and annual
10
mean insolation for the high latitudes in both hemispheres is also increased (Bracon-not et al., 2007).
These insolation changes drive responses in diagnosed cyclogenesis across the five models (Fig. 3). CCSM4 shows the strongest response while the response from MIROC is relatively muted. HadCM3 exhibits a reduction of genesis potential in the
15
Northern Hemisphere compensated for by an increase in the Southern Hemisphere. The response of FGOALS and CCSM bear similarities to each other in that their bands of TC genesis in the North Pacific become more zonal. IPSL and MIROC show little change from the pre-industrial.
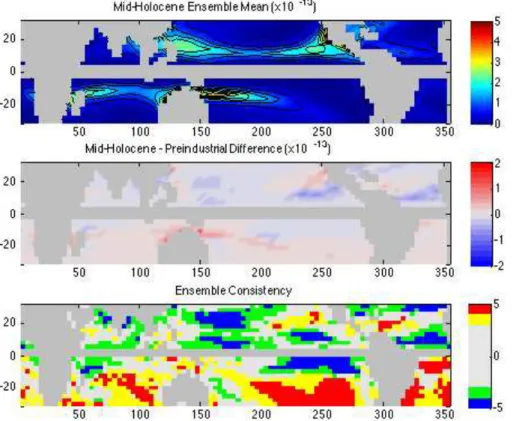
The ensemble genesis potential for the mid-Holocene (Fig. 4a) shares largely similar
20
distribution as the pre-industrial period (Fig. 2), although some localised differences in genesis strength are observed (Fig. 4b). The Southern Hemisphere exhibits a weak change from mid-Holocene over pre-industrial, except for pockets around Northern Australia that show a stronger increase in genesis magnitude. Magnitude changes are more salient in the Northern Hemisphere. A slight decrease in genesis potential is
25
CPD
11, 181–220, 2015Tropical cyclone genesis
J. H. Koh and C. M. Brierley
Title Page
Abstract Introduction
Conclusions References
Tables Figures
◭ ◮
◭ ◮
Back Close
Full Screen / Esc
Printer-friendly Version Interactive Discussion
Discussion
P
a
per
|
Discussion
P
a
per
|
Discussion
P
a
per
|
Discussion
P
a
per
|
There is a good agreement across the ensemble on the sign of the mid-Holocene change in most areas amongst the five GCMs (Fig. 4c). There is a general decrease in cyclone genesis in the Northern Hemisphere, and an increase in cyclone genesis as one moves polewards in the Southern Hemisphere. Although several regions show strong agreement in increased cyclone genesis, such as the South Pacific and South
5
Atlantic, the fact that the increased cyclone genesis are not depicted in Fig. 4b indicates only a very small degree of cyclone genesis increase in these areas.
The results for the mid-Holocene using these PMIP3 models compare well with find-ings from Korty et al. (2012b) that detail cyclone genesis using an ensemble from ten GCMs from PMIP2. The magnitude and distribution of genesis potential share similar
10
patterns across all oceans. Nonetheless this study simulates a slightly weaker gen-esis potential for the western South Indian Ocean and the South Atlantic, as well as a slightly weaker increase in genesis potential for mid-Holocene over pre-industrial in both hemispheres. The model agreement (Fig. 4c) shares remarkable similarity with Korty et al. (2012b) on the sign of change in genesis potential of the mid-Holocene era
15
compared to the pre-industrial period, where the Northern Hemisphere shows a de-crease in genesis potential while the Southern Hemisphere shows general inde-crease in genesis potential, especially in the higher tropical latitudes.
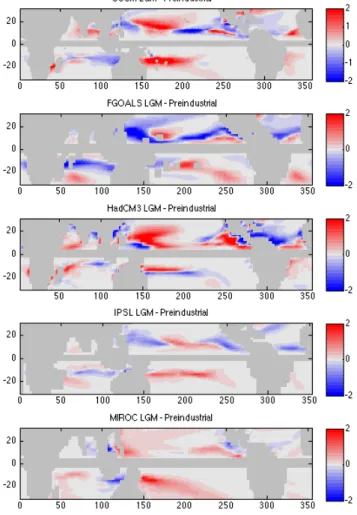
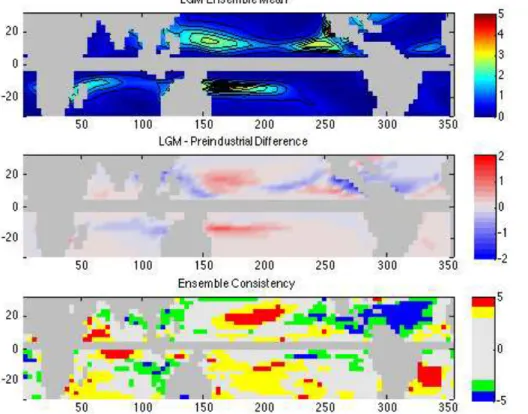
4.4 Last Glacial Maximum (LGM)
During the LGM, the tropics experienced cooling of−5 to−2◦C over land, while most
20
of the tropical surface ocean did not encounter cooling beyond−2◦C especially in the Southern Hemisphere (Waelbrook et al., 2009). The LGM mean tropical SST from the five GCMs in this study during the peak storm period is 2.0◦C cooler than pre-industrial. Simulated genesis potential responses for the LGM appear mixed (Fig. 5). CCSM, HadCM3 and MIROC show generally stronger genesis, while FGOALS and
25
CPD
11, 181–220, 2015Tropical cyclone genesis
J. H. Koh and C. M. Brierley
Title Page
Abstract Introduction
Conclusions References
Tables Figures
◭ ◮
◭ ◮
Back Close
Full Screen / Esc
Printer-friendly Version Interactive Discussion
Discussion
P
a
per
|
Discussion
P
a
per
|
Discussion
P
a
per
|
Discussion
P
a
per
|
The ensemble genesis potential for the LGM (Fig. 6a) shares again, at a first glance, a similar distribution with the pre-industrial. However, it exhibits greater intensity of genesis potential in the central North Pacific and near the SPCZ (Fig. 6b). The central-eastern South Indian Ocean shows decrease in genesis potential along 10◦S, and slight decreases of genesis potential are observed in the North Atlantic, as well as the
5
eastern and western North Pacific
There is some model agreement (Fig. 6c) focussed around the largest changes in genesis potential in the LGM period for most oceans relative to pre-industrial. The North Atlantic exhibits a very robust decrease in genesis potential that spreads over Central America into the eastern North Pacific. This is likely a response to the
impo-10
sition of the Laurentide ice sheet and its impact on the regional circulation. There ap-pears to be a dipole pattern in the Indian Ocean (most noticeable in Fig. 6c), although it is not as robust. This is likely an expression of the alteration in Walker Circulation (DiNezio et al., 2011), whose fidelity varies across models depending on their param-eterisations and boundary conditions (DiNezio and Tierney, 2013). These patterns of
15
the model agreement are qualitatively similar to those seen in the PMIP2 experiments (Korty et al., 2012a).
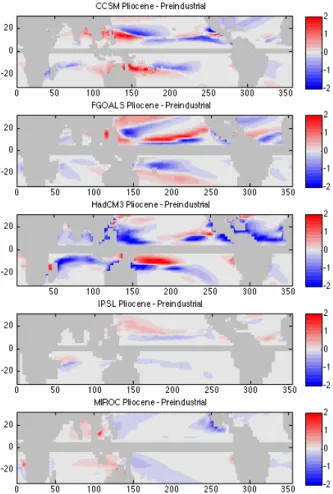
4.5 Pliocene
The Pliocene is a warmer climate compared to pre-industrial (Dowsett et al., 2010; Haywood et al., 2013), with the area-averaged tropical SST from the five GCMs in this
20
study over the peak storm season being 1.7◦C warmer. In terms of the tropical cyclo-genesis difference from pre-industrial (Fig. 7), most models suggest a mixed response in the direction of change for various oceans, apart from MIROC that shows only a lim-ited change. The majority of models indicate a decrease in genesis potential for the North Atlantic and South Indian oceans, and relatively no change in the South Atlantic
25
CPD
11, 181–220, 2015Tropical cyclone genesis
J. H. Koh and C. M. Brierley
Title Page
Abstract Introduction
Conclusions References
Tables Figures
◭ ◮
◭ ◮
Back Close
Full Screen / Esc
Printer-friendly Version Interactive Discussion
Discussion
P
a
per
|
Discussion
P
a
per
|
Discussion
P
a
per
|
Discussion
P
a
per
|
The key areas of Pliocene cyclone genesis in the ensemble mean can be found in the eastern and western areas of the North Pacific, the SPCZ and central region of the South Pacific, as well as the north-western corner of the South Indian Ocean (Fig. 8a). In terms of the difference in genesis potential between the Pliocene and pre-industrial periods (Fig. 8b), the North Atlantic, North Pacific, and South Indian
5
oceans and the SPCZ region would largely experience a decline in genesis during the Pliocene. Nonetheless, there may be localised areas where genesis potential could have increased, such as to the east of New Guinea in the South Pacific.
This large-scale pattern appears to be robust as most models suggest a general decrease in genesis potential for the Pliocene relative to the pre-industrial for most
10
oceans (Fig. 8c), although the magnitude of change might be small in areas such as the South Atlantic and eastern South Pacific. There appears to be weaker model agreement on the sign of change for the subtropical latitudes for the Pacific and Indian oceans in both hemispheres, although a slight increase in genesis potential may be expected.
15
4.6 Genesis frequency
Figure 9 illustrates the annual TC genesis frequency generated from the five GCMs across the various palaeoclimates as a percentage of the pre-industrial. The ensemble-mean annual genesis frequency for the Pliocene, LGM and mid-Holocene are deter-mined to be 91, 97 and 100 % of the pre-industrial respectively.
20
Estimating the natural variability of an ensemble mean number is problematic. As a conservative measure, we take that from the model with the highest internal variabil-ity (HadCM3) that has a SD (σ) of 2.9 %. Given that the ensemble annual frequencies are generally within the standard measure of 2σ (Haywood et al., 2013), the annual genesis frequencies for both the LGM and mid-Holocene is considered to have not
de-25
CPD
11, 181–220, 2015Tropical cyclone genesis
J. H. Koh and C. M. Brierley
Title Page
Abstract Introduction
Conclusions References
Tables Figures
◭ ◮
◭ ◮
Back Close
Full Screen / Esc
Printer-friendly Version Interactive Discussion
Discussion
P
a
per
|
Discussion
P
a
per
|
Discussion
P
a
per
|
Discussion
P
a
per
|
the pre-industrial). The assumption of a Gaussian distribution inherent in this metric of significance is clearly not valid for this ensemble. It is therefore not clear we can consider the reduction seen in Pliocene ensemble as robust feature.
In Fig. 10, the Northern (Southern) Hemisphere peak in JASO (JFMA) appears con-sistent across the various intervals, justifying this study’s choice of the peak storm
5
seasons for the respective hemisphere. Previous work from Korty et al. (2012a, b) us-ing PMIP2 data showed a stronger peak from the Southern Hemisphere relative to the north, while this study suggests a stronger Northern Hemisphere peak. This sug-gests that the PMIP3 simulations may have improved accuracy in describing present day trends of a more conducive Northern Hemisphere for cyclone genesis (Gray, 1968;
10
Klotzbach, 2006; Webster et al., 2005).
The observation of a slight increase in LGM cyclone genesis relative to the pre-industrial period is consistent with earlier work by Korty et al. (2012a). The reduced TC genesis associated with the warm Pliocene conforms to the Knutson et al. (2010) view of future behaviour. It does differ from the sole prior Pliocene TC study (Fedorov
15
et al., 2010). However that work, aimed at the early Pliocene and using a statistical downscaling approach, involved the imposition of a substantially different SST field.
For the mid-Holocene epoch, a salient increase in October activity is observed by Ko-rty et al. (2012b), which has been attributed to a delayed SST response from the TOA insolation forcing, resulting in a shift of the Northern Hemisphere storm season.
How-20
ever, this trend is not observed in this study. Annual SST changes are found to have varied minimally relative to the pre-industrial (Fig. 1), suggesting that the ocean com-ponent during the mid-Holocene may play a lesser role in comparison to the Pliocene and LGM epochs where more substantial SST changes are observed.
5 Discussion
25
CPD
11, 181–220, 2015Tropical cyclone genesis
J. H. Koh and C. M. Brierley
Title Page
Abstract Introduction
Conclusions References
Tables Figures
◭ ◮
◭ ◮
Back Close
Full Screen / Esc
Printer-friendly Version Interactive Discussion
Discussion
P
a
per
|
Discussion
P
a
per
|
Discussion
P
a
per
|
Discussion
P
a
per
|
observed to be relatively insensitive to these changes (Fig. 1). Meanwhile, the annual number of tropical cyclogenesis is likewise found to be fairly consistent across the various palaeoclimates. Despite disagreement about the change of global annual TC frequency (Fig. 9), there is some model consensus on the spatial patterns of tropical cyclogenesis change. These changes may be attributable to changes in large-scale
5
atmospheric properties such as carbon dioxide levels, altered topography and orbital forcing.
The Pliocene represents a sustained interval of elevated carbon dioxide concentra-tion resulting in a warmer climate relative to the pre-industrial period, while the LGM era experienced an opposite cooling effect arising from lower carbon dioxide levels
10
present at that time. Carbon dioxide, being a well-mixed greenhouse gas, causes glob-ally coherent temperature changes in contrast to orbital forcing. In response to the warming during the Pliocene, a general decrease in genesis potential in the Northern Hemisphere and sub-tropical Southern Hemisphere is observed (Fig. 7). The Pliocene simulations have a weaker Hadley and Walker circulation that results in a broadening of
15
the Inter-tropical Convergence Zone (ITCZ; Contoux et al., 2012). Kamae et al. (2011) show that Equatorial specific humidity during the Pliocene increased in the lower tro-posphere and decreased in the mid-trotro-posphere arising from the weakened ascent of the Walker circulation. Convective processes were curtailed and an increase in moist entropy deficit might have weakened the ITCZ. The ITCZ is associated with favourable
20
conditions for TC genesis (Gray, 1968), and the weakened ITCZ is in line with signs of general decrease in TC activity during Pliocene.
The key difference in forcing between the mid-Holocene and pre-industrial lies in the orbital parameters (Table 1). Solar insolation received in the Northern Hemisphere is enhanced relative to the Southern Hemisphere as a result of the altered
preces-25
CPD
11, 181–220, 2015Tropical cyclone genesis
J. H. Koh and C. M. Brierley
Title Page
Abstract Introduction
Conclusions References
Tables Figures
◭ ◮
◭ ◮
Back Close
Full Screen / Esc
Printer-friendly Version Interactive Discussion
Discussion
P
a
per
|
Discussion
P
a
per
|
Discussion
P
a
per
|
Discussion
P
a
per
|
along with slight reduction in the Northern Hemisphere (Fig. 4c). This is associated with higher entropy deficit in the Northern Hemisphere hindering cyclone genesis compared to the Southern Hemisphere (not shown). The potential intensity increases slightly at all latitudes.
5.1 Relationship to future projections
5
Records do not currently exist to either confirm or refute the tropical cyclogenesis changes simulated by this ensemble. They probably never will. Yet the Earth will shortly experience carbon dioxide concentrations beyond those of the Pliocene period. There-fore, it is interesting to consider how the results above correspond to future projections of tropical cyclogenesis. One further motivation to do this is that the palaeoclimate
sim-10
ulations are all equilibrium experiments, whilst the future projections are transient. It is therefore anticipated that the climate change signal will be easier to detect in the palaeoclimate simulations. In transient simulations, large-scale forcings may not fully account for the observed variability (Menkes et al., 2012), as stochastic effects may potentially account for up to half of the observed variability (Jourdain et al., 2010).
15
The RCP8.5 scenario is used to project how TC genesis may develop in future. It is chosen as it is the most extreme scenario and so should have the biggest signal. In this scenario, carbon dioxide concentrations reach 936 ppmv by 2100 (Collins et al., 2013), more than double the level in the Pliocene simulations.
The GCMs selected in this study all show future changes in TC genesis (as
calcu-20
lated by the GPI) under the RCP8.5 transient scenario (Fig. 11). Yet these trends are not consistent between the models. Note that HadCM3 has not contributed results for RCP8.5, so a later generation of the model (HadGEM2) has been substituted. Two models suggest an increase in TC genesis, while three models suggest a decrease, resulting in an ensemble mean with a trend of slightly reduced TC genesis by 2095.
25
CPD
11, 181–220, 2015Tropical cyclone genesis
J. H. Koh and C. M. Brierley
Title Page
Abstract Introduction
Conclusions References
Tables Figures
◭ ◮
◭ ◮
Back Close
Full Screen / Esc
Printer-friendly Version Interactive Discussion
Discussion
P
a
per
|
Discussion
P
a
per
|
Discussion
P
a
per
|
Discussion
P
a
per
|
warm Pliocene and an increase during the LGM: counter-intuitively it also shows an increase under RCP8.5.
Interestingly, the multi-model mean GPI difference between the future RCP8.5 (2071–2100) scenario and historical (1971–2000) simulation from Camargo (2013) shows an opposite response to the difference for the equilibrium Pliocene-control
dif-5
ference in Fig. 8b of this study. The transient RCP8.5 GPI difference in Camargo (2013) suggests a global increase, except for a small area in the central South Pacific where a decrease is expected. Meanwhile the equilibrium Pliocene-pre-industrial difference in this study shows a general decrease, and a small region of the western South Pa-cific has an increase in GPI. The stark difference in cyclogenesis trends between the
10
RCP8.5 and Pliocene therefore throws some questions on the suitability for the choice of the Pliocene as a projection of modern day greenhouse climate, at least in terms of cyclogenesis projections.
Emanuel (2013) downscaled six CMIP5 GCMs for the RCP8.5 projection, and con-cluded that an increase in future global tropical cyclone activity might be expected. The
15
same paper also acknowledged that other modelling groups obtained contrasting re-sults where modest decreases (Knutson et al., 2010) and no robust change (Camargo, 2013) in future tropical cyclone activity had been detected. Two models (CCSM4 and HADGEM2-ES) that Emanuel (2013) used for his RCP8.5 scenario conclusions are also incorporated in this study, but an increasing trend is not detected for the two
par-20
ticular models. Potential reasons that could account for the difference include the use of a modified “clipped” vorticity GPI in this study, and a different choice of 250–850 hPa tropospheric wind shear in Emanuel (2013). The striking difference in TC activity out-comes, despite a similar GCM choice, suggests that the GPI may be highly sensitive to adjustments in diagnostic definition.
25
CPD
11, 181–220, 2015Tropical cyclone genesis
J. H. Koh and C. M. Brierley
Title Page
Abstract Introduction
Conclusions References
Tables Figures
◭ ◮
◭ ◮
Back Close
Full Screen / Esc
Printer-friendly Version Interactive Discussion
Discussion
P
a
per
|
Discussion
P
a
per
|
Discussion
P
a
per
|
Discussion
P
a
per
|
genesis are found largely in the 10–20◦ regions of both hemispheres, with minimum adjustment in the sub-tropics.
6 Conclusions
The global frequency of tropical cyclone formation is estimated to have been rela-tively constant over the range of past climates using a genesis potential index (GPI).
5
This range encompasses both greenhouse (Pliocene) and icehouse (Last Glacial Max-imum) climates and changing orbital forcing. These conditions are thought to represent the extremes of climates Earth has experienced in the past three million years. At times the spread of model estimates of the global, total number of tropical cyclones can be large (Fig. 9), something that is especially noticeable for the Pliocene simulations.
10
The ensemble shows much higher levels of consistency on the regional scale. All five models agree on a reduction in the genesis of the North Atlantic hurricanes at the Last Glacial Maximum; compensated for by an increase in potential cyclogenesis in the central North Pacific, to a greater or lesser degree. Presumably this is a circula-tion response to the existence of a large ice-sheet over North America. A qualitatively
15
similar feature has been seen previously (Korty et al., 2012a), but would obviously not be expected in the reverse in future projections. The mid-Holocene ensemble shows alterations of GPI associated with shifts in the intertropical convergence zone driven by the altered incoming solar distribution. Again the results from this ensemble are qualitatively similar to those from prior model ensembles (Korty et al., 2012b).
20
The tropical cyclone distribution for the mid-Pliocene has not previously been con-sidered. Fedorov et al. (2010) anticipated an expansion of cyclone location, strength and magnitude in response to the observed weakened tropical temperature gradients of the early Pliocene (Brierley et al., 2009). The PlioMIP ensemble of the mid-Pliocene does not show those weakened gradients (Haywood et al., 2013; Brierley, 2014) nor
25
CPD
11, 181–220, 2015Tropical cyclone genesis
J. H. Koh and C. M. Brierley
Title Page
Abstract Introduction
Conclusions References
Tables Figures
◭ ◮
◭ ◮
Back Close
Full Screen / Esc
Printer-friendly Version Interactive Discussion
Discussion
P
a
per
|
Discussion
P
a
per
|
Discussion
P
a
per
|
Discussion
P
a
per
|
One motivation for studying the past climate tropical cyclone response is to inves-tigate its relationship to future projections. The genesis potential under the RCP8.5 scenario was computed and contrasted with the palaeoclimate response. There is no simple relationship that emerges between global tropical cyclogenesis and say CO2 level or hemispheric temperature. This result means that analysis of the changes in
5
total frequency of tropical cyclone remains much less robust than the changes in the regional response noted above. The conclusion is further strengthened by the appar-ent sensitivity of projected future global frequency to the precise genesis potappar-ential index used – with our analysis not fully supporting either the results of Emanuel (2013) nor the opposing results of Camargo (2013) despite all three using the same simulations.
10
Acknowledgements. The work was made possible through a scholarship awarded to J.H. Koh from the Ministry of the Environment and Water Resources, Singapore. The authors thank Suzana J. Camargo for her useful comments on GPI metrics and Kerry Emanuel for his as-sistance, not least his release of the Potential Intensity matlab routine. The assistance of Fran Bragg, Camille Contoux, Wing-Le Chan and Weipeng Zheng was essential to procure the nec-15
essary Pliocene simulation files. The creation of monthly climatologies for the PMIP3 simula-tions by Jean-Yves Peterschmitt was particularly helpful.
References
Annan, J. D. and Hargreaves, J. C.: A new global reconstruction of temperature changes at the Last Glacial Maximum, Clim. Past, 9, 367–376, doi:10.5194/cp-9-367-2013, 2013.
20
Bister, M. and Emanuel, K. A.: Dissipative heating and hurricane intensity, Meteorol. Atmos. Phys., 65, 233–240, 1998.
Bister, M. and Emanuel, K. A.: Low frequency variability of tropical cyclone potential intensity 1. Interannual to interdecadal variability, J. Geophys. Res., 107, 4801, 2002.
Braconnot, P., Otto-Bliesner, B., Harrison, S., Joussaume, S., Peterchmitt, J.-Y., Abe-Ouchi, A., 25
Maxi-CPD
11, 181–220, 2015Tropical cyclone genesis
J. H. Koh and C. M. Brierley
Title Page
Abstract Introduction
Conclusions References
Tables Figures
◭ ◮
◭ ◮
Back Close
Full Screen / Esc
Printer-friendly Version Interactive Discussion
Discussion
P
a
per
|
Discussion
P
a
per
|
Discussion
P
a
per
|
Discussion
P
a
per
|
mum – Part 1: experiments and large-scale features, Clim. Past, 3, 261–277, doi:10.5194/cp-3-261-2007, 2007.
Braconnot, P., Luan, Y., Brewer, S., and Zheng, W.: Impact of Earth’s orbit and freshwater fluxes on Holocene climate mean seasonal cycle and ENSO characteristics, Clim. Dynam., 38, 1081–1092, 2012.
5
Brierley, C. M.: Interannual climate variability seen in the Pliocene Model Intercomparison Project, Clim. Past Discuss., 10, 3787–3820, doi:10.5194/cpd-10-3787-2014, 2014.
Bruyère, C. L., Holland, G. J., and Towler, E.: Investigating the use of a genesis potential index for tropical cyclones in the North Atlantic Basin, J. Climate, 25, 8611–8626, 2012.
Camargo, S. J.: Global and regional aspects of tropical cyclone activity in the CMIP5 models, 10
J. Climate, 26, 9880–9902, 2013.
Camargo, S. J., Sobel, A. H., Barnston, A. G., and Emanuel, K. A.: Tropical cyclone genesis potential index in climate models, Tellus A, 59, 428–443, 2007.
Camargo, S. J., Ting, M., and Kushnir, Y.: Influence of local and remote SST on North Atlantic tropical cyclone potential intensity, Clim. Dynam., 40, 1515–1529, 2013.
15
Chan, W.-L., Abe-Ouchi, A., and Ohgaito, R.: Simulating the mid-Pliocene climate with the MIROC general circulation model: experimental design and initial results, Geosci. Model Dev., 4, 1035–1049, doi:10.5194/gmd-4-1035-2011, 2011.
Collins, M., Knutti, R., Arblaster, J. M., Dufresne, J.-L., Fichefet, T., Friedlingstein, P., Gao, X., Gutowski, W. J., Johns, T. C., Krinner, G., Shongwe, M., Tebaldi, C., Weaver, A. J. and 20
Wehner, M. F.: Long-term climate change: projections, commitments and irreversibility, in: Stocker, T. F., Qin, D., Plattner, G.-K., Tignor, M., Allen, S. K., Boschung, J., Nauels, A., Yu, X., Bex, V. and Midgely, P. M., Climate Change 2013: The Physical Science Basis, Cam-bridge University Press, CamCam-bridge, UK and New York, NY, USA, 1029–1136, 2013.
Collins, W. J., Bellouin, N., Doutriaux-Boucher, M., Gedney, N., Halloran, P., Hinton, T., 25
Hughes, J., Jones, C. D., Joshi, M., Liddicoat, S., Martin, G., O’Connor, F., Rae, J., Senior, C., Sitch, S., Totterdell, I., Wiltshire, A., and Woodward, S.: Development and evaluation of an Earth-System model – HadGEM2, Geosci. Model Dev., 4, 1051–1075, doi:10.5194/gmd-4-1051-2011, 2011.
Contoux, C., Ramstein, G., and Jost, A.: Modelling the mid-Pliocene Warm Period climate with 30
CPD
11, 181–220, 2015Tropical cyclone genesis
J. H. Koh and C. M. Brierley
Title Page
Abstract Introduction
Conclusions References
Tables Figures
◭ ◮
◭ ◮
Back Close
Full Screen / Esc
Printer-friendly Version Interactive Discussion
Discussion
P
a
per
|
Discussion
P
a
per
|
Discussion
P
a
per
|
Discussion
P
a
per
|
DiNezio, P. N. and Tierney, J. E.: The effect of sea level on glacial Indo-Pacific climate, Nat. Geosci., 6, 485–491, doi:10.1038/ngeo1823, 2013.
DiNezio, P. N., Clement, A. C., Vecchi, G. A., Soden, B. J., Broccoli, A. J., Otto-Bliesner, B. L., and Braconnot, P.: The response of the Walker circulation to Last Glacial Maximum forcing: implications for detection in proxies, Paleoceanography, 26, PA3217, 5
doi:10.1029/2010PA002083, 2011.
Dowsett, H. J., Robinson, M. M., Stoll, D. K., and Foley, K. M.: Mid-Piacenzian mean annual sea surface temperature analysis for data-model comparisons, Stratigraphy, 7, 189–198, 2010. Dufresne, J. L., Foujols, M. A., Denvil, S., Caubel, A., Marti, O., Aumont, O., Balkanski, Y.,
Bekki, S., Bellenger, H., Benshila, R., Bony, S., Bopp, L., Braconnot, P., Brockmann, P., Cad-10
ule, P., Cheruy, F., Codron, F., Cozic, A., Cugnet, D., de Noblet, N., Duvel, J. P., Ethé, C., Fair-head, L., Fichefet, T., Flavoni, S., Friedlingstein, P., Grandpeix, J. Y., Guez, L., Guilyardi, E., Hauglustaine, D., Hourdin, F., Idelkadi, A., Ghattas, J., Joussaume, S., Kageyama, M., Krin-ner, G., Labetoulle, S., Lahellec, A., Lefebvre, M. P., Lefevre, F., Levy, C., Li, Z. X., Lloyd, J., Lott, F., Madec, G., Mancip, M., Marchand, M., Masson, S., Meurdesoif, Y., Mignot, J., 15
Musat, I., Parouty, S., Polcher, J., Rio, C., Schulz, M., Swingedouw, D., Szopa, S., Ta-landier, C., Terray, P., Viovy, N., and Vuichard, N.: Climate change projections using the IPSL-CM5 Earth System Model: from CMIP3 to CMIP5, Clim. Dynam., 40, 2123–2165, 2013. Emanuel, K. A.: The maximum intensity of hurricanes, J. Atmos. Sci., 45, 1143–1155, 1988. Emanuel, K. A.: The theory of hurricanes, Annu. Rev. Fluid Mech., 23, 179–196, 1991. 20
Emanuel, K. A.: Atmospheric Convection, Oxford University Press, Oxford, U. K., 1994. Emanuel, K. A.: Potential intensity algorithm, available at: ftp://texmex.mit.edu/pub/emanuel/
TCMAX/, last accessed: 15 April 2014, 1998.
Emanuel, K. A.: Sensitivity of tropical cyclones to surface exchange coefficients and a revised steady-state model incorporating eye dynamics, J. Atmos. Sci., 52, 3969–3976, 1995a. 25
Emanuel, K. A.: The behavior of a simple hurricane model using a convective scheme based on subcloud-layer entropy equilibrium, J. Atmos. Sci., 52, 3960–3968, 1995b.
Emanuel, K. A.: Tropical cyclones, Annu. Rev. Earth Pl. Sc., 31, 75–104, 2003.
Emanuel, K. A.: Downscaling CMIP5 climate models shows increased tropical cyclone activity over the 21st century, P. Natl. Acad. Sci. USA, 110, 12219–12224, 2013.
30
CPD
11, 181–220, 2015Tropical cyclone genesis
J. H. Koh and C. M. Brierley
Title Page
Abstract Introduction
Conclusions References
Tables Figures
◭ ◮
◭ ◮
Back Close
Full Screen / Esc
Printer-friendly Version Interactive Discussion
Discussion
P
a
per
|
Discussion
P
a
per
|
Discussion
P
a
per
|
Discussion
P
a
per
|
Emanuel, K. A., Sundararajan, R., and Williams, J.: Hurricanes and global warming: results from downscaling IPCC AR4 simulations, B. Am. Meteorol. Soc., 89, 347–367, 2008. Fedorov, A. V., Brierley, C. M., and Emanuel, K.: Tropical cyclones and permanent El Niño in
the early Pliocene epoch, Nature, 463, 1066–1070, 2010.
Fedorov, A. V., Brierley, C. M., Lawrence, K. T., Liu, Z., Dekens, P. S., and Ravelo, A. C.: Patterns 5
and mechanisms of early Pliocene warmth, Nature, 496, 43–49, 2013.
Frank, W. M. and Ritchie, E. A.: Effects of vertical wind shear on the intensity and structure of numerically simulated hurricanes, Mon. Weather Rev., 129, 2249–2269, 2001.
Gagan, M. K., Ayliffe, L. K., Hopley, D., Cali, J. A., Mortimer, G. E., Chappell, J., McCul-loch, M. T., and Head, M. J.: Temperature and surface-ocean water balance of the mid-10
Holocene tropical western Pacific, Science, 279, 1014–1018, 1998.
Gent, P. R., Danabasoglu, G., Donner, L. J., Holland, M. M., Hunke, E. C., Jayne, S. R., Lawrence, D. M., Neale, R. B., Rasch, P. J., and Vertenstein, M.: The Community Climate System Model Version 4, J. Climate, 24, 4973–4991, 2011.
Gordon, C., Cooper, C., Senior, C. A., Banks, H., Gregory, J. M., Johns, T. C., Mitchell, J. F. B., 15
and Wood, R. A.: The simulation of SST, sea ice extents and ocean heat transports in a ver-sion of the Hadley Centre coupled model without flux adjustments, Clim. Dynam., 16, 147– 168, 2000.
Gray, W. M.: Global view of the origin of tropical disturbances and storms, Mon. Weather Rev., 96, 669–700, 1968.
20
Gray, W. M.: Tropical Cyclone Genesis in the Western North Pacific, Colorado State University, Fort Collins, Colorado, 1975.
Haywood, A. M., Dowsett, H. J., Valdes, P. J., Lunt, D. J., Francis, J. E., and Sellwood, B. W.: Introduction. Pliocene climate, processes and problems, Philos. T. R. Soc. A, 367, 3–17, 2009.
25
Haywood, A. M., Dowsett, H. J., Robinson, M. M., Stoll, D. K., Dolan, A. M., Lunt, D. J., Otto-Bliesner, B., and Chandler, M. A.: Pliocene Model Intercomparison Project (PlioMIP): exper-imental design and boundary conditions (Experiment 2), Geosci. Model Dev., 4, 571–577, doi:10.5194/gmd-4-571-2011, 2011.
Holland, G. J.: The maximum potential intensity of tropical cyclones, J. Atmos. Sci., 54, 2519– 30
2541, 1997.
Solom-CPD
11, 181–220, 2015Tropical cyclone genesis
J. H. Koh and C. M. Brierley
Title Page
Abstract Introduction
Conclusions References
Tables Figures
◭ ◮
◭ ◮
Back Close
Full Screen / Esc
Printer-friendly Version Interactive Discussion
Discussion
P
a
per
|
Discussion
P
a
per
|
Discussion
P
a
per
|
Discussion
P
a
per
|
ina, O., Villalba, R., and Zhang, D.: Paleoclimate, in: Climate Change 2007: The Physical Science Basis. Contribution of Working Group I to the Fourth Assessment Report of the Intergovernmental Panel on Climate Change, edited by: Solomon, S. et al., Cambridge Uni-versity Press, New York City, 433–498, 2007.
Jourdain, N. C., Marchesiello, P., Menkes, C. E., Lefèvre, J., Vincent, E. M., Lengaigne, M., and 5
Chauvin, F.: Mesoscale simulation of tropical cyclones in the South Pacific: climatology and interannual variability, J. Climate, 24, 3–25, 2010.
Kamae, Y., Ueda, H., and Kitoh, A.: Hadley and Walker circulations in the mid-Pliocene warm period simulated by an atmospheric general circulation model, J. Meteorol. Soc. Jpn., 89, 475–493, 2011.
10
Klotzbach, P. J.: Trends in global tropical cyclone activity over the past twenty years (1986– 2005), Geophys. Res. Lett., 33, L10805, doi:10.1029/2006GL025881 , 2006.
Knapp, K. R., Kruk, M. C., Levinson, D. H., Diamond, H. J., and Neumann, C. J.: The Inter-national Best Track Archive for Climate Stewardship (IBTrACS), B. Am. Meteorol. Soc., 91, 363–376, doi:10.1175/2009BAMS2755.1 , 2010.
15
Knutson, T. R., McBride, J. L., Chan, J., K. Emanuel, Holland, G., Landsea, C., Held, I., Kossin, J. P., Srivastava, A. K., and Sugi, M.: Tropical cyclones and climate change, Nat. Geosci., 3, 157–163, 2010.
Knutson, T. R., Sirutis, J. J., Vecchi, G. A., Garner, S., Zhao, M., Kim, H.-S., Bender, M., Tu-leya, R. E., Held, I. M and Villarini, G.: Dynamical downscaling projections of twenty-first-20
century Atlantic hurricane activity: CMIP3 and CMIP5 model-based scenarios, 26, 6591– 6617, doi:10.1175/JCLI-D-12-00539.1, 2013.
Korty, R. L., Camargo, S. J., and Galewsky, J.: Tropical cyclone genesis factors in simulations of the Last Glacial Maximum, J. Climate, 25, 4348–4365, 2012a.
Korty, R. L., Camargo, S. J., and Galewsky, J.: Variations in tropical cyclone genesis factors in 25
simulations of the Holocene epoch, J. Climate, 25, 8196–8211, 2012b.
Kossin, J. P., Emanuel, K. A., and Vecchi, G. A.: The poleward migration of the location of tropical cyclone maximum intensity, Nature, 509, 349–352, 2014.
Koutavas, A., Lynch-Stieglitz, J., Marchitto, T. M., and Sachs, J. P.: El Nino-like pattern in ice age tropical Pacific sea surface temperature, Science, 297, 226–230, 2002.
30
covari-CPD
11, 181–220, 2015Tropical cyclone genesis
J. H. Koh and C. M. Brierley
Title Page
Abstract Introduction
Conclusions References
Tables Figures
◭ ◮
◭ ◮
Back Close
Full Screen / Esc
Printer-friendly Version Interactive Discussion
Discussion
P
a
per
|
Discussion
P
a
per
|
Discussion
P
a
per
|
Discussion
P
a
per
|
ation with climatic changes in the Indonesian region, Paleoceanography, 29, 423–437, doi:10.1002/2013PA002555 2014.
Lewis, S. and Maslin, M.: Defining humans as a geological power, Nature, in press, 2015. Li, L., Lin, P., Yu, Y., Wang, B., Zhou, T., Liu, L., Liu, J., Bao, Q., Xu, S., Huang, W., Xia, K.,
Pu, Y., Dong, L., Shen, S., Liu, Y., Hu, N., Liu, M., Sun, W., Shi, X., Zheng, W., Wu, B., 5
Song, M., Liu, H., Zhang, X., Wu, G., Xue, W., Huang, X., Yang, G., Song, Z., and Qiao, F.: The flexible global ocean–atmosphere–land system model, grid-point version 2: FGOALS-g2, Adv. Atmos. Sci., 30, 543–560, 2013.
Luan, Y., Braconnot, P., Yu, Y., Zheng, W., and Marti, O.: Early and mid-Holocene climate in the tropical Pacific: seasonal cycle and interannual variability induced by insolation changes, 10
Clim. Past, 8, 1093–1108, doi:10.5194/cp-8-1093-2012, 2012.
Lucas, C., Timbal, B., and Nguyen, H.: The expanding tropics: a critical assessment of the observational and modeling studies, Climate Change, 5, 89–112, 2014.
Menkes, C. E., Lengaigne, M., Marchesiello, P., Jourdain, N. C., Vincent, E. M., Lefèvre, J., Chauvin, F., and Royer, J.-F.: Comparison of tropical cyclogenesis indices on seasonal to 15
interannual timescales, Clim. Dynam., 38, 301–321, 2012.
Montgomery, M. T., Smith, R. K., and Nguyen, S. V.: Sensitivity of tropical-cyclone models to the surface drag coefficient, Q. J. Roy. Meteor. Soc., 136, 1945–1953, 2010.
Nolan, D. S. and Rappin, E. D.: Increased sensitivity of tropical cyclogenesis to wind shear in higher SST environments, Geophys. Res. Lett., 35, L14805, doi:10.1029/2008GL034147, 20
2008.
Pagani, M., Z. Liu, LaRiviere, J., and Ravelo, A. C.: High Earth-system climate sensitivity de-termined from Pliocene carbon dioxide concentrations, Nat. Geosci., 3, 27–30, 2009. Riemer, M., Montgomery, M. T., and Nicholls, M. E.: Further examination of the thermodynamic
modification of the inflow layer of tropical cyclones by vertical wind shear, Atmos. Chem. 25
Phys., 13, 327–346, doi:10.5194/acp-13-327-2013, 2013.
Rimbu, N., Lohmann, G., Lorenz, S. J., Kim, J. H., and Schneider, R. R.: Holocene climate vari-ability as derived from alkenone sea surface temperature and coupled ocean–atmosphere model experiments, Clim. Dynam., 23, 215–227, 2004.
Robinson, M. M., Dowsett, H. J., and Chandler, M. A.: Pliocene role in assessing future climate 30
CPD
11, 181–220, 2015Tropical cyclone genesis
J. H. Koh and C. M. Brierley
Title Page
Abstract Introduction
Conclusions References
Tables Figures
◭ ◮
◭ ◮
Back Close
Full Screen / Esc
Printer-friendly Version Interactive Discussion
Discussion
P
a
per
|
Discussion
P
a
per
|
Discussion
P
a
per
|
Discussion
P
a
per
|
Stott, L., K. Cannariato, Thunell, R., Haug, G. H., Koutavas, A., and Lund, S.: Decline of surface temperature and salinity in the western tropical Pacific Ocean in the Holocene epoch, Nature, 431, 56–59, 2004.
Sueyoshi, T., Ohgaito, R., Yamamoto, A., Chikamoto, M. O., Hajima, T., Okajima, H., Yoshi-mori, M., Abe, M., O’ishi, R., Saito, F., Watanabe, S., Kawamiya, M., and Abe-Ouchi, A.: 5
Set-up of the PMIP3 paleoclimate experiments conducted using an Earth system model, MIROC-ESM, Geosci. Model Dev., 6, 819–836, doi:10.5194/gmd-6-819-2013, 2013.
Tippett, M. K., Camargo, S. J., and Sobel, A. H.: A Poisson regression index for tropical cyclone genesis and the role of large-scale vorticity in genesis, J. Climate, 24, 2335–2357, 2010. Tory, K. J., Dare, R. A., Davidson, N. E., McBride, J. L., and Chand, S. S.: The importance of 10
low-deformation vorticity in tropical cyclone formation, Atmos. Chem. Phys., 13, 2115–2132, doi:10.5194/acp-13-2115-2013, 2013.
Vecchi, G. A., Swanson, K. L., and Soden, B. J.: Whither hurricane activity, Science, 322, 687– 689, doi:10.1126/science.1164396, 2008.
Velden, C. S. and Sears, J.: Computing deep-tropospheric vertical wind shear analyses for 15
tropical cyclone applications: does the methodology matter?, Weather Forecast., 29, 1169– 1180. doi:10.1175/WAF-D-13-00147.1, 2014.
Waelbroeck, C., Paul, A., Kucera, M., Rosell-Melé, A., Weinelt, M., Schneider, R., Mix, A. C., Abelmann, A., Armand, L., Bard, E., Barker, S., Barrows, T. T., Benway, H., Cacho, I., Chen, M.-T., Cortijo, E., Crosta, X., de Vernal, A., Dokken, T., Duprat, J., Elderfield, H., Ey-20
naud, F., Gersonde, R., Hayes, A., Henry, M., Hillaire-Marcel, C., Huang, C.-C., Jansen, E., Juggins, S., Kallel, N., Kiefer, T., Kienast, M., Labeyrie, L., Leclaire, H., Londeix, L., Man-gin, S., Matthiessen, J., Marret, F., Meland, M., Morey, A. E., Mulitza, S., Pflaumann, U., Pisias, N. G., Radi, T., Rochon, A., Rohling, E. J., Sbaffi, L., Sch afer-Neth, C., Solignac, S., Spero, H., Tachikawa, K., and Turon, J.-L.: Constraints on the magnitude and patterns of 25
ocean cooling at the Last Glacial Maximum, Nat. Geosci., 2, 127–132, doi:10.1038/ngeo411, 2009.
CPD
11, 181–220, 2015Tropical cyclone genesis
J. H. Koh and C. M. Brierley
Title Page
Abstract Introduction
Conclusions References
Tables Figures
◭ ◮
◭ ◮
Back Close
Full Screen / Esc
Printer-friendly Version Interactive Discussion
Discussion
P
a
per
|
Discussion
P
a
per
|
Discussion
P
a
per
|
Discussion
P
a
per
|
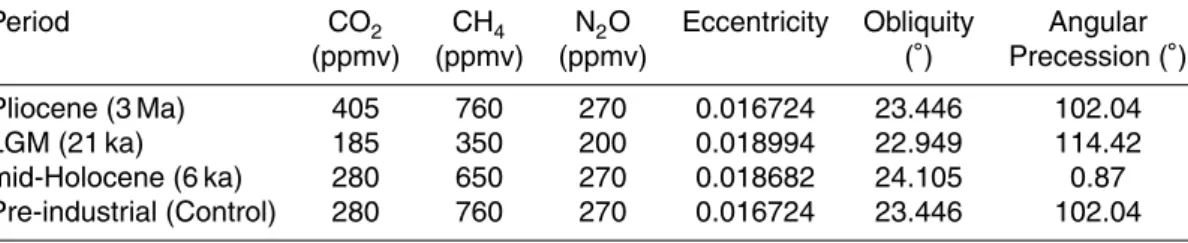
Table 1.Trace gases and Earth’s orbital parameters recommended for PMIP.
Period CO2 CH4 N2O Eccentricity Obliquity Angular (ppmv) (ppmv) (ppmv) (◦) Precession (◦) Pliocene (3 Ma) 405 760 270 0.016724 23.446 102.04
LGM (21 ka) 185 350 200 0.018994 22.949 114.42
CPD
11, 181–220, 2015Tropical cyclone genesis
J. H. Koh and C. M. Brierley
Title Page
Abstract Introduction
Conclusions References
Tables Figures
◭ ◮
◭ ◮
Back Close
Full Screen / Esc
Printer-friendly Version Interactive Discussion
Discussion
P
a
per
|
Discussion
P
a
per
|
Discussion
P
a
per
|
Discussion
P
a
per
|
Table 2.List of GCMs used in this study along with their storm frequency and variability seen
in the pre-industrial simulation.
Model Atmospheric Resolution Storms SD Reference
◦ Lat×◦Lon×Levels per year (%)
CCSM4 0.9×1.25×26 94 1.7 Gent et al. (2011) FGOALS-G2 2.8×2.8×26 62 1.1 Li et al. (2013) HADCM3 2.5×3.75×19 90 2.9 Gordon et al. (2000) HADGEM2-ES 1.25×1.875×38 43 – Collins et al. (2011) (only RCP8.5)