Receptor Activation by Orthosteric and Allosteric
Agonists
Danijela Markovic1¤d, Jonathan Holdich2¤c, Suleiman Al-Sabah3¤a, Rajendra Mistry1, Cornelius Krasel3¤b, Martyn P. Mahaut-Smith1,2*, R. A. John Challiss1*
1Department of Cell Physiology and Pharmacology, University of Leicester, Leicester, United Kingdom,2Department of Physiology, Development & Neuroscience, University of Cambridge, Cambridge, United Kingdom,3School of Pharmacy, University of Reading, Whiteknights, Reading, United Kingdom
Abstract
Background and Objective: Muscarinic acetylcholine receptors (mAChRs) are 7-transmembrane, G protein-coupled receptors that regulate a variety of physiological processes and represent potentially important targets for therapeutic intervention. mAChRs can be stimulated by full and partial orthosteric and allosteric agonists, however the relative abilities of such ligands to induce conformational changes in the receptor remain unclear. To gain further insight into the actions of mAChR agonists, we have developed a fluorescently tagged M1 mAChR that reports ligand-induced conformational
changes in real-time by changes in Fo¨rster resonance energy transfer (FRET).
Methods:Variants of CFP and YFP were inserted into the third intracellular loop and at the end of theC-terminus of the mouse M1mAChR, respectively. The optimized FRET receptor construct (M1-cam5) was expressed stably in HEK293 cells.
Results:The variant CFP/YFP-receptor chimera expressed predominantly at the plasma membrane of HEK293 cells and displayed ligand-binding affinities comparable with those of the wild-type receptor. It also retained an ability to interact with Gaq/11proteins and to stimulate phosphoinositide turnover, ERK1/2 phosphorylation and undergo agonist-dependent internalization. Addition of the full agonist methacholine caused a reversible decrease in M1FRET (FEYFP/FECFP) that was
prevented by atropine pre-addition and showed concentration-dependent amplitude and kinetics. Partial orthosteric agonists, arecoline and pilocarpine, as well as allosteric agonists, AC-42 and 77-LH-28-1, also caused atropine-sensitive decreases in the FRET signal, which were smaller in amplitude and significantly slower in onset compared to those evoked by methacholine.
Conclusion: The M1 FRET-based receptor chimera reports that allosteric and orthosteric agonists induce similar
conformational changes in the third intracellular loop and/orC-terminus, and should prove to be a valuable molecular reagent for pharmacological and structural investigations of M1mAChR activation.
Citation:Markovic D, Holdich J, Al-Sabah S, Mistry R, Krasel C, et al. (2012) FRET-Based Detection of M1Muscarinic Acetylcholine Receptor Activation by
Orthosteric and Allosteric Agonists. PLoS ONE 7(1): e29946. doi:10.1371/journal.pone.0029946
Editor:David Holowka, Cornell University, United States of America
ReceivedAugust 23, 2011;AcceptedDecember 7, 2011;PublishedJanuary 17, 2012
Copyright:ß2012 Markovic et al. This is an open-access article distributed under the terms of the Creative Commons Attribution License, which permits unrestricted use, distribution, and reproduction in any medium, provided the original author and source are credited.
Funding:This research was funded by the European Commission Framework 6 IST Programme (FP-032275) and British Heart Foundation (FS/03/117). The funders had no role in study design, data collection and analysis, decision to publish, or preparation of the manuscript.
Competing Interests:The authors have declared that no competing interests exist.
* E-mail: mpms1@leicester.ac.uk (MPM-S); jc36@leicester.ac.uk (RAJC)
¤a Current address: Department of Pharmacology and Toxicology, Faculty of Medicine, Kuwait University, Safat, Kuwait ¤b Current address: Institut fu¨r Pharmakologie & Toxikologie, Marburg, Germany
¤c Current address: Department of Pharmacology, University of Cambridge, Cambridge, United Kingdom
¤d Current address: Weatherall Institute of Molecular Medicine, University of Oxford, John Radcliffe Hospital, Oxford, United Kingdom
Introduction
Muscarinic acetylcholine receptors (mAChRs) are 7-transmem-brane domain proteins that belong to the rhodopsin family of G protein-coupled receptors (GPCRs). mAChRs are widely distrib-uted and are responsible for the metabotropic effects of acetylcholine. mAChR subtypes are encoded by 5 distinct genes in mammals, referred to as M1–M5. M2and M4mAChR subtypes
couple predominantly through pertussis toxin-sensitive Gi/o
proteins to inhibit adenylyl cyclase, whereas M1, M3 and M5
mAChR subtypes preferentially couple via pertussis toxin-insensitive Gq/11proteins to activate phospholipase C-b, mobilize
intracellular Ca2+
, regulate protein kinase C, and modulate a variety of Ca2+
and K+
-channels [1,2].
and activation of M1–M5 mAChRs by orthosteric ligands is
mediated largely though interactions with a small number of key residues (e.g. Y381 and Q382 in TM6 (numbering refers to M1
receptor) [9]), leading to a relative change in the orientation of TM3 and TM6 of the receptor and a consequent change in the distance between theC-terminus and third intracellular (i3) loop [10].
That mAChRs can bind ligands at a variety of non-orthosteric sites is now well documented [5,6]. Of particular interest is a structurally diverse group of compounds that achieve functionally selective agonism at M1mAChRs though interactions at receptor
binding sites topologically distinct from the acetylcholine binding pocket [11–13]. With respect to AC-42 [14] and 77-LH-28-1 [12], Lebon and colleagues have proposed a novel ‘‘conformational trapping’’ mechanism for activation of the M1mAChR by these
ligands [15]; in contrast,N-desmethylclozapine, another allosteri-cally-acting agonist, and the natural ligand acetylcholine do not employ the same conformational trapping mechanisms to activate the receptor.
In the present study we have investigated ligand-induced conformational changes of M1mAChRs using Fo¨rster resonance
energy transfer (FRET). The binding of an agonist to a GPCR results in conformational changes to the protein, including changes in the relative distance between the third intracellular loop and the
C-terminus of the receptor. This movement can be monitored in real-time in live cells using FRET between CFP and YFP, genetically modified variants of green fluorescent protein (GFP) as introduced by Lohse and colleagues [16,17]. While the CFP/YFP-GPCR chimera is believed to report wild-type CFP/YFP-GPCR conforma-tional change upon agonist binding, its ability to link to G proteins is often abolished. Here, we have developed a M1-FRET biosensor
that retains an ability to signal through its Gq/11-coupled pathway,
and have used this to report conformational change on binding of allosteric and orthosteric agonists.
Materials and Methods
Materials
Dulbecco’s modified Eagle’s medium with GlutaMAX (DMEM), penicillin-streptomycin (pen/strep), G418, fetal bovine serum (FBS), LipofectamineTM2000, restriction enzyme, pcDNA3 and competent E.coli (top tens) were purchased from Invitrogen (Paisley, UK). The source of EYFP and ECFP was pEYFP-C1 and pECFP-C1, respectively (Clontech, California, USA). PCR chemicals were obtained from Promega (Southampton, UK). 77-LH-28-1 and AC-42 were kind gifts from GlaxoSmithKline (Harlow, UK). All other chemicals were purchased from Sigma-Aldrich unless otherwise stated.
Modification of pECFP-C1 and pEYFP-C1
M1mAChRs were tagged with the cerulean mutant of ECFP
(ECFPc) [18], which required three point mutations (S72A/ Y145A/H148D) and an improved version of EYFP, with a single point mutation (F46L) that greatly enhances its fluorescence (referred to as EYFPF46L) [19]. Mutagenesis was performed using the QuikChange point-directed mutagenesis kit (Stratagene, California, USA). The vectors generated are referred to as pECFPc-C1 and pEYFPF46L-C1, respectively.
Isolation of murine M1mAChR and labelling at the C-terminus with EYFPF46L
The care and use of animals in this study was in accordance with the UK Animals (Scientific Procedures) Act 1986 and authorised by the University of Cambridge certificate of
designation (reference no. PCD 80/2802). The investigation also conforms to the Guide for Care and Use of Laboratory Animals US (NIH Publication No. 85-23, revised 1996). Male mice aged between 10 and 24 weeks old were killed by cervical dislocation. The brain was removed and immediately frozen with liquid nitrogen and ground to a fine powder in a mortar and pestle under liquid nitrogen. Total RNA extraction was carried out using a Qiagen RNeasy mini-kit following the manufacturer’s instructions. The required amount of tissue was re-suspended in the accompanying lysis buffer, containing b-mercaptoethanol (final concentration 143 mM) and was homogenized using a glass hand-held homogenizer. The lysate was then passed 10 times through a 21G syringe needle. cDNA was generated from total RNA using a reverse transcription kit, Omniscript (Qiagen, Crawley, UK). The 50mL reaction contained: 16RT buffer, 0.5 mM dNTPs, 25 ng/
mL Oligo-dT and random hexamer primers, 0.5 U/mL Rnasin, 0.2 U/mL Omniscript reverse transcriptase, 2.5mg total RNA, Rnase free water to final volume. The mixture was incubated at 37uC for 1 h. PCR from a mouse cDNA template was used to generate the full-length M1mAChR DNA minus the stop codon
for insertion into a plasmid. The 50mL PCR reaction included: 16 Thermopol buffer, 0.2 mM dNTPs (Bioline Ltd, London, UK), 0.5mM forward primer 59 ATGAACACCTCAGTGC-CCCCTGC39, 0.5mM reverse primer 59 TTAGCATTGGCGG-GAGGGGGTGC39, 0.5 U Vent polymerase and UV-treated milliQ water to 50mL. Amplification was carried out using a Mastercycle gradient thermocycler (Eppendorf UK Ltd., Cambs, UK). The PCR employed an initial denaturation step of 95uC for 3 min followed by 35 cycles of 95uC for 30 sec denaturation, 69uC for 30 sec annealing, 72uC for 2 min extension, and a final single 72uC for 10 min extension then held at 4uC. The product from this PCR was cleaned and used as a PCR template to whichBam HIandEcoR Isticky ends were added. The PCR mixture was as above but with forward primer 59 ATACGGATCCATGAA-CACCTCAGTGCCC39 and reverse primer 59 GTATGAATT-CAAGCATTGGCGGGAGGGGG39. The product was cleaned, digested sequentially with BamHI and EcoRI and ligated into pEYFPF46L-N1. This gave a construct that would express as a murine M1 mAChR to which EYFP
F46L
was attached via a 6 residue linker (LNSADI) after the terminal C460. This construct was named M1-YFP
CT
.
Addition of ECFPc to the third intracellular loop of the M1 mAChR
Using point directed mutagenesis, an Age I restriction site (ACCGGT) was added to the third intracellular loop of M1
-YFPCTin 5 different positions (see Table 1). The modified vectors produced by mutagenesis were digested overnight withAge I. The digested plasmids were run on a 1% agarose gel to remove uncut vector cleaned. Using PCR with peCFPc-N1 as a template and primers forward 59 ATACACCGGTATGGTGAGCAAGGGC-GAGG39 and reverse 59 GTATACCGGTCTTGTACAGCTC-GTCCATGC39, Age Irestriction sites were added to the ends of eCFPc. The PCR product was cleaned, digested overnight with
Age I and ligated into the cut vector with Quick Ligase (NEB, Herts, UK) by incubation for 20 min at room temperature (molar ratio of insert to vector of 5:1). The ligated material was used to directly transform competent E.coli (top tens) according to the manufacturer’s protocol. The resultant plasmids were checked for insert and sequenced. The summary of created constructs is presented in Table 1. For control purposes, constructs equivalent to M1-cam5, but containing onlyC-terminal EYFPF46Lor ECFPc
are referred to as M1-cterm-EYFPF46L and M1-ic3-ECFPc,
respectively.
HEK293 cell culture and transfection with M1mAChR constructs
Complementary DNA of chimeric receptors were transiently expressed in Human embryonic kidney 293 (HEK293) cells (ECACC Cat no. 85120602) using the LipofectamineTM 2000 (Invitrogen) according to manufacturer’s instructions. For gener-ation of HEK293 cell-line stably expressing M1-cam5 mAChR,
the plasmid was transfected using LipofectamineTM2000 reagent (Invitrogen). The cells were grown in DMEM in the presence of 500mg/mL G418 and those that survived were sub-cultured. The
newly established cell-line was termed HEK293-M1-cam5.
N-methyl-[3H]scopolamine binding
N-methyl-[3H]scopolamine ([3H]NMS) inhibition binding as-says were carried out as described previously [20]. Briefly,
HEK293-M1-cam5 cells were seeded at a density of 75,000
cells/well in 24-well plates. After 24 h cells were washed three times with warmed KHB (composition: 118 mM NaCl, 8.5 mM HEPES, 4.7 mM KCl, 4 mM NaHCO3, 1.3 mM CaCl2, 1.2 mM
MgSO4, 1.2 mM KH2PO4, 11.7 mM glucose, pH 7.4) followed
by an incubation on ice in a total assay volume of 1 mL of ice-cold KHB containing various concentrations of agonists and approx. 0.2 nM [3H]NMS. After a 5 h incubation at 4uC cells were washed three times with ice-cold KHB before the addition of 0.1 M NaOH (500mL). After cell solubilization, SafeFluor
scintillation fluid was added, and samples were counted on a scintillation counter.
Total [3H]inositol phosphate accumulation
HEK293-M1-cam5 and HEK293 cells were seeded at 100,000
cells/well in 24-well plates and incubated in fresh medium containing 2.5mCi/mL [3H]inositol for 48 h. The assay was performed as previously described [20].
Table 1.Overview of M1AChR chimeric constructs.
Construct Position of ECFPc Primers
M1-cam1 Between G340and Q341 Forward: CGAGGCGGCAAAGGCACCGGTCAAAAACCCCGAGGG
Reverse: CCCTCGGGGTTTTTGACCGGTGCCTTTGCCGCCTCG
M1-cam2 Between P323and N324 Forward: CCCAAAAGCTCCCCAACCGGTAATACAGTCAAGAGGCC
Reverse: GGCCTCTTGACTGTATTACCGGTTGGGGAGCTTTTGGG
M1-cam3 Between P252and N324 Forward: GCTGAAGGCTCACCCACCGGTAATACAGTCAAGAGG
Reverse: CCTCTTGACTGTATTACCGGTGGGTGAGCCTTCAGC
M1-cam4 Between E242and K362 Forward: AGCAGCAGCTCTGAGACCGGTAAGGCAGCTCGGACC
Reverse: GGTCCGAGCTGCCTTACCGGCTCTTGAGCTGCTGCT
M1-cam5 Between K361and K362 Forward: CTGGTCAAGGAGAGACCGGTAAGGCAGCTCGGACC
Reverse: GGTCCGAGCTGCCTTACCGGTCTTCTCCTTGACCAG
M1-ic3-ECFPc Between K361and K362 Forward: CTGGTCAAGGAGAGACCGGTAAGGCAGCTCGGACC
Reverse: GGTCCGAGCTGCCTTACCGGTCTTCTCCTTGACCAG
Primers used for introducingAgeIsite into the i3 loop are shown where applicable. doi:10.1371/journal.pone.0029946.t001
Figure 1. Cellular localization of M1-cameleons transiently expressed in HEK293 cells.HEK293 cells were transiently transfected with M1 -cam1 (A), M1-cam2 (B), M1-cam3 (C), M1-cam4 (D) or M1-cam5 (E). Images were acquired by confocal microscopy and show fluorescence emission at .530 nm following excitation at 514 nm. Scale bar, 15mm.
ERK1/2 phosphorylation and western blotting
To determine ERK1/2 phosphorylation, the HEK293-M1
-cam5 and HEK293 cells were grown in 12-well plates. The experiments and western blotting were performed as previously described [21]. Proteins were visualized using ECL reagent from GE Healthcare (Chalfont St. Giles, UK). Equal protein loading was confirmed using GAPDH-HPR antibody (1:20,000) (Abcam, Cambridge, UK).
Immunofluorescence confocal microscopy of receptor internalization
Cells were seeded on coverslips coated with 100mg/mL poly-D
-lysine in PBS. When 70–80% confluency was reached, in some instances the cells were treated with various concentrations of agonists at 37uC and fixed with 4% paraformaldehyde. After a 5 min wash with PBS, the slides were mounted with Slowfade Gold/DAPI (Invitrogen, UK). The slides were examined using an Olympus FV500 confocal microscope, ECFPc and EYFPF46Lwere excited via the 458 nm and 515 nm line of the argon laser and emissions were then collected at 480–495 nm and 535–565 nm, respectively. Optical sections (0.5mm) were taken, and represen-tative sections corresponding to the middle of the cells are presented. For each treatment, between 20 and 30 individual cells in three random fields of view were selected and examined. Fluorescence intensity of specific regions of interest (longitudinal
axis) was quantified by using the Measure function of Image J software developed at the National Institutes of Health (http://rsb. info.nih.gov/ij/), as previously described [21]. Briefly, relative quantification of intracellular (internalized) M1-cam5 was deter-mined by measuring the amount of total fluorescence along the longitudinal axis corresponding to the intracellular space (average
Figure 2. Acceptor photobleaching of the three M1mAChR cameleons showing primarily plasma membrane localization.HEK293
cells were transiently transfected with M1-cam1, M1-cam2 or M1-cam5 and imaged by confocal microscopy (458 nm excitation, 470–500 nm emission). Areas of the plasma membrane (delineated by red lines in each image) were bleached using repeated brief exposures to high intensity 514 nm illumination. The graphs show the signal at 458 nm excitation for 470–500 nm emission (ECFPc, cyan line) and.530 nm (EYFPF46Lemission, yellow line), with acceptor photobleach initiated at the arrow. The fluorescence signals from a non-photobleached region were also assessed as a control, which was comparable for all constructs, but only shown for M1-cam1 (area outlined in cyan within the image and fluorescence within the graph for ECFPc (dark blue) and EYFP46L (red)). These findings are representative of photobleaching experiments from at least 3 separate transfections for each construct.
doi:10.1371/journal.pone.0029946.g002
Table 2.Apparent binding affinities (expressed as2logKB
values) for various mAChR agonists and antagonists at the M1
-cam5 AChR, determined by [3H]NMS competition binding.
pKB n
MCh 5.7660.04 4
oxo-M 5.9460.10 3
arecoline 5.0360.03 3
AC-42 5.1160.11 3
77-LH-28-1 6.1760.12 3
atropine 8.6760.09 5
pirenzepine 7.2660.13 5
Data are shown as means6s.e.m. for duplicate determinations in the number of separate experiments (n) indicated.
4–18 ı`m) excluding nucleus. Intracellular fluorescence in cells not treated with the agonist was considered to be basal fluorescence (assigned the value of 1). All other data are normalized to this basal fluorescence level.
Acceptor photobleaching assessment of FRET
Photobleaching of the acceptor fluorophore to assess the level of FRET was performed using a Zeiss LSM 510 attached to an Axiovert 100 (Carl Zeiss, Welwyn Garden City, UK). Photo-bleaching was performed by repeated scanning of a selected area of the cell membrane with the 514 nm laser line at maximum intensity. ECFPc was excited at 458 nm and its emission selected using a 470–500 nm filter, while the EYFPF46L emission was selected using a long pass 530 nm filter. The acquired data was analysed using either Zeiss LSM510 or LSM C4 Toolbox software (written by Dr C.J.Schwiening, University of Cambridge, UK).
FRET measurements
FRET measurements were performed as described previously [22]. Briefly, HEK293 cells grown on coverslips were mounted on a Nikon Eclipse TE2000-S inverted microscope (Nikon) using an ‘‘Attofluor’’ cell chamber (Molecular Probes, Leiden, The Netherlands) and continuously superfused with HBS (150 mM
NaCl, 10 mM HEPES, 10 mM glucose, 2.5 mM KCl, 4 mM CaCl2, 2 mM MgCl2, pH 7.4). Cells were observed using an oil
immersion 636lens, a polychrome V (Till Photonics, Gra¨felfing, Germany) for excitation, and a dual emission photometric system. In order to minimize photobleaching, illumination time was set to 10–40 ms, applied with a frequency of 10 Hz. Fluorescence was measured at 535615 nm (F535) and 4806
20 nm (F480) (beam splitter DCLP 505 nm, Chroma
Technol-ogy, Rockingham, VT, USA) on excitation at 436610 nm (beam splitter DCLP 460 nm, Chroma Technology). The signals were detected by avalanche photodiodes and digitized using an analog/digital converter (Digidata 1322A, Axon Instruments, Union City, CA, USA) and stored on a PC using Axoscope software (Axon Instruments). The experiments were performed at room temperature.
Data analysis
All data are expressed as mean 6 SEM of at least three independent experiments. Radioligand binding data, FRET responses and agonist concentration-response curves were ana-lyzed using Prism 5.0 (GraphPad Software Inc., San Diego, CA). A trace representative of at least three independent experiments is generally shown for FRET data.
Results
Design of M1-cam mAChR FRET conformational sensors An overview of the M1-cameleon receptor constructs is given in
Table 1. In all constructs EYFPF46Lis attached at theC-terminus. In the M1-cam1 mAChR construct, ECFPc is inserted into the i3
loop 25 residues from the predicted cytoplasmic start of the sixth transmembrane (TM6) helix. This design provides a comparable number of residues between the plasma membrane and the fluorophore for both CFP and YFP after accounting for ,12
residues in the C-terminal that are predicted to generate a membrane-aligned helical (H8) region [23]. In the M1-cam2
mAChR, ECFPc is placed a further 17 residues distal to TM6 and most of the third intracellular loop, apart from twenty-two i3 residues immediately proximal to TM5, removed. M1-cam3 is
similar to M1-cam2, but retains forty-two i3 residues below TM5.
In the M1-cam4 construct ECFPc is positioned just 6 residues
below TM6 and the majority of the i3 loop on theN-terminal side of ECFPc removed with 32 residues remaining proximal to TM5. This position was chosen to mimic the successfula2A-adrenoceptor
cameleon (a receptor, like M1, with a relatively large (157 amino
acid) i3 loop) generated by Lohse and colleagues [16,17]. The M1
-cam5 mAChR cameleon is similar to M1-cam4, but the i3 loop is
retained intact, as this domain has been reported to be involved in a number of aspects of mAChR regulation, including receptor trafficking [24–26].
Cellular localization of the constructs
In order to assess the cellular localization of the cameleon receptors, HEK293 cells were transiently transfected with the appropriate cDNA. Confocal microscopy revealed that addition of the EYFPF46Lto theC-terminus of full length M1mAChR did not
affect plasma membrane receptor expression (data not shown). Similar results were obtained when ECFPc was inserted on its own into the i3 loop between K361 and K362 of full length M1
mAChR (data not shown). M1-cam1, -cam2, and -cam5 mAChR
constructs showed good plasma membrane fluorescence with little fluorescence associated with intracellular membranes (Fig. 1A, B, E). The remaining two constructs, M1-cam3 and -cam4 mAChRs
showed little or no plasma membrane expression (Fig. 1C, D). Removal of a large proportion of the M1-i3 loop in both -cam3
and -cam4 chimeras therefore compromises plasma membrane expression.
Assessment of FRET configuration by acceptor photobleaching
In order to determine whether the two fluorophores are close enough to each other and in a correct orientation to generate a detectable FRET signal, we performed acceptor photobleach experiments. Only the three constructs that showed predominantly plasma membrane expression (M1-cam1, -cam2, and -cam5) were
investigated in these experiments. All three chimeras showed an increase in donor fluorescence on photobleach of the acceptor (Fig. 2), suggesting that they all exhibit some degree of FRET under basal (ligand-free) conditions. As a control, we showed that for all three constructs a non-bleached area showed no change in either emission channel observed with illumination at 458 nm (Fig. 2, shown only for M1-cam1). The M1-cam5 receptor showed the
greatest signal changes on bleaching of EYFPF46L, thus this construct was chosen for creation of a stable cell-line, HEK293-M1-cam5.
[3H]NMS radioligand binding
M1 mAChR binding affinities for methacholine (MCh),
oxotremorine-M (oxo-M), AC-42, 77-LH-28-1, arecoline, atropine and pirenzepine were determined by [3H]NMS competition
binding in intact HEK293-M1-cam5 cell monolayers. [ 3
H]NMS saturation binding analysis determined a maximal binding (Bmax)
value of 2.6960.24 pmol mg21 protein and a dissociation constant (KD) of 0.2560.03 nM in HEK293-M1-cam5 cells
(n= 4 independent experiments). HEK293-M1-cam5 cell
mono-layers were incubated with an approximateKDvalue of [3H]NMS
Figure 4. Internalization characteristics of the M1-cam5 mAChR stably expressed in HEK293 cells.HEK293-M1-cam5 cells were treated with various concentration of MCh for 45 min (to assess the concentration-dependency of receptor internalization), or with MCh (300mM) for 0– 60 min (to assess the time-dependency of receptor internalization). Cellular distributions of M1-cam5 mAChR were monitored by confocal microscopy. For quantification of intracellular fluorescence at least 10 individual cells in five random fields of view were examined as described in the Methods section. Data represent means6s.e.m. from three independent experiments.
Figure 5. MCh-induced changes in FRET in HEK293 M1-cam5 cells. HEK293 cells stably expressing M1-cam5 were observed using fluorescence imaging with single wavelength excitation (436 nm) and dual wavelength emission (436 nm to detect ECFPc and 535 nm to detect EYFP46L.A. Representative images showing plasma membrane distribution of ECFPc (480 nm, left panel) and EYFP46L(535 nm, middle panel), which overlap (right panel) as expected for signals from the same population of receptors.B–D, right panels: blue and yellow traces represent signals from ECFP and EYFP, respectively; left panels: red traces represent the FRET signal (ratio of FEYFP/FECFP). Addition of MCh (100mM) induced decreases in FRET, which remained constant throughout the application period (30–40 s;B); this effect was reversed on addition of atropine (1mM;C); and the MCh-induced change in FRET ratio could be completely prevented by pre-addition of atropine (D). FRET data have been normalized so that the initial FRET signal is 100%. Emission traces are expressed as the change in fluorescence intensity from the basal fluorescence level (F/F0). Representative traces of at least three independent experiments are shown.
(,0.3 nM) in the presence of varying agonist concentrations at
4uC for 4 h, or varying antagonist concentrations at 37uC for 45 min. The apparent binding affinities (pKB) for agonists and
antagonists are summarized in Table 2. These data are comparable to affinity values obtained previously for the wild-type M1mAChR receptor, e.g. see [27].
Signalling and internalization properties of the M1-cam5 chimeric receptor
In order to determine if the chimeric receptor retained functional responses, accumulation of [3H]-inositol phosphates
([3H]IPx), ERK1/2 phosphorylation and receptor internalization
have been monitored.
As an index of PLC activation, agonist-stimulated accumulation of total [3H]IPx was assessed in the presence of Li+ (10 mM).
Maximal stimulation with MCh caused an 11-fold increase in [3H]IPxaccumulation (41,95461,030 d.p.m. mg21protein over a
basal value of 3,78161,792 d.p.m. mg21protein) with an EC50of
0.8mM (Fig. 3A). Wild-type HEK293 cells express M3mAChRs
(at approx. 50 fmol mg21 protein) and MCh caused a smaller [3H]IP
xaccumulation in these cells with an EC50.10 fold
right-shifted relative to HEK293-M1-cam5 cells (Fig. 3A). Additionally,
using confocal fluorescence imaging, we demonstrated that MCh (10mM) was able to evoke a detectable translocation of the eGFP-PH biosensor from the plasma membrane to the cytoplasm in HEK293-M1-cam5 cells (but not wild-type HEK293 cells; data
not shown), indicating the hydrolysis of phosphatidylinositol 4,5-bisphosphate and generation of IP3 by M1-cam5 (Fig. 3B). On
removal of agonist, the eGFP-PH biosensor translocated back to the plasma membrane.
MCh treatment (1–300mM for 5 min) of HEK293-M1-cam5
cells resulted in a rapid increase in ERK1/2 phosphorylation; an effect of agonist abolished in cell pre-incubated with atropine (1mM; Fig. 3C). At relatively, low concentrations of MCh (1mM; Fig. 3C) a robust increase in phospho-ERK1/2 was observed in HEK293-M1-cam5, but not wild-type HEK293 cells.
Further-more, the M1-cam5 mAChR internalized in response to MCh in a
concentration- and time-dependent manner (Fig. 4), and recycled back to the plasma membrane on agonist removal (data not shown). Activation of the receptor with another full agonist, oxo-M, or the allosteric agonist AC-42 also resulted in receptor endocytosis (data not shown).
Changes in FRET induced on ligand binding
FRET was assessed using the ratio of normalized EYFPF46L/ ECFPc fluorescence intensities. Addition of MCh (100mM) leads
to a rapid increase in ECFPc emission and decrease in EYFPF46L emission, resulting in a reduction of FRET signal (Fig. 5B). Either washout of MCh or addition of atropine (1mM) reversed the
agonist-induced FRET change (Fig. 5C). The FRET change induced by MCh was completely prevented by pre-incubation with atropine (Fig. 5C). Control experiments with coexpression of M1-3ic-ECFPc and M1-cterm-EYFPF46Lin HEK293 cells showed
no FRET response to MCh (300mM; see Figure S1, Supporting Information). This indicates that the FRET signal detected from M1-cam5 mAChR results from intra-monomer conformational
changes and not from intermolecular FRET in receptor dimers. Stimulation of HEK293-M1-cam5 cells with increasing
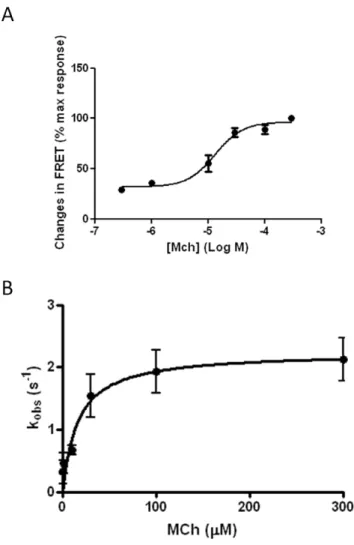
concen-trations of MCh (0.3–300mM; Fig. 6A) resulted in
concentration-dependent changes in FRET, with a maximal FRET decrease of 9.860.4% induced at 300mM MCh. We also assessed the kinetics of MCh-mediated receptor conformational change with time-resolved determinations of the FRET signal recorded from single cells on activation of M1-cam5 mAChR with various
concentra-tions of MCh. Under all experimental condiconcentra-tions, the decrease in FRET signal followed a monophasic decay time-course, as described previously for the parathyroid hormone receptor and a2A-adrenoceptors [16]. As the concentration of MCh was
increased, a faster time-course of FRET decrease was observed (Fig. 6B). The measured rate constant (Kobs) increased across the MCh concentration range, reaching a maximum value at higher MCh concentrations (Fig. 6B).
Next, we investigated the effects of various othosteric partial agonists (arecoline and pilocarpine) and allosteric agonists (AC-42 and 77-LH-28-1) on M1-cam5 mAChR FRET signals. As was
found for MCh, all orthosteric/allosteric agonists caused reduc-tions in intramolecular FRET, which were reversed on addition of atropine (1mM; Fig. 7). Furthermore, pre-addition with either
atropine (1mM) or pirenzepine (10mM) prior to agonist application prevented the FRET changes in all cases (data not shown). The full agonist, MCh, was however more effective in reducing FRET (9.860.4%) than arecoline (7.260.5%),
pilocar-Figure 6. Concentration-dependency and dynamics of MCh-induced FRET changes in HEK293-M1-cam5 cells. A. HEK293 cells
stably expressing M1-cam5 were stimulated with various concentration of MCh (0.3–300mM) as above, and change in FRET ratio recorded. Data represent the means 6 SEM from at least three independent experiments.B. Correlation between the rate constant (Kobs) and MCh concentration was analysed as described in the Methods section. Kobs values were obtained by fitting the FRET data to a single-phase exponential decay. Data represent the means6s.e.m. from at least three independent experiments.
pine (5.960.5%), 77-LH-28-1 (6.460.4%) and AC-42 (5.160.3%) (Fig. 8A). In addition, the rate constant (Kobs) by which MCh induced a FRET decrease was more than two-fold greater than for any of other agonists tested (Fig. 8B).
Discussion
In this study we report on a mouse M1mAChR tagged with two
genetically-encoded fluorescent proteins that allow real-time conformational changes in the receptor to be observed following activation by a number of ligands. The two fluorescent proteins, improved variants of CFP and YFP, were introduced into the i3 loop and theC-terminus, at positions in sufficient apposition for the unliganded receptor to generate a stable FRET signal. On binding of agonist, a decrease in FRET was observed, presumably generated through movement of the i3 domain relative to theC -terminus [10].
Both mouse and human M1 mAChRs have recently been
modified by other groups to incorporate either ECFPc/EYFP [28,29], or CFP/FlAsH (fluorescein arsenical hairpin) [30] pairs into i3/C-terminal domains. In the former example, ECFPc was introduced at theC-terminal and EYFP was inserted into the i3 loop replacing Ala223-Val358 of the wild-type receptor [29]. In the CFP/FlAsH chimeric M1mAChR ECFP was introduced at
theC-terminal, while the FlAsH motif (CCPGCC) was introduced into the i3 loop together with the amino acid sequence between Gly228 and Lys350 being deleted [30]. Thus, in contrast to our M1-cam5 construct, these other chimeras lack the flexible C
-terminal linker sequence (LNSADI) and have differently located sequence insertions into the i3 domain together with substantial deletions from the wild-type M1mAChR.
The location and/or full retention of the i3 domain in M1-cam5
resulted in the receptor exhibiting a full repertoire of cellular responses when stably expressed in HEK293 cells. Thus, on agonist addition phosphoinositide turnover, phosphorylation of ERK1/2 and receptor internalization could all be detected in HEK293-M1-cam5 cells suggesting that this chimeric receptor
retains many of the signalling properties of the wild-type receptor. At present we do not know if, or to what extent, addition of ECFPc and/or EYFPF46Lcompromises receptor function since we did not quantify the relative ability of M1-cam5 to couple to downstream
signals compared to the untagged receptor. Nevertheless, our observations with M1-cam5 contrast with the findings of Jensenet al.[28] who reported that the ECFPc/EYFP mouse M1mAChR
was severely compromised with respect to downstream signalling, a commonly reported deficiency of CFP/YFP-GPCR chimeras [16,31].
The maximum change in FRET observed in HEK293-M1
-cam5 cells following addition of a full agonist was approximately 10%, which is similar or larger in size than the changes observed for CFP/YFP-based detectors incorporated into other family A GPCRs, including the A2Aadenosine (<9%), B2bradykinin (11%)
a2Aadrenoceptor (<6%), and M2mAChR (<6%) [31–34], but
smaller than observed for the family B parathyroid hormone receptor (<20%) [16]. The recently reported CFP/FlAsH
chimeric M1mAChR also exhibited a modest dynamic range of <7% [30], consistent with other reported CFP/FlAsH-GPCR chimeras [31].
An important application of GPCR intramolecular FRET has been to increase our understanding of the conformational changes that can occur following receptor binding of different classes of pharmacological ligand. For example, studies focusing on thea2A Figure 7. FRET changes induced by mAChR orthosteric and allosteric agonists in HEK293-M1-cam5 cells. Addition of arecoline
(A; 300mM), pilocarpine (B; 300mM), 77-LH-28-1 (C; 10mM) and AC-42 (D; 30mM) induced decreases in FRET, which remained constant until reversal by addition of atropine (1mM). FRET data have been normalized so that the initial FRET signal is 100%.
adrenoceptor have provided evidence for conformational and kinetic differences when receptors are occupied by agonists, partial agonists and inverse agonists [16,33,35,36]. We have shown that an M1mAChR chimera (M1-cam5) can be activated by full (MCh)
and partial orthosteric (pilocarpine and arecoline) and allosteric (AC-42 and 77-LH-28-1) agonists. Recent work from the Challiss laboratory investigated the intrinsic efficacies of this set of
compounds using multiple readouts, including receptor-G pro-tein-coupling, activation of phospholipase C and receptor desensitization/internalization [20,27]. This work demonstrated that the allosteric agonists can stimulate M1-Gq/11- and M1-Gs
-dependent signalling; but are less able to promote M1-Gi1/2
-coupling than otherwise equi-efficacious orthosteric agonists [20]. The present study complements this previous work by directly assessing drug-induced real-time conformational change in the M1-cam5 chimera. Orthosteric and allosteric partial agonists all
caused significantly lower maximal changes in M1-cam5 FRET,
which correlated well with previous rankings of these compounds based on efficacy readouts [20]. These data indicate that despite AC42 and 77-LH-28-1 binding at a site on the M1 mAChR
distinct from the orthosterically-acting ligands [12,14,15], the kinetics and extent of conformational changes observed are indistinguishable from those evoked by equi-effective orthosteric partial agonists.
In addition, the rate of conformational change on agonist addition was significantly reduced (by .2-fold) for all partial agonists compared to the full orthosteric agonist, MCh (see Fig. 8). It should be noted that rate of conformational change (Kobs) reported here on M1-cam5 binding to a full agonist is lower
than values recently reported for other M1 mAChR chimeras
[28,30], and indeed other family A GPCRs, including the M2
mAChR [16,34]. The precise reason for this difference is unclear, although it is known that the kinetics of agonist-induced conformational change is influenced by the location of the YFP/ CFP reporter within the i3 loop [36] and by other factors including membrane fluidity and microenvironment [37]. In the case of M1-cam5, the chimera is stably expressed in HEK293
cells and does not contain the i3 deletions seen in other GPCR FRET constructs. Therefore, M1-cam5 is more likely to be
trafficked to specific plasma membrane microenvironments (e.g. lipid rafts) than transiently expressed GPCRs and the rate of conformational change may be constrained by receptor-lipid and/or receptor protein interactions.
In addition to exploring the effects of orthosteric and allosteric agonist interactions with the M1-cam5 chimera, the effects of
atropine and pirenzepine were also assessed. These compounds have been reported to possess inverse agonist activity at a number of mAChR subtypes [38–40]. A previous study clearly demon-strated FRET changes in a CFP/YFP-a2Aadrenoceptor chimera
on addition of inverse agonists, such as yohimbine and rauwolscine. These changes were not only in the opposite direction to that caused by noradrenaline, and also displayed distinct kinetics [35]. While atropine and pirenzepine were able to both prevent and rapidly reverse orthosteric and allosteric agonist-stimulated FRET changes, addition of either agent alone had no effect on the basal M1-cam5 FRET signal. These data can be
interpreted as atropine and pirenzepine lacking sufficient negative efficacy to cause a detectable change in basal M1-cam5 FRET, or
more likely, the M1-cam5 lacks significant constitutive activity and
resides in a ‘locked’, inactive state requiring agonist binding to undergo conformational change.
In conclusion, our data provide evidence that potency and efficacy differences among M1mAChR orthosteric and allosteric
agonists can be quantitatively assessed at the level of the receptor using the M1-cam5 chimeric receptor reported here. Despite the
intramolecular incorporation of two,30 KDa proteins into the
M1mAChR structure the M1-cam5 chimera retains an ability to
link to downstream signal transduction pathways and to traffic into intracellular compartments. This latter property may allow the construct to be used to observe receptor conformational changes that occur within organellar compartments of the cell during
Figure 8. Comparisons of maximal FRET changes and rate constants for a variety of orthosteric and allosteric ligands in HEK293-M1-cam5 cells. Cells were stimulated with a maximally
effective concentration of each agonist and FRET changes (A) and Kobs values (B) were determined as described above. Data are presented as means6s.e.m. from at least three independent experiments. One-way AVOVA (*p,0.05; **p,0.005; ***p,0.0001).
ongoing signalling and receptor processing towards either receptor resensitization or down-regulation.
Supporting Information
Figure S1 The agonist-evoked FRET responses of M1-cam5 do not result from movement of receptors within multimeric assemblies. HEK-293 cells were transiently transfected with either (A) M1-cam5 or (B) two separate plasmids, one encoding M1 with a C-terminal YFPF46Ltag and the other encoding M1 with an ECFPc tag at the same third intracellular loop location as M1-cam5. ECFPc and EYFPF46L fluorescence
and percentage FRET changes were measured as described in the
main methods section. MCh, methacholine. The traces are the average responses from 8 individual cells. In B, all cells used for analysis displayed robust ECFPc and EYFPF46Lfluorescence, thus indicating that both individually tagged M1 receptors were expressed. The traces are representative of responses from two separate transfections.
(TIF)
Author Contributions
Conceived and designed the experiments: DM MPM-S RAJC. Performed the experiments: DM JPH SA-S RM CK. Analyzed the data: DM JPH SA-S RM CK MPM-S RAJC. Wrote the paper: DM MPM-S RAJC.
References
1. Caulfield MP, Birdsall NJ (1998) International Union of Pharmacology XVII. Classification of muscarinic acetylcholine receptors. Pharmacol Rev 50: 279–290.
2. Challiss RAJ, Thomas RL (2009) Signaling diversity mediated by muscarinic acetylcholine receptor subtypes and evidence for functional selectivity. In: Functional selectivity of G protein-coupled receptor ligands Neve KA, ed. Humana Press. pp 125–154.
3. Wess J, Eglen RM, Gautam D (2007) Muscarinic acetylcholine receptors: mutant mice provide new insights for drug development. Nat Rev Drug Discov 6: 721–733.
4. Langmead CJ, Watson J, Reavill C (2008) Muscarinic acetylcholine receptors as CNS drug targets. Pharmacol Ther 117: 232–243.
5. Birdsall NJ, Lazareno S (2005) Allosterism at muscarinic receptors: ligands and mechanisms. Mini Rev Med Chem 5: 523–543.
6. Conn PJ, Jones CK, Lindsley CW (2009) Subtype-selective allosteric modulators of muscarinic receptors for the treatment of CNS disorders. Trends Pharmacol Sci 30: 148–155.
7. Bonner TI, Young AC, Brann MR, Buckley NJ (1988) Cloning and expression of the human and rat m5 muscarinic acetylcholine receptor genes. Neuron 1: 403–410.
8. Lu ZL, Saldanha JW, Hulme EC (2002) Seven-transmembrane receptors: crystals clarify. Trends Pharmacol Sci 23: 140–146.
9. Spalding TA, Burstein ES, Henderson SC, Ducote KR, Brann MR (1998) Identification of a ligand-dependent switch within a muscarinic receptor. J Biol Chem 273: 21563–21568.
10. Hulme EC, Lu ZL, Bee MS (2003) Scanning mutagenesis studies of the M1 muscarinic acetylcholine receptor. Receptors Channels 9: 215–228. 11. Spalding TA, Ma JN, Ott TR, Friberg M, Bajpai A, et al. (2006) Structural
requirements of transmembrane domain 3 for activation by the M1muscarinic receptor agonists AC-42, AC-260584, clozapine, and N-desmethylclozapine: evidence for three distinct modes of receptor activation. Mol Pharmacol 70: 1974–1983.
12. Langmead CJ, Austin NE, Branch CL, Brown JT, Buchanan KA, et al. (2008) Characterization of a CNS penetrant, selective M1muscarinic receptor agonist, 77-LH-28-1. Br J Pharmacol 154: 1104–1115.
13. Marlo JE, Niswender CM, Days EL, Bridges TM, Xiang Y, et al. (2009) Discovery and characterization of novel allosteric potentiators of M1muscarinic receptors reveals multiple modes of activity. Mol Pharmacol 75: 577–588. 14. Spalding TA, Trotter C, Skjaerbaek N, Messier TL, Currier EA, et al. (2002)
Discovery of an ectopic activation site on the M1muscarinic receptor. Mol Pharmacol 61: 1297–1302.
15. Lebon G, Langmead CJ, Tehan BG, Hulme EC (2009) Mutagenic mapping suggests a novel binding mode for selective agonists of M1 muscarinic acetylcholine receptors. Mol Pharmacol 75: 331–341.
16. Vilardaga JP, Bu¨nemann M, Krasel C, Castro M, Lohse MJ (2003) Measurement of the millisecond activation switch of G protein-coupled receptors in living cells. Nat Biotechnol 21: 807–812.
17. Lohse MJ, Nikolaev VO, Hein P, Hoffmann C, Vilardaga JP, et al. (2008) Optical techniques to analyze real-time activation and signaling of G-protein-coupled receptors. Trends Pharmacol Sci 29: 159–165.
18. Rizzo MA, Springer GH, Granada B, Piston DW (2004) An improved cyan fluorescent protein variant useful for FRET. Nat Biotechnol 22: 445–449. 19. Nagai T, Ibata K, Park ES, Kubota M, Mikoshiba K, et al. (2002) A variant of
yellow fluorescent protein with fast and efficient maturation for cell-biological applications. Nat Biotechnol 20: 87–90.
20. Thomas RL, Mistry R, Langmead CJ, Wood MD, Challiss RAJ (2008) G protein coupling and signaling pathway activation by M1 muscarinic acetylcholine receptor orthosteric and allosteric agonists. J Pharmacol Exp Ther 327: 365–374.
21. Markovic D, Punn A, Lehnert H, Grammatopoulos DK (2008) Intracellular mechanisms regulating corticotropin-releasing hormone receptor-2bendocytosis
and interaction with extracellularly regulated kinase 1/2 and p38 mitogen-activated protein kinase signaling cascades. Mol Endocrinol 22: 689–706. 22. Krasel C, Zabel U, Lorenz K, Reiner S, Al-Sabah S, et al. (2008) Dual role of
theb2-adrenergic receptorC-terminus for the binding ofb-arrestin and receptor internalization. J Biol Chem 283: 31840–31848.
23. Kaye RG, Saldanha JW, Lu ZL, Hulme EC (2011) Helix 8 of the M1muscarinic acetylcholine receptor: scanning mutagenesis delineates a G protein recognition site. Mol Pharmacol 79: 701–709.
24. Goldman PS, Schlador ML, Shapiro RA, Nathanson NM (1996) Identification of a region required for subtype-specific agonist-induced sequestration of the m2 muscarinic acetylcholine receptor. J Biol Chem 271: 4215–4222.
25. Shockley MS, Tolbert LM, Tobin AB, Nahorski SR, Sade´e W, et al. (1999) Differential regulation of muscarinic M1 and M3 receptors by a putative phosphorylation domain. Eur J Pharmacol 377: 137–146.
26. Sawyer GW, Ehlert FJ, Shults CA (2008) Cysteine pairs in the third intracellular loop of the muscarinic m1 acetylcholine receptor play a role in agonist-induced internalization. J Pharmacol Exp Ther 324: 196–205.
27. Thomas RL, Mistry R, Langmead CJ, Wood MD, Challiss RAJ (2008) G protein coupling and signaling pathway activation by M1 muscarinic acetylcholine receptor orthosteric and allosteric agonists. J Pharmacol Exp Ther 327: 365–374.
28. Jensen JB, Lyssand JS, Hague C, Hille B (2009) Fluorescence changes reveal kinetic steps of muscarinic receptor-mediated modulation of phosphoinositides and Kv7.2/7.3 K+
channels. J Gen Physiol 133: 347–359.
29. Falkenburger BH, Jensen JB, Hille B (2010) Kinetics of M1muscarinic receptor and G protein signaling to phospholipase C in living cells. J Gen Physiol 135: 81–97.
30. Ziegler N, Ba¨tz J, Zabel U, Lohse MJ, Hoffmann C (2011) FRET-based sensors for the human M1-, M3-, and M5-acetylcholine receptors. Bioorg Med Chem 19: 1048–1054.
31. Hoffmann C, Gaietta G, Bu¨nemann M, Adams SR, Oberdorff-Maass S, et al. (2005) A FlAsH-based FRET approach to determine G protein-coupled receptor activation in living cells. Nat Methods 2: 171–176.
32. Chachisvilis M, Zhang YL, Frangos JA (2006) G protein-coupled receptors sense fluid shear stress in endothelial cells. Proc Natl Acad Sci USA 103: 15463–15468.
33. Nikolaev VO, Hoffmann C, Bu¨nemann M, Lohse MJ, Vilardaga JP (2006) Molecular basis of partial agonism at the neurotransmitter a2A-adrenergic receptor and Gi-protein heterotrimer. J Biol Chem 281: 24506–24511. 34. Maier-Peuschel M, Fro¨lich N, Dees C, Hommers LG, Hoffmann C, et al. (2010)
A fluorescence resonance energy transfer-based M2muscarinic receptor sensor reveals rapid kinetics of allosteric modulation. J Biol Chem 285: 8793–8800. 35. Vilardaga JP, Steinmeyer R, Harms GS, Lohse MJ (2005) Molecular basis of
inverse agonism in a G protein-coupled receptor. Nat Chem Biol 1: 25–28. 36. Zu¨rn A, Zabel U, Vilardaga JP, Schindelin H, Lohse MJ, et al. (2009)
Fluorescence resonance energy transfer analysis of a2A-adrenergic receptor activation reveals distinct agonist-specific conformational changes. Mol Phar-macol 75: 534–541.
37. Zhang YL, Frangos JA, Chachisvilis M (2009) Mechanical stimulus alters conformation of type 1 parathyroid hormone receptor in bone cells. Am J Physiol 296: C1391–C1399.
38. Daeffler L, Schmidlin F, Gies JP, Landry Y (1999) Inverse agonist activity of pirenzepine at M2muscarinic acetylcholine receptors. Br J Pharmacol 126: 1246–1252.
39. Nelson CP, Nahorski SR, Challiss RAJ (2006) Constitutive activity and inverse agonism at the M2muscarinic acetylcholine receptor. J Pharmacol Exp Ther 316: 279–288.

![Table 2. Apparent binding affinities (expressed as 2 log K B values) for various mAChR agonists and antagonists at the M 1 -cam5 AChR, determined by [ 3 H]NMS competition binding.](https://thumb-eu.123doks.com/thumbv2/123dok_br/18337447.351588/4.918.86.828.96.535/apparent-binding-affinities-expressed-agonists-antagonists-determined-competition.webp)
![Figure 3. Signal transduction characteristics of M 1 -cam5 mAChR. A. Concentration-dependent [ 3 H]IP x accumulation in wild-type HEK293 (%) or HEK293-M1-cam5 ( N ) cells stimulated by oxo-M in the presence of 10 mM LiCl](https://thumb-eu.123doks.com/thumbv2/123dok_br/18337447.351588/5.918.95.625.477.947/figure-transduction-characteristics-concentration-dependent-accumulation-stimulated-presence.webp)