ACPD
11, 22199–22245, 2011Short-lived brominated species
S. Brinckmann et al.
Title Page
Abstract Introduction
Conclusions References
Tables Figures
◭ ◮
◭ ◮
Back Close
Full Screen / Esc
Printer-friendly Version Interactive Discussion
Discussion
P
a
per
|
Dis
cussion
P
a
per
|
Discussion
P
a
per
|
Discussio
n
P
a
per
|
Atmos. Chem. Phys. Discuss., 11, 22199–22245, 2011 www.atmos-chem-phys-discuss.net/11/22199/2011/ doi:10.5194/acpd-11-22199-2011
© Author(s) 2011. CC Attribution 3.0 License.
Atmospheric Chemistry and Physics Discussions
This discussion paper is/has been under review for the journal Atmospheric Chemistry and Physics (ACP). Please refer to the corresponding final paper in ACP if available.
Short-lived brominated species –
observations in the source regions and
the tropical tropopause layer
S. Brinckmann1, A. Engel1, H. B ¨onisch1, B. Quack2, and E. Atlas3
1
Institute for Atmospheric and Environmental Sciences, Universit ¨at Frankfurt/Main, Germany 2
Leibniz-Institut f ¨ur Meereswissenschaften, Universit ¨at Kiel, Germany 3
Rosenstiel School of Marine and Atmospheric Science, University of Miami, USA
Received: 7 June 2011 – Accepted: 11 July 2011 – Published: 5 August 2011
Correspondence to: S. Brinckmann (s.brinckmann@iau.uni-frankfurt.de)
Published by Copernicus Publications on behalf of the European Geosciences Union.
ACPD
11, 22199–22245, 2011Short-lived brominated species
S. Brinckmann et al.
Title Page
Abstract Introduction
Conclusions References
Tables Figures
◭ ◮
◭ ◮
Back Close
Full Screen / Esc
Printer-friendly Version Interactive Discussion
Discussion
P
a
per
|
Dis
cussion
P
a
per
|
Discussion
P
a
per
|
Discussio
n
P
a
per
|
Abstract
We conducted measurements of up to the five important short-lived brominated species in the marine boundary layer (MBL) of the mid-latitudes (List/Sylt, North Sea) in June 2009 and of the tropical Western Pacific during the TransBrom ship campaign in October 2009. For the one-week time series in List mean mixing ratios of 2.0, 1.1, 5
0.2, 0.1 ppt were analysed for CHBr3, CH2Br2, CHBr2Cl and CH2BrCl, with maxima of
5.8 and 1.6 ppt for the two main components CHBr3and CH2Br2. Along the cruise track in the Western Pacific (between 41◦N and 13◦S) mean mixing ratios of 1.0, 0.9, 0.2, 0.1 and 0.1 ppt for CHBr3, CH2Br2, CHBrCl2, CHBr2Cl and CH2BrCl were determined.
Air samples with coastal influence showed considerably higher mixing ratios than the 10
samples with open ocean origin. Correlation analyses of the two datasets yielded strong linear relationships between the mixing ratios of four of the five species (except for CH2BrCl). Using a combined dataset from the two campaigns, rough estimates
of the molar emission ratios between the correlated substances were derived as fol-lows: 9/1/0.3/0.3 for CHBr3/CH2Br2/CHBrCl2/CHBr2Cl. Additional measurements were
15
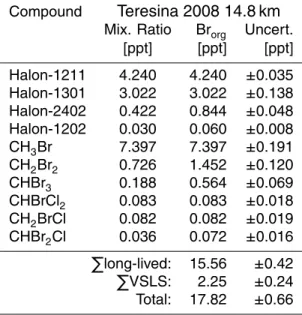
made in the tropical tropopause layer (TTL) above Teresina (Brazil, 5.07◦S, 42.87◦W) in June 2008, using balloon-borne cryogenic whole air sampling technique. Near the level of zero clear-sky net radiative heating (LZRH) at 14.8 km about 2.25 ppt organic bromine was bound to the five short-lived species, making up 13 % of total organic bromine (17.82 ppt). CH2Br2(1.45 ppt) and CHBr3(0.56 ppt) accounted for 90 % of the 20
budget of short-lived compounds in that region. Near the tropopause (at 17.5 km) or-ganic bromine from short-lived substances was reduced to 1.35 ppt, with 1.07 ppt and 0.12 ppt attributed to CH2Br2and CHBr3respectively.
1 Introduction
Reactive halogens, especially chlorine and bromine compounds, contribute to the de-25
composition of stratospheric ozone. In addition to mainly anthropogenic long-lived source gases like chlorofluorocarbons (CFC), chlorocarbons or bromofluorocarbons
ACPD
11, 22199–22245, 2011Short-lived brominated species
S. Brinckmann et al.
Title Page
Abstract Introduction
Conclusions References
Tables Figures
◭ ◮
◭ ◮
Back Close
Full Screen / Esc
Printer-friendly Version Interactive Discussion
Discussion
P
a
per
|
Dis
cussion
P
a
per
|
Discussion
P
a
per
|
Discussio
n
P
a
per
|
(called halons) other substances with atmospheric lifetimes shorter than six months, often referred to as very short-lived substances (VSLS), have the potential to trans-port halogen in significant abundances into the stratosphere. Especially for the strato-spheric bromine budget a significant impact is expected from these VSLS species, whose sources are predominantly natural. Bromoform (CHBr3), dibromomethane 5
(CH2Br2) and the three polyhalogenated species CHBr2Cl, CHBrCl2 and CH2BrCl
have been identified as the most important short-lived carriers of atmospheric bromine. Highest concentrations of brominated VSLS are usually found in coastal regions, which is commonly attributed to emissions from macroalgae (Montzka et al., 2011). Typically lower values have been measured above the open ocean (e.g. Quack and Wallace, 10
2003), except for certain upwelling regions (e.g. Class and Ballschmiter, 1988; Quack et al., 2004; Carpenter et al., 2007), where a high activity of phytoplankton is expected to account for strong emissions of these bromocarbons. Several studies (e.g. Yokouchi et al., 2005; O’Brien et al., 2009) have found good correlations for at least three of the brominated VSLS (CHBr3, CH2Br2 and CHBr2Cl), which indicates the same sources
15
and the presence of typical emission ratios between these compounds.
There is a large uncertainty about the amount of bromine transported into the strato-sphere by the brominated VSLS. Very few measurements of these species in the en-trance region to the stratosphere have been published so far (e.g. Schauffler et al., 1999; Laube et al., 2008; Liang et al., 2010). Based on these available source gas 20
data in the TTL and the results from modeling studies concerning the transport of these gases and their degradation products into the stratosphere, Montzka et al. (2011) have determined a range between 1 and 8 ppt stratospheric inorganic bromine (Bry) from VSLS. Stratospheric measurements of BrO (one of the main products resulting from the degradation of the VSLS) by Dorf et al. (2006) have indicated values of about 3– 25
7 ppt Bry that could be attributed to this additional input from VSLS. As the variability of the source gas concentrations is indicated to be high in the TTL and the additional transport by brominated product gases can not be directly quantified at present, the de-termination of the related global transport through the TTL is a difficult issue. Several
ACPD
11, 22199–22245, 2011Short-lived brominated species
S. Brinckmann et al.
Title Page
Abstract Introduction
Conclusions References
Tables Figures
◭ ◮
◭ ◮
Back Close
Full Screen / Esc
Printer-friendly Version Interactive Discussion
Discussion
P
a
per
|
Dis
cussion
P
a
per
|
Discussion
P
a
per
|
Discussio
n
P
a
per
|
studies emphasise the importance of certain regions, in particular the Western Pacific region, on the transport of VSLS from the source areas to the TTL (Gettelman et al., 2002; Fueglistaler et al., 2004; Aschmann et al., 2009). These observations under-line the necessity and importance of VSLS measurements in the MBL and the TTL of these specific regions for the improvement of the quantitative understanding of the 5
troposphere-to-stratosphere transport of bromine from VSLS.
2 Measurements
2.1 Sampling and analysis
In June 2009 we performed a one-week air sampling campaign in List on Sylt (North Sea, 55.02◦N, 8.43◦E, 2 m a.s.l.). Using two-litre electropolished stainless steel can-10
isters, 46 air samples were collected between 22 June 18:00 UTC and 29 June 09:00 UTC, with a time resolution of three hours (except for a break between 21:00 and 03:00 at night). The sampling was carried out over a free grass area in about 100 m distance to the eastern coast of Sylt. At first the evacuated canisters were opened and flushed with ambient air for about 20 s. Using a reciprocating pump, the canisters 15
were afterwards filled to a pressure of approximately 2.5 bar. About one week after the sampling, the air samples were analysed at the IAU (Institut f ¨ur Atmosph ¨are und Umwelt) Frankfurt using an Agilent-7890 GC-MSD (Gas Chromatography with Mass Spectrometric Detection) system in EI (Electron impact Ionisation) mode. We obtained mixing ratio time series for four of the brominated VSLS: CH2Br2, CHBr3, CHBr2Cl and
20
CH2BrCl.
From the TransBrom measurement campaign aboard the research vessel “Sonne” in the Western Pacific during October 2009 we obtained a set of 23 air samples, col-lected along the cruise track in latitudes between 41◦N and 13◦S. The track of the ship and the coordinates of the samplings are illustrated in Fig. 1. The sampling started 25
near the northern coast of the Japanese main island Honshu and ended about 300 km
ACPD
11, 22199–22245, 2011Short-lived brominated species
S. Brinckmann et al.
Title Page
Abstract Introduction
Conclusions References
Tables Figures
◭ ◮
◭ ◮
Back Close
Full Screen / Esc
Printer-friendly Version Interactive Discussion
Discussion
P
a
per
|
Dis
cussion
P
a
per
|
Discussion
P
a
per
|
Discussio
n
P
a
per
|
southeast of the coast of Papua New Guinea. For the storage of the air samples two-litre electropolished stainless steel canisters of the same type as applied during the List campaign were used. Using a metal bellows pump the canisters were flushed five times before being filled to the final sample pressure of 2 bar. The air samples were collected two times per day, at around 11:00 and 23:00 UTC (21:00 and 09:00 local 5
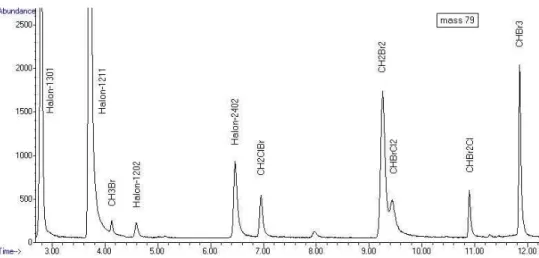
time), during the last three days only one sampling per day (at 23:00 UTC) was carried out. The measurements were conducted on 14 January 2010 at the IAU using the aforementioned GC-MSD system in NCI (Negative ion Chemical Ionisation) mode. By the choice of the NCI mode instead of the EI mode we could achieve a very precise analysis at very low detection limits of all five brominated VSLS. Figure 2 shows a NCI 10
chromtogram for bromine ion mass 79 as obtained during the TransBrom measure-ments.
During the same campaign in the Western Pacific an additional set of air samples was collected using 2.3-l electropolished stainless steel canisters. The sampling proce-dure was the same as described above for the TransBrom IAU dataset. The measure-15
ments were conducted at the University of Miami using a HP 5971 GC/MSD system in EI mode (see Schauffler et al. (1999) for a detailed description). A dataset of 73 sam-ples with mixing ratios for three of the five brominated VSLS (CH2Br2, CHBr2Cl, CHBr3)
covering the whole track between Japan and Australia could be obtained. In this work we will shortly discuss how these data compare to the IAU dataset. Furthermore, this 20
additional dataset will be considered for the analysis concerning the finding of typical emission ratios (Sect. 4.2). A detailed presentation of these time series analysed at Miami focusing on a source analysis will be given in a study by K. Kr ¨uger (personal communication, 2011).
In May and early June 2008 our group participated in a balloon campaign in Teresina 25
(Brazil), located in the tropics at 5.07◦
S, 42.87◦
W. The balloon carrying the whole air sampler BONBON-I (see Schmidt et al., 1987) was launched on 1 June 2008 by the French Space Agency CNES (Centre National d’ ´Etudes Spatiales). We collected two samples in the TTL, at altitudes of 14.8 and 17.5 km. The laboratory analyses were
ACPD
11, 22199–22245, 2011Short-lived brominated species
S. Brinckmann et al.
Title Page
Abstract Introduction
Conclusions References
Tables Figures
◭ ◮
◭ ◮
Back Close
Full Screen / Esc
Printer-friendly Version Interactive Discussion
Discussion
P
a
per
|
Dis
cussion
P
a
per
|
Discussion
P
a
per
|
Discussio
n
P
a
per
|
conducted in July and August of the same year on the Agilent-7890 GC-MSD system using both detector modes EI and NCI. We obtained mixing ratios for the complete spectrum of brominated species, the long-lived and the VSLS.
2.2 Sample stability
For the canisters used during List and TransBrom we performed experiments aiming at 5
the investigation of possible concentration drifts of bromocarbons after longer periods of storage in the canisters. These tests indicated stronger declines of the mixing ratios for some of the VSLS, especially CHBr3, when dry air samples were stored. In case of samples with typical tropospheric H2O mixing ratios a good stability for all measured
compounds was observed over the considered period of five months. 10
The storage of dry stratospheric air samples in the canisters of the whole air sam-pler BONBON-I is also indicated to be problematic for some of the shorter-lived bro-mocarbons. A repeated measurement of the two TTL samples (using EI mode only) one year after the initial analysis revealed concentration decreases for CH3Br, CH2Br2 and CHBr3, with highest reductions (to about 30 % relative to the initial measurement)
15
for CHBr3. For the temporal stability of CHBr2Cl and CHBrCl2no conclusions could be
drawn from this experiment, as the unfavourable EI mode did not allow a peak detection of these species. So, the results of the repeated measurement of the two stratospheric air samples imply that the outcomes from the initial analysis could underestimate the real mixing ratios at the sampling. This issue will be discussed in Sect. 5.1.
20
2.3 Scale uncertainties
For the bromine budget presented in Sect. 5.1 we determined total uncertainties of the analysed mixing ratios. This calculation was done similarly to the description given by Laube et al. (2008). Considered are statistical errors during the measurements and the systematic error of the calibration scale of the primary standard. For the two statis-25
tical errors we used the 1σmeasurement precision of the comparative measurements,
ACPD
11, 22199–22245, 2011Short-lived brominated species
S. Brinckmann et al.
Title Page
Abstract Introduction
Conclusions References
Tables Figures
◭ ◮
◭ ◮
Back Close
Full Screen / Esc
Printer-friendly Version Interactive Discussion
Discussion
P
a
per
|
Dis
cussion
P
a
per
|
Discussion
P
a
per
|
Discussio
n
P
a
per
|
for the calibration scale uncertainties the corresponding values specified by the NOAA were applied, which are 3.3 % for halon-1301, 0.2 % for halon-1211, 1.1 % for CH3Br,
6.3 % for CH2Br2and 8.3 % for CHBr3. For halon-1202, halon-2402, CH2BrCl, CHBrCl2
and CHBr2Cl we used a calibration based on comparative measurements of our pri-mary standard gas with a calibration standard at the university of East Anglia (UEA), 5
for which we assumed relatively high systematic errors of 5 % for halon-2402, 10 % for halon-1202 and 20 % for the three polyhalogenated compounds in the overall un-certainty calculations. Possible temporal drifts of the substances in the canisters, as indicated by the experiment described in Sect. 2.2, were not considered in these cal-culations.
10
3 Observations source regions
Table 1 shows the statistical summary of the data of the four investigated brominated VSLS, as analysed for the 46 air samples from List. CHBr3is by far the most abundant of the four gases, with an average of 2.02 ppt, while CH2Br2exhibits a mean of 1.07 ppt.
The values for the two species lie on the lower end of the range of means reported for 15
other coastal regions (compare e.g. Zhou et al., 2008; Carpenter et al., 2005). Average and variability of CHBr3are considerably enhanced by a high concentration event with
two elevated values (up to 5.8 ppt) on 25 June. The two polyhalogenated compounds are relatively low-concentrated, especially CH2BrCl with an estimated average of only 0.10 ppt. Some of the signals of the latter compound are below the detection limit of 20
about 0.08 ppt. These data were included into the summary by assuming a uniform mixing ratio of 0.07 ppt – a value well matching the lowest CH2BrCl mixing ratios
mea-sured during TransBrom (see below) and also justified considering its relatively long lifetime of 137 days (under average tropospheric conditions, Montzka et al., 2011). The corresponding time series of the four species are shown in Fig. 3. CH2Br2 (panel A,
25
solid circles, left-hand scale) and CHBr3 (same graph, open circles, right-hand scale) exhibit very similar variance patterns with mixing ratios peaking on 25 June at 03:00
ACPD
11, 22199–22245, 2011Short-lived brominated species
S. Brinckmann et al.
Title Page
Abstract Introduction
Conclusions References
Tables Figures
◭ ◮
◭ ◮
Back Close
Full Screen / Esc
Printer-friendly Version Interactive Discussion
Discussion
P
a
per
|
Dis
cussion
P
a
per
|
Discussion
P
a
per
|
Discussio
n
P
a
per
|
and 06:00 UTC. A qualitatively similar curve is also found for CHBr2Cl (B, solid circles, left-hand scale), while CH2BrCl (same graph, open circles, right-hand scale) – for which
we could not obtain results from the first eight canisters due to technical problems – exhibits an independent variability strongly affected by the low measurement precision. Backward air mass trajectory analyses (shown in Fig. 9) reveal that air masses origi-5
nated in the beginning from the North Sea (exemplary for 24 June, displayed on panel 1). The high concentration event on 25 June (panel 2) marks a change in the catch-ment area from the North Sea to the Baltic Sea. For the following time period until the end of the series the air masses passed over the Baltic Sea in an easterly stream before arriving at List (exemplary for 29 June, panel 3).
10
The mixing ratios of the five important brominated VSLS as analysed for the Trans-Brom air samples, are illustrated in Fig. 4. CH2Br2(panel A, solid circles) and CHBr3
(same panel, open circles) revealed relatively low mixing ratios above open ocean ar-eas, around 0.8 ppt for CH2Br2 and around 0.6 ppt for CHBr3, while higher values of 1.0–1.2 ppt for CH2Br2 and 1.2–2.1 ppt for CHBr3 were detected near the Japanese
15
coast (at 41◦N) and in the vicinity of the islands of Papua New Guinea (at 10◦S and 13◦
S). These observations are consistent with a strong influence from coastal sources and relatively weak emissions in open ocean areas. The corresponding backward tra-jectories, displayed in Fig. 10, confirm a slowly decreasing coastal influence at the be-ginning of the cruise, as the winds persistently transported air masses from the North 20
(exemplarily shown on panel 1 for 32◦N). Between 0◦N and 20◦N typically easterly to northerly winds advected air from open ocean regions, as shown on panel 2. For the air samples collected between 6◦
S and 13◦
S (panel 3, 6◦
S) air masses arrived from the Southeast, after passing through a region with larger islands in the Solomon Sea. The observation of relatively low concentrations above most of the open ocean regions is 25
in agreement with other studies (e.g. Quack and Wallace, 2003; Yokouchi et al., 2005). Considerably elevated mixing ratios, as reported by Atlas et al. (1993) for upwelling regions in the equatorial Eastern Pacific, are not present in our data. This is consis-tent with an absence of such upwelling zones associated with high biogenic activity in
ACPD
11, 22199–22245, 2011Short-lived brominated species
S. Brinckmann et al.
Title Page
Abstract Introduction
Conclusions References
Tables Figures
◭ ◮
◭ ◮
Back Close
Full Screen / Esc
Printer-friendly Version Interactive Discussion
Discussion
P
a
per
|
Dis
cussion
P
a
per
|
Discussion
P
a
per
|
Discussio
n
P
a
per
|
the Western Pacific. Similar profiles, with elevated values near the coastlines, were analysed for CHBrCl2(Fig. 4, panel B, solid black circles) and CHBr2Cl (same panel,
open circles). In contrast to the four aforementioned substances, CH2BrCl (same
panel, grey circles) showed mixing ratio profiles with independent variance structures, in agreement with our observations at List.
5
A comparison with the air samples analysed at the University of Miami (UM, not shown in the graphs) reveals in total good agreement with our measurements, es-pecially for CHBr3 and CHBr2Cl. A slight gap between the data is apparent for the
CH2Br2, with around 20 % higher values for the UM dataset, while the patterns of
vari-ation match very well. Confirming the findings from the IAU data, the higher spatial 10
resolution of the samples also does not reveal any high-concentration events above the open ocean. Further elevated mixing ratios which were observed during the begin-ning and the end of the cruise, but not covered by the IAU data, will be analysed in a study by K. Kr ¨uger (personal communication, 2011).
In Table 2 a summary for the datasets from the IAU Frankfurt is shown. CHBr3 is
15
on average the most abundant compound analysed for this set of air samples, with a mean mixing ratio of 1.03 ppt and a range from 0.44 to 2.16 ppt. As noted above, the higher values were detected for samples with coastal influence, while the open ocean measurements show considerably lower mixing ratios. When excluding all samples with trajectories passing through regions with larger islands, we find an average of 20
only 0.62 ppt for CHBr3. Considering the whole data, CH2Br2 exhibits an average
of 0.93 ppt and a range between 0.69 and 1.21 ppt. For the limited set of samples without coastal influence we obtain an average of 0.83 ppt for this substance. Thus, for the open ocean samples CH2Br2was usually higher concentrated than CHBr3, which
can be explained by the combination of its relatively longer lifetime and the absence 25
of emissions. The three polyhalogenated compounds reveal average mixing ratios of 0.10, 0.21 and 0.14 ppt (for CH2BrCl, CHBrCl2 and CHBr2Cl respectively). The
corresponding open ocean values of 0.09, 0.17 and 0.11 ppt (in the above order) are also lower compared to those with coastal influence.
ACPD
11, 22199–22245, 2011Short-lived brominated species
S. Brinckmann et al.
Title Page
Abstract Introduction
Conclusions References
Tables Figures
◭ ◮
◭ ◮
Back Close
Full Screen / Esc
Printer-friendly Version Interactive Discussion
Discussion
P
a
per
|
Dis
cussion
P
a
per
|
Discussion
P
a
per
|
Discussio
n
P
a
per
|
4 Regression analyses
In the following sections we present different regression analyses carried out to inves-tigate possible relationships between the observed mixing ratios of brominated VSLS. Several previous studies reported linear relationships between the concentrations of CHBr3, CH2Br2and CHBr2Cl (e.g. O’Brien et al., 2009; Yokouchi et al., 2005),
indicat-5
ing that very similar or the same sources contribute to the atmospheric concentrations of these substances. Li et al. (1994) suggested the additional possibility that reac-tions of CHBr3with seawater chlorine could produce CHBr2Cl and thus account for the
observed correlations to this compound.
4.1 Linear regression 10
Using the orthogonal distance regression (ODR) – which considers the distances in x- and y-direction rather than only the deviations on the y-axis – we calculated linear fits and the related coefficients of determination for the different species with respect to CHBr3. Figure 5 displays the results for CH2Br2 and CHBr2Cl as analysed for the List data. Confirming the aforementioned studies, the three compounds exhibit good 15
correlations, with determination coefficients of 0.89 and 0.73 for CH2Br2versus CHBr3
and CHBr2Cl versus CHBr3, respectively. The corresponding plot for the TransBrom IAU data, shown in Fig. 6 (panel A), also demonstrates strong linear relationships for the three compounds. The coefficients of determination reach very high values of 0.91 and 0.97 for the two correlations. One outlying data point for CHBr2Cl (encircled in 20
the graph) was excluded from the calculations. It is apparent that for some of the samples with coastal influence (visible especially in the UM dataset, see analysis and discussion in Sect. 4.2.2) the CHBr2Cl mixing ratios show an increase that does not match the changes of CH2Br2 and CHBr3, considering its atmospheric lifetime lying
between the two other species. This could be an indication for additional CHBr2Cl
25
emissions from an independent source.
ACPD
11, 22199–22245, 2011Short-lived brominated species
S. Brinckmann et al.
Title Page
Abstract Introduction
Conclusions References
Tables Figures
◭ ◮
◭ ◮
Back Close
Full Screen / Esc
Printer-friendly Version Interactive Discussion
Discussion
P
a
per
|
Dis
cussion
P
a
per
|
Discussion
P
a
per
|
Discussio
n
P
a
per
|
The lower graph B in Fig. 6 shows the linear regression for CHBrCl2and CH2BrCl, both versus CHBr3 again, as analysed for the TransBrom IAU data. We find a high
correlation of CHBrCl2to CHBr3(withR 2
=0.87), while for CH2BrCl only a weak
rela-tionship to CHBr3is indicated (R2=0.42). A former study in the Arctic boundary layer at Alert (CAN) also revealed a significant correlation of CHBrCl2to CHBr3and CHBr2Cl
5
(Li et al., 1994). Corresponding analyses of the UM datasets for CHBr3, CH2Br2 and
CHBr2Cl confirm the above findings of a strong linear relationship between the three species. The results of these calculations and the regression analyses of the two other datasets discussed above are listed in Tables 3, 4 and 5.
Summarising the results of the linear regression analyses, it can be noted that for four 10
of the five brominated VSLS (CH2Br2, CHBr3, CHBr2Cl and CHBrCl2) significant linear
relationships are found. Very few of the samples collected during TransBrom suggest additional independent emissions for CHBr2Cl, while for CH2BrCl a dominance of inde-pendent sources is indicated by both datasets. The presence of high correlations im-plies that the related species are emitted from the same sources in typical quantitative 15
ratios. The determination of these emission ratios can help to predict the distributions of the related species, if the concentrations of one substance are well characterised.
4.2 Emission ratios
4.2.1 Theoretical considerations
A very intuitive approach to derive emission ratios from the data of well correlated 20
compounds with identical sources is the use of plots of, for example, [CH2Br2]/[CHBr3]
versus [CHBr3]. This analysis is expected to show an increase of the ratio [CH2Br2]/[CHBr3] for decreasing CHBr3 concentrations, due to the following reasons:
a stronger mixing with background air always tends to enhance the [CH2Br2]/[CHBr3]
ratio, as this photochemically aged air exhibits relatively lower concentrations of the 25
shorter-lived compound CHBr3. In addition, the stronger degradation of CHBr3
rela-tive to CH2Br2(especially by photolysis) also directly enhances this ratio when longer
ACPD
11, 22199–22245, 2011Short-lived brominated species
S. Brinckmann et al.
Title Page
Abstract Introduction
Conclusions References
Tables Figures
◭ ◮
◭ ◮
Back Close
Full Screen / Esc
Printer-friendly Version Interactive Discussion
Discussion
P
a
per
|
Dis
cussion
P
a
per
|
Discussion
P
a
per
|
Discussio
n
P
a
per
|
transport times occur. The smallest measured ratio in such a graph should give an estimate of the emission ratio, since these data reflect samples with minimal impact from mixing and decomposition.
For a similar analysis of three well correlated compounds with assumed constant emission ratios a plot of for example [CHBr3]/[CH2Br2] versus [CHBr2Cl]/[CH2Br2] can 5
be produced. Following McKeen and Liu (1993) a “dilution line” and a “chemical de-cay line”, both departing from the point of the initial ratios at the time of the emission, should enclose the scattered data. The dilution line illustrates the relationship between the data for the case that the considered air parcels are mixed with background air, without chemical decay processes taking place. The temporal change in the concen-10
tration of speciesX due to dilution is then determined by the mixing coefficientc, its concentration [X] and its background concentration [X]b:
d[X]
d t =−c·([X]−[X]b) (1)
Under the assumption of relatively small background concentrations of the two shorter-lived species ([X]≫[X]
band [Y]≫[Y]b), in our case CHBr3and CHBr2Cl, and a
con-15
stant mixing coefficientc, the dilution or relative concentration change∆[X]/[X] after a given time interval∆twill be equal for the two shorter-lived substances. Thus the re-sulting dilution line (for [X]/[Z] versus [Y]/[Z]) has a slope of 1 on a double-logarithmic scale.
The chemical decay line describes the relationship between the concentrations of 20
the three compounds when changes in [X], [Y] and [Z] are exclusively governed by chemical decomposition by a pseudo-first-order chemical reaction with the loss rates
LX,LY andLZ:
d[X]
d t =−LX·[X] (2)
The loss rates are determined by the OH reaction rate coefficient, the OH concentration 25
ACPD
11, 22199–22245, 2011Short-lived brominated species
S. Brinckmann et al.
Title Page
Abstract Introduction
Conclusions References
Tables Figures
◭ ◮
◭ ◮
Back Close
Full Screen / Esc
Printer-friendly Version Interactive Discussion
Discussion
P
a
per
|
Dis
cussion
P
a
per
|
Discussion
P
a
per
|
Discussio
n
P
a
per
|
the reciprocal of their local lifetimes 1/τ and solving the differential equations for the concentrations of the three species X, Y, Z, a linear relationship can be derived for [Y]/[Z] versus [X]/[Z] on a log-log scale representing the chemical decay line. The associated slopem is determined by the three lifetimes (Roberts et al., 1984; Parrish et al., 1992; McKeen and Liu, 1993):
5
m=1/τy
−1/τ z
1/τx−1/τz
(3)
McKeen and Liu (1993) have used a mesoscale model to predict the concentrations of three hydrocarbons with different lifetimes and emission rates in specific ratios. They show that under realistic conditions essentially all observed ratios between the three species are expected to lie between the two lines, even if one of the two processes, 10
chemical decay or dilution with background air, is excluded completely. This is due to processes ignored during the derivation of these lines, i.e. mixing processes with non-background air and mixing of two parcels characterised by different photochemical ages.
Many studies (e.g. Carpenter et al., 2003; Zhou et al., 2008) directly used the lin-15
ear correlation analysis between the mixing ratios of e.g. CH2Br2 and CHBr3 to infer
information on their emission ratios. It can be shown that under certain conditions the slope of such a regression line is a good estimate for the initial concentration ratio. In case of a pure dilution – an approximation valid for measurements in close proximity to the sources – the initial concentration of substanceX, denoted as [X]0, decreases
20
due to mixing with ambient air that exhibits a certain background concentration [X]b
as described by Eq. (1). This equation can be transformed and integrated to obtain an exponential expression for the temporal change of the concentrations [X] and [Y]. Assuming again a constant mixing coefficientc(being equal for both compounds), the exponential term can be eliminated to obtain an equation for [Y] depending on [X]. 25
[Y]= [Y]0
−[Y]b
[X]0−[X]b
·[X]+[Y]b−[X]b·[Y]0 −[Y]b
[X]0−[X]b
(4)
ACPD
11, 22199–22245, 2011Short-lived brominated species
S. Brinckmann et al.
Title Page
Abstract Introduction
Conclusions References
Tables Figures
◭ ◮
◭ ◮
Back Close
Full Screen / Esc
Printer-friendly Version Interactive Discussion
Discussion
P
a
per
|
Dis
cussion
P
a
per
|
Discussion
P
a
per
|
Discussio
n
P
a
per
|
It can be seen that the slope of this linear relationship will be equal to the initial concen-tration ratio [Y]0/[X]0(thus to the relative emission rates) if the background concentra-tions of the two substances [X]band [Y]bare small compared to [X]0and [Y]0or if their
ratios to the initial concentrations are approximately equal ([X]b/[X]0≃[Y]b/[Y]0), as
expected for the case of similar lifetimes. In the general case of significant background 5
concentrations and differing lifetimes, as for e.g. CH2Br2 versus CHBr3, the slope of
the regression line will deviate from the initial concentration ratio.
The opposite scenario of measurements taken at a larger distance from the regions of emission may be treated with a pure chemical decay according to a pseudo first-order process, as given in Eq. (2). Similarly to the steps above, the differential equa-10
tions can be solved for the two speciesX andY and the time eliminated to obtain the following two equivalent expressions:
ln[Y] [X]=
τ x τy −1
ln[X]+
ln[Y]0− τx τyln[X]0
(5)
[Y]= [Y]0
[X] τx τy
0 ·[X]
τx
τy (6)
Thus, for a plot of the natural logarithm of the ratio [Y]/[X] versus the natural logarithm 15
of [X] the slope of the corresponding regression line is determined by the lifetimesτx
and τy. The relationship [Y]([X]) is generally nonlinear, with a shape depending on the initial concentration ratio, the ratio of the lifetimes and the concentration [X]. An analysis of Eq (6) shows that the slope from a linear regression can deviate positively (in case of photochemically young air samples) or negatively (in case of considerably 20
aged air) from the real ratio of e.g. [CHBr3]0/[CH2Br2]0. If the lifetimes of the two con-sidered species are similar, function (6) will reduce to a nearly linear curve of the same form as is valid for a dilution with the constraints of zero background concentrations. Thus, a corresponding analysis of [CHBr2Cl] versus [CH2Br2] or [CHBr3] is less
sensi-tive (compared to [CH2Br2] versus [CHBr3]) to the photochemical age of the considered 25
ACPD
11, 22199–22245, 2011Short-lived brominated species
S. Brinckmann et al.
Title Page
Abstract Introduction
Conclusions References
Tables Figures
◭ ◮
◭ ◮
Back Close
Full Screen / Esc
Printer-friendly Version Interactive Discussion
Discussion
P
a
per
|
Dis
cussion
P
a
per
|
Discussion
P
a
per
|
Discussio
n
P
a
per
|
air masses, and the slope of the regression line yields a relatively stable estimate of the emission ratio. The same conclusions can be drawn for the scenario of a pure dilution: A mixing under consideration of realistic background values leads to relatively smaller deviations in the slope from the case with zero background if the lifetime differences are also relatively smaller.
5
4.2.2 Analyses and discussion
The linear regression for the List dataset yields a slope of 0.14 for CH2Br2 versus CHBr3. This value is in good agreement with other published data from coastal
mid-latitude sites, as the 0.15 determined for measurements at Mace Head (Carpenter et al., 2003) and 0.14 derived from measurements in the seacoast region of New Hamp-10
shire (Zhou et al., 2008). The results for the TransBrom IAU data indicate a higher slope of 0.25 for the two species, which can be explained by a stronger impact of chemical decay on the concentration ratios. Following Carpenter et al. (2003) a cor-relation according to Eq. (5) was investigated to evaluate the impact from degradation processes. The results of these analyses for CH2Br2and CHBr3, the two species with
15
the largest lifetime difference, are displayed in Fig. 7. The correlations for the three datasets (List, TransBrom IAU, TransBrom UM) are very strong, with determination co-efficients between 0.97 and 0.98. According to Eq. (5) the slopes correspond to lifetime ratiosτCHBr3/τCH2Br2 of 0.32, 0.27 and 0.28 for List, TransBrom IAU and TransBrom UM
respectively. The lifetime values published by Hossaini et al. (2010) (CHBr3: 16 days,
20
CH2Br2: 52 days, for the near-surface tropics) and Montzka et al. (2011) (CHBr3: 24
days, CH2Br2: 123 days, for average tropospheric conditions) would correspond to lifetime ratios of 0.31 and 0.20 respectively. Our findings agree very well with these bounds, which is, in combination with the strength of the correlations, a good indication that degradation processes had a strong impact on the analysed distributions of the 25
brominated compounds in List and above the Western Pacific. In a reverse conclusion the relationship between [CH2Br2] and [CHBr3] is expected to follow a non-linear
func-tion according to Eq. (6) so that the slope of the corresponding regression line alters with the photochemical age of the considered air parcels.
ACPD
11, 22199–22245, 2011Short-lived brominated species
S. Brinckmann et al.
Title Page
Abstract Introduction
Conclusions References
Tables Figures
◭ ◮
◭ ◮
Back Close
Full Screen / Esc
Printer-friendly Version Interactive Discussion
Discussion
P
a
per
|
Dis
cussion
P
a
per
|
Discussion
P
a
per
|
Discussio
n
P
a
per
|
Regarding the results for CHBr2Cl, we obtain very similar slopes of 0.23 and 0.24 (versus CH2Br2, see Tables 3 and 4) for List and TransBrom IAU. As discussed in
the previous section, the possible deviations of the slope values from the emission ratio are relatively smaller compared to the findings for CH2Br2 versus CHBr3, since the lifetime ratio of CHBr2Cl to CH2Br2 is closer to 1 (about 0.6, lifetime estimates of
5
CHBr2Cl discussed below). Thus, the derived slopes should yield good estimates for
the corresponding emission ratios. For CHBrCl2, analysed only for the TransBrom data, an emission ratio of 0.25 to CH2Br2(see Table 4) can be derived from the regression
analysis.
In the following we pick up the approach of McKeen and Liu (1993), explained above, 10
to derive estimates for the emission ratios of CHBr3/CH2Br2/CHBr2Cl. Using Eq. (3) (withX=CHBr2Cl,Y =CHBr3,Z=CH2Br2) and applying local lifetimes of 26, 69 and
120 days for CHBr3, CHBr2Cl and CH2Br2(Ko and Poulet et al., 2003), as also used in
two previous studies by Yokouchi et al. (2005) and O’Brien et al. (2009), the slope for the chemical decay line results in 4.89 on a double-logarithmic scale. As noted above, 15
for the dilution line based on the assumption of pure dilution processes a slope of 1 is expected. To achieve a broad database with samples bearing varying characteristics (in terms of dilution and chemcial decay processes) we combined the datasets from the two source regions under the simple assumption of similar relative emission strengths and similar lifetime ratios in both regions. The corresponding plot for the three datasets 20
is shown in Fig. 8. With the constraints for the dilution line to intersect at the upper left and the chemical decay line to intersect at the lower right portion of the data points, so that all values are enclosed by the two lines, we construct the intersection of the two lines based on the datasets List + TransBrom IAU (blue and black symbols) in point A, which yields the following lower estimate for the emission ratios of the three 25
considered compounds: 0.24 and 4.9 for CHBr2Cl and CHBr3, both relative to CH2Br2. Due to significant scale differences between the IAU and the UM data we standardised the data from Miami before adding them to the plot by applying a linear regression for the 23 air samples collected nearly at the same time (with time lags of about 5 min).
ACPD
11, 22199–22245, 2011Short-lived brominated species
S. Brinckmann et al.
Title Page
Abstract Introduction
Conclusions References
Tables Figures
◭ ◮
◭ ◮
Back Close
Full Screen / Esc
Printer-friendly Version Interactive Discussion
Discussion
P
a
per
|
Dis
cussion
P
a
per
|
Discussion
P
a
per
|
Discussio
n
P
a
per
|
The related correlations (see Fig. 11) are very strong, with determination coefficients of 0.98, 0.95 and 0.92 for CHBr3, CH2Br2and CHBr2Cl, which justifies the use of this approach. The TransBrom UM data treated in this way (displayed in grey) are generally consistent with the corresponding IAU data and the derived position of the two lines. A relatively lower measurement precision especially for the CHBr2Cl measurements at 5
Miami can account for the larger scattering of these data. Nevertheless, as already indicated by the linear regression analysis above, several points (identical with some of the coastal values discussed in Sect. 4.1) clearly fall outside the area spanned by the two lines derived from the two other datasets, because of unexpectedly high CHBr2Cl
mixing ratios. We ignore these values at the determination of the dilution line assuming 10
that they are a result of additional independent sources for this substance. Many of the Western Pacific data points lie close to the chemical decay line, which is consistent with the observation of very low mixing ratios above the open ocean caused by intense decomposition during long transport times. The List data exhibit a larger variation, with at least two points (identical with the mixing ratio maxima for CHBr3and CH2Br2)
15
suggesting a significant impact from dilution processes. But as indicated by the findings in Fig. 7 most of the List data also emphasise the influence of degradation processes rather than of a pure mixing with background air. So, a realistic position of the dilution line is likely to be somewhat higher than drawn, as would be the initial concentration ratios.
20
The findings of Yokouchi et al. (2005), drawn in the same graph (in brown), are based on various datasets from coastal and open ocean sites in the Pacific. Very high mixing ratios, as found in this study on San Cristobal Island and Christmas Island, determine the position of the two enveloping lines and the resulting emission ratios (0.7; 9). Thus, the relatively high CHBr3/CH2Br2ratio of 9 is likely to reflect the closer proximity to the
25
sources for some of the measurements. But the high ratio of CHBr2Cl to CH2Br2, as found in this study, clearly disagrees with our findings, as some of the List data would lie outside of this dashed dilution line based on Yokouchi et al. (2005). Deviations in the calibration scale for CHBr2Cl and/or differences in the emission ratios between
ACPD
11, 22199–22245, 2011Short-lived brominated species
S. Brinckmann et al.
Title Page
Abstract Introduction
Conclusions References
Tables Figures
◭ ◮
◭ ◮
Back Close
Full Screen / Esc
Printer-friendly Version Interactive Discussion
Discussion
P
a
per
|
Dis
cussion
P
a
per
|
Discussion
P
a
per
|
Discussio
n
P
a
per
|
the different source regions could be plausible explanations for these discrepancies. Measurements at the Cape Verde Islands (results added in green), evaluated with the same method by O’ Brien et al. (2009), also revealed an emission ratio of 9 for CHBr3/CH2Br2, but a somewhat smaller ratio of 0.46 for CHBr2Cl/CH2Br2.
The lifetime values used for the calculation of the chemical decay line in the above 5
analysis are estimates based on average tropospheric conditions (Ko and Poulet et al., 2003). These values have been updated in the new WMO report to 24, 59 and 123 days for CHBr3, CHBr2Cl and CH2Br2(Montzka et al., 2011), so that a different slope for the chemical decay line of 3.80 would follow. Furthermore, the relatively high near-surface temperatures in the tropics favour the degradation rate especially of CH2Br2relative to
10
CHBr3, as shown by Hossaini et al. (2010), who calculated local lifetimes of 52 days for CH2Br2and 16 days for CHBr3in these regions. Using these values and an estimate
of 29 days for the corresponding lifetime of CHBr2Cl – derived under the assumption
of the same relative lifetime ratio τCH2Br2−τCHBr2Cl versus τCH2Br2−τCHBr3 as present
for the average tropospheric values according to Montzka et al. (2011) – the slope of 15
the chemical decay line results in an even lower value of 2.84. This modified line is shown in black dashes. With the additional assumption of a somewhat higher position of the dilution line so that it would match an emission ratio of 9 for CHBr3/CH2Br2, point
B can be constructed at (0.35, 9). These values seem to be reasonable estimates of the initial concentration ratios of the three species, considering the strong emphasis 20
of degradation indicated for the datasets and the consistent findings from Yokouchi et al. (2005) and O’Brien et al. (2009).
Based on the global flux estimates of 61 Gg Br yr−1
for CH2Br2(Ko and Poulet et al., 2003) we derive values of 820 and 21 Gg Br yr−1
for CHBr3 and CHBr2Cl. Under the assumption of a similar emission ratio for CHBrCl2compared to CHBr2Cl, as indicated
25
by the regression slope analysis, the global Br flux from CHBrCl2 is calculated to be
11 Gg yr−1
. Some recent studies suggest that the flux estimates for CH2Br2 as used above are near the lower end of a range between 57 Gg Br yr−1
and 280 Gg Br yr−1
(Liang et al., 2010; Butler et al., 2007; Montzka et al., 2011), which implies relatively
ACPD
11, 22199–22245, 2011Short-lived brominated species
S. Brinckmann et al.
Title Page
Abstract Introduction
Conclusions References
Tables Figures
◭ ◮
◭ ◮
Back Close
Full Screen / Esc
Printer-friendly Version Interactive Discussion
Discussion
P
a
per
|
Dis
cussion
P
a
per
|
Discussion
P
a
per
|
Discussio
n
P
a
per
|
large uncertainties for these global fluxes and the absolute values derived above for the other species.
5 Observations TTL
5.1 Results
One of the two TTL samples above Teresina originates from an altitude of 14.8 km 5
(135.6 hPa, T =197.1 K, θ=349.1 K), which is very close to the LZRH (see e.g. Fueglistaler et al., 2009). The second sample was collected slightly above the cold point tropopause at 17.5 km, 85.3 hPa,T=192.6 K,θ=389.4 K. As the LZRH marks a boundary between mainly downward motion below and typically ascending air masses above, an air parcel exceeding this level is expected to be lifted into the stratosphere. 10
According to Gettelman et al. (2004) the LZRH is typically found at 15 km altitude, 125 hPa air pressure, 200 K temperature and 360 K potential temperature. In the same study a very small range of temperatures (between 198 and 201 K) for the LZRH was analysed (from five different profiles in the TTL), while the other attributes of the LZRH (altitude, pressure, potential temperature) exhibited a larger spread. These obser-15
vations emphasise the strong impact of water vapour mixing ratios, being fixed by the temperatures (Hartmann and Larson, 2002), on the determination of the LZRH. According to these findings the lowest air sample of the Teresina flight (collected at
T=197 K) originates from a region very close to this dynamical boundary. The rela-tively low potential temperature of 349 K could indicate a suppressed transport of latent 20
heat linked with diminished convection. Figure 12 displays the 10-day backward trajec-tories for different altitudes around 15 km (left panel) and around 17.5 km (right panel) above Teresina for the date of the flight. We find stronger horizontal movements and a very slow upward motion (see levels of potential temperatures along the trajectories in the plots), as expected for the TTL. However, it is well known that the vertical motion of 25
kinematic trajectories (derived from pressure tendency of the underlying meteorological
ACPD
11, 22199–22245, 2011Short-lived brominated species
S. Brinckmann et al.
Title Page
Abstract Introduction
Conclusions References
Tables Figures
◭ ◮
◭ ◮
Back Close
Full Screen / Esc
Printer-friendly Version Interactive Discussion
Discussion
P
a
per
|
Dis
cussion
P
a
per
|
Discussion
P
a
per
|
Discussio
n
P
a
per
|
dataset), as used by the HYSPLIT model, can deviate considerably from the real mo-tion in the upper troposphere and the TTL (e.g. Ploeger et al., 2010). A spread is visible for the trajectories in both graphs, thus an attribution of the two related air samples to a specific region of origin is not possible.
The results of the analysis of the two TTL air samples for the five brominated VSLS 5
are listed in Table 6. As expected, they indicate a strong vertical gradient of the VSLS mixing ratios in the TTL (especially for CHBr3), caused by the degradation of the source gases during the relatively slow vertical transport. The product gases from these de-composition processes above the LZRH are likely to contribute largely to the strato-spheric bromine, since removal processes linked with cloud formation and precipitation 10
are expected to be less effective at these altitudes. Thus, the air sample near the LZRH should yield a good estimate of the amount of bromine injected into the stratosphere by the different source gases.
In Table 7 the budget of organic bromine for the air sample near the LZRH is listed. Given are the contributions of the different source gases to a virtual mixing ratio of 15
bromine atoms. Thus, for molecules with multiple bromine atoms the initial source gas mixing ratio is multiplied with the number of bromine atoms. Assuming that the investigated air mass is lifted to the upper stratosphere without removal of bromine or mixing with ambient air, a complete degradation of all source gases would convert this bromine bound to organic compounds (Brorg) to a corresponding mixing ratio of 20
inorganic bromine (Bry). We find a total of 17.82 ppt with a major contribution from
CH3Br (41 %), while the sum of the halons yields a relative amount of 46 %. The
remaining fraction of 2.25 ppt (12.6 %) is attributed to the five VSLS.
As mentioned in Sect. 2.2 the concentrations of CH3Br, CH2Br2and CHBr3showed
significant declines after one year of storage in the BONBON canisters. When assum-25
ing a linear drift between the date of sampling and the date of the repeated measure-ment, the initial mixing ratios of CH3Br, CH2Br2and CHBr3would have been 3 %, 2 %
and 14 % higher at the time of the sampling than determined by the measurements. This would result in an additional 0.11 ppt bromine from the two VSLS in the budget set
ACPD
11, 22199–22245, 2011Short-lived brominated species
S. Brinckmann et al.
Title Page
Abstract Introduction
Conclusions References
Tables Figures
◭ ◮
◭ ◮
Back Close
Full Screen / Esc
Printer-friendly Version Interactive Discussion
Discussion
P
a
per
|
Dis
cussion
P
a
per
|
Discussion
P
a
per
|
Discussio
n
P
a
per
|
up for the air sample near the LZRH. Such an assumption would be rather arbitrary, since the underlying decay function is not characterised by the available two measure-ments. The results from the sample stability experiments with the two-liter canisters (Sect. 2.2) indicate an exponential decrease for CHBr3. On the other hand the very high pressure (of around 30 bar) present in the BONBON canister until the first mea-5
surement may have stabilised the conditions during the first weeks.
5.2 Comparison and discussion
The budget of bromine obtained in a region near the LZRH indicates that the VSLS have a considerable impact on the stratospheric content of inorganic bromine. Accord-ing to our data approximately half of the unassigned stratospheric bromine of about 10
3–7 ppt (Dorf et al., 2006) could be explained by the injection of bromine originating from VSLS, when assuming no removal processes above the LZRH on one hand and global representativeness of our measurement on the other hand. Considering the distance of the sampling site to the regions near the ITCZ with deep convection and fast ascent of air masses, there is potential for a larger contribution from VSLS to the 15
stratospheric bromine budget than indicated by our measurements.
During a former balloon flight in June 2005 in Teresina the VSLS mixing ratios (anal-ysed for an air sample at 15.2 km withθ=359 K) were considerably lower than those analysed in 2008 at nearly the same altitude (Laube et al., 2008). The total Bry from
VSLS was 1.25 ppt, while especially the CHBr3 contribution was unexpectedly low,
20
with only 0.05 ppt Bry. This comparison and the comparison with the available data from other studies (e.g. Schauffler et al., 1999; Sinnhuber and Folkins, 2006) indicate that the variabilities of the VSLS concentrations are relatively high in the TTL, due to variations of the source emissions and of the related transport processes into the TTL. Nevertheless, in the specific case of the 2005 Teresina sample, we assume that the 25
initial VSLS mixing ratios had reduced after a long time of storage of 8 months between sampling and measurements in the canisters, which can possibly account for a part of the differences compared to the observations presented in this study.
ACPD
11, 22199–22245, 2011Short-lived brominated species
S. Brinckmann et al.
Title Page
Abstract Introduction
Conclusions References
Tables Figures
◭ ◮
◭ ◮
Back Close
Full Screen / Esc
Printer-friendly Version Interactive Discussion
Discussion
P
a
per
|
Dis
cussion
P
a
per
|
Discussion
P
a
per
|
Discussio
n
P
a
per
|
Little knowledge exists about the relative importance of the product gas injection, the transport of organic or inorganic products from the decomposition of CH3Br and the brominated VSLS to the stratosphere. The high mixing ratio gradients observed for CHBr3and other VSLS in the TTL indicate a strong degradation of these substances
between the LZRH and the cold-point tropopause and also below the LZRH. This raises 5
the important question of the extent to which these product gases are affected by possi-ble removal processes in the TTL. Even though washout processes are expected to be relatively rare in the layer above the level of main convective outflow at 14 km, the sol-uble reservoir gas HBr (the typical degradation product under tropospheric conditions) can be efficiently removed by singular events of convective overshooting. Additional 10
removal can be caused by falling ice particles, which form during the dehydration of rising air parcels up to the cold-point tropopause (e.g. Sinnhuber and Folkins, 2006). On the other hand, inorganic bromine already present near the LZRH could compen-sate for the loss of Bryproduced and washed-out during the transport to the cold-point tropopause.
15
In a simple approach we can assume our VSLS source gas data at 17.5 km as representative for the source gas injection (SGI) into the stratosphere and the values measured at 14.8 km as the sum of SGI and PGI (Product Gas Injection). The corre-sponding results from this calculation are listed in Table 8. As expected, we find the highest relative amount of SGI (versus total Br injection) for the relatively longer-lived 20
compounds CH2Br2 and CH2BrCl with 74 % and 82 % respectively. For the
shortest-lived CHBr3only 21 % of the bromine molecules would be transported directly via SGI
across the tropopause, about 80 % would be bound to the different products following the decomposition of CHBr3 in the TTL. Since the sample at 17.5 km was collected
somewhat above the tropopause and the product gases are potentially affected by re-25
moval processes in the TTL, the relative contribution from SGI to the total transport of bromine into the stratosphere is expected to be somewhat higher in reality. Using the chemical transport model SLIMCAT and assuming different Bry lifetimes (from 10 to ∞days) Hossaini et al. (2010) found similar ranges for the relative SGI of 7–32 % for
ACPD
11, 22199–22245, 2011Short-lived brominated species
S. Brinckmann et al.
Title Page
Abstract Introduction
Conclusions References
Tables Figures
◭ ◮
◭ ◮
Back Close
Full Screen / Esc
Printer-friendly Version Interactive Discussion
Discussion
P
a
per
|
Dis
cussion
P
a
per
|
Discussion
P
a
per
|
Discussio
n
P
a
per
|
CHBr3and 62–87 % for CH2Br2. The corresponding absolute values derived from this global modelling study are also in a fair agreement with our rough estimates.
6 Conclusions
With our measurements we can extend the database for all five relevant brominated VSLS in the source regions and at the transition to the stratosphere. The Western 5
Pacific data clearly emphasise the importance of coastal sources, as the mixing ra-tios of the short-lived bromocarbons considerably drop above the open ocean. Strong correlations, as found between CHBr3, CH2Br2, CHBr2Cl and CHBrCl2, indicate emis-sions from the same sources in certain emission ratios. Using an approach by McKeen and Liu (1993) and comparing the results with the findings from former studies, we 10
derive estimates of 9/1/0.35/0.35 for the initial concentration ratios of CHBr3, CH2Br2, CHBr2Cl and CHBrCl2. A relatively independent variability as found for CH2BrCl
in-dicates specific sources for this substance. Several of the coastal air samples in the Western Pacific suggest the presence of an additional independent source or a higher emission ratio for CHBr2Cl in these specific regions.
15
The results of the TTL measurements above Teresina indicate a significant con-tribution from brominated VSLS to the stratospheric bromine. Based on the budget of organic bromine near the LZRH (at 14.8 km) we estimate the amount of bromine transported by VSLS in this region at the time of the flight to be 2.25 ppt. This would make up 13 % of total organic bromine (17.82 ppt), with CH2Br2(1.45 ppt) and CHBr3 20
(0.56 ppt) accounting for 90 % of the VSLS budget. These values are near the lower end of the range of about 3-7 ppt derived from stratospheric BrO measurements (Dorf et al., 2006). The comparison with former measurements in the same TTL region and with the findings from other studies indicates a relatively high variability of the VSLS mixing ratios in the TTL. Measurements with higher spatial and temporal resolution are 25
needed to obtain a more precise picture of the global contribution of brominated VSLS to stratospheric bromine, especially in the Western Pacific region – an area identified to be of major importance for the global transport into the stratosphere.
ACPD
11, 22199–22245, 2011Short-lived brominated species
S. Brinckmann et al.
Title Page
Abstract Introduction
Conclusions References
Tables Figures
◭ ◮
◭ ◮
Back Close
Full Screen / Esc
Printer-friendly Version Interactive Discussion
Discussion
P
a
per
|
Dis
cussion
P
a
per
|
Discussion
P
a
per
|
Discussio
n
P
a
per
|
Acknowledgements. We thank K. Kr ¨uger for the organisation of the TransBrom campaign, fur-thermore C. M ¨uller, H. Quack and A. Lanatowitz for the collection of the samples. E. Atlas likes to acknowledge X. Zhu and L. Pope for technical support during the sample analyses at Miami. Financial support from the European commission under the project SHIVA (grant no. 226224) are acknowledged as well as the funding and support by the International Max Planck
Re-5
search School (IMPRS) for Atmospheric Chemistry and Physics. Additionally we like to thank J. Williams and the MPI Mainz for providing the sample canisters during the campaigns List and TransBrom.
References
Atlas, E., Pollock, W., Greenberg, J., Heidt, L., and Thompson, A.: Alkyl Nitrates, Nonmethane
10
Hydrocarbons, and Halocarbon Gases Over the Equatorial Pacific Ocean During Saga 3, J. Geophys. Res., 98(D9), 16933–16947, 1993.
Aschmann, J., Sinnhuber, B.-M., Atlas, E. L., and Schauffler, S. M.: Modeling the transport of very short-lived substances into the tropical upper troposphere and lower stratosphere, Atmos. Chem. Phys., 9, 9237–9247, doi:10.5194/acp-9-9237-2009, 2009.
15
Butler, J. H., King, D. B., Lobert, J. M., Montzka, S. A., Yvon-Lewis, S. A., Hall, B. D., Warwick, N. J., Mondeel, D. J., Aydin, M., and Elkins, J. W.: Oceanic distributions and emissions of short-lived halocarbons, Global Biogeochem. Cy., 21, GB1023, doi:10.1029/2006GB002732, 2007.
Carpenter, L. J., Liss, P. S., and Penkett, S. A.: Marine organohalogens in the
at-20
mosphere over the Atlantic and Southern Oceans, J. Geophys. Res., 108(D9), 4256, doi:10.1029/2002JD002769, 2003.
Carpenter, L. J., Wevill, D. J., O’Doherty, S., Spain, G., and Simmonds, P. G.: Atmospheric bromoform at Mace Head, Ireland: seasonality and evidence for a peatland source, Atmos. Chem. Phys., 5, 2927–2934, doi:10.5194/acp-5-2927-2005, 2005.
25
Carpenter, L. J., Wevill, D. J., Hopkins, J. R., Dunk, R. M., Jones, C. E., Hornsby, K. E., and McQuaid, J. B.: Bromoform in tropical Atlantic air from 25◦
N to 25◦
S, Geophys. Res. Lett., 34, L11810, doi:10.1029/2007GL029893, 2007.
Class, T. and Ballschmiter, K.: Chemistry of Organic Traces in Air, VIII: Sources and Distribution
ACPD
11, 22199–22245, 2011Short-lived brominated species
S. Brinckmann et al.
Title Page
Abstract Introduction
Conclusions References
Tables Figures
◭ ◮
◭ ◮
Back Close
Full Screen / Esc
Printer-friendly Version Interactive Discussion
Discussion
P
a
per
|
Dis
cussion
P
a
per
|
Discussion
P
a
per
|
Discussio
n
P
a
per
|
of Bromo- and Bromochloromethanes in Marine Air and Surfacewater of the Atlantic Ocean, J. Atmos. Chem., 6, 35–46, 1988.
Dorf, M., Butler, J. H., Butz, A., Camy-Peyret, C., Chipperfield, M. P., Kritten, L., Montzka, S. A., Simmes, B., Weidner, F., and Pfeilsticker, K.: Long-term observations of stratospheric bromine reveal slow down in growth, Geophys. Res. Lett., 33, L24803,
5
doi:10.1029/2006GL027714, 2006.
Fueglistaler, S., Wernli, H., and Peter, T.: Tropical troposphere-to-stratosphere transport inferred from trajectory calculations, J. Geophys. Res., 109, D03108, doi:10.1029/2003JD004069, 2004.
Fueglistaler, S., Dessler, A. E., Dunkerton, T. J., Folkins, I., Fu, Q., and Mote, P. W.: Tropical
10
tropopause layer, Rev. Geophys., 47, RG1004, doi:10.1029/2008RG000267, 2009.
Gettelman, A., Salby, M. L., and Sassi, F.: The distribution and influence of convection in the tropical tropopause region, J. Geophys. Res., 107(D10), 4080, doi:10.1029/2001JD001048, 2002.
Gettelman, A., de F. Forster, P. M., Fujiwara, M., Fu, Q., V ¨omel, H., Gohar, L. K., Johanson, C.,
15
and Ammerman, M.: Radiation balance of the tropical tropopause layer, J. Geophys. Res., 109, D07103, doi:10.1029/2003JD004190, 2004.
Hartmann, D. L. and Larson, K.: An important constraint on tropical cloud - climate feedback, Geophys. Res. Lett., 29(20), 1951, doi:10.1029/2002GL015835, 2002.
Hossaini, R., Chipperfield, M. P., Monge-Sanz, B. M., Richards, N. A. D., Atlas, E., and Blake,
20
D. R.: Bromoform and dibromomethane in the tropics: a 3-D model study of chemistry and transport, Atmos. Chem. Phys., 10, 719–735, doi:10.5194/acp-10-719-2010, 2010.
Ko, M. K. W., Poulet, G., Blake, D. R., Boucher, O. Burkholder, J. H., Chin, M., Cox R., A., George, C., Graf, H.-F., Holton, J. R., Jacob, D. J., Law, K. S., Lawrence, M. G., Midgley, P. M., Seakins, P. W., Shallcross, D. E., Strahan, S. E., Wuebbles, D. J., and Yokouchi, Y.:
25
Very short-lived halogen and sulfur substances, Scientific assessment of ozone depletion: 2002, Global Ozone Research and Monitoring Project. Report No. 47, Chapter 2, World Meteorological Organization, Geneva, 2003.
Laube, J. C., Engel, A., B ¨onisch, H., M ¨obius, T., Worton, D. R., Sturges, W. T., Grunow, K., and Schmidt, U.: Contribution of very short-lived organic substances to stratospheric chlorine and
30
bromine in the tropics – a case study, Atmos. Chem. Phys., 8, 7325–7334, doi:10.5194/acp-8-7325-2008, 2008.
Law, K. S., Sturges, W. T., Blake, D. R., Blake, N. J., Burkholder, J. B., Butler, J. H., Cox, R. A.,