Clim. Past, 11, 1467–1490, 2015 www.clim-past.net/11/1467/2015/ doi:10.5194/cp-11-1467-2015
© Author(s) 2015. CC Attribution 3.0 License.
How might the North American ice sheet influence the
northwestern Eurasian climate?
P. Beghin1, S. Charbit1, C. Dumas1, M. Kageyama1, and C. Ritz2
1Laboratoire des Sciences du Climat et de l’Environnement, CEA-CNRS-UVSQ, UMR 8212, Gif-sur-Yvette, France
2Laboratoire de Glaciologie et de Géophysique de l’Environnement, CNRS-UJF, UMR 5183, Saint Martin d’Hères, France
Correspondence to:S. Charbit (sylvie.charbit@lsce.ipsl.fr)
Received: 8 December 2014 – Published in Clim. Past Discuss.: 7 January 2015 Revised: 7 October 2015 – Accepted: 12 October 2015 – Published: 26 October 2015
Abstract.It is now widely acknowledged that past North-ern Hemisphere ice sheets covering Canada and northNorth-ern Europe at the Last Glacial Maximum (LGM) exerted a strong influence on climate by causing changes in atmo-spheric and oceanic circulations. In turn, these changes may have impacted the development of the ice sheets themselves through a combination of different feedback mechanisms. The present study is designed to investigate the potential im-pact of the North American ice sheet on the surface mass balance (SMB) of the Eurasian ice sheet driven by simu-lated changes in the past glacial atmospheric circulation. Us-ing the LMDZ5 atmospheric circulation model, we carried out 12 experiments under constant LGM conditions for in-solation, greenhouse gases and ocean. In these experiments, the Eurasian ice sheet is removed. The 12 experiments differ in the North American ice-sheet topography, ranging from a white and flat (present-day topography) ice sheet to a full-size LGM ice sheet. This experimental design allows the albedo and the topographic impacts of the North American ice sheet onto the climate to be disentangled. The results are compared to our baseline experiment where both the North American and the Eurasian ice sheets have been removed. In summer, the sole albedo effect of the American ice sheet modifies the pattern of planetary waves with respect to the no-ice-sheet case, resulting in a cooling of the northwest-ern Eurasian region. By contrast, the atmospheric circulation changes induced by the topography of the North American ice sheet lead to a strong decrease of this cooling. In winter, the Scandinavian and the Barents–Kara regions respond dif-ferently to the American ice-sheet albedo effect: in response to atmospheric circulation changes, Scandinavia becomes warmer and total precipitation is more abundant, whereas
the Barents–Kara area becomes cooler with a decrease of convective processes, causing a decrease of total precipita-tion. The gradual increase of the altitude of the American ice sheet leads to less total precipitation and snowfall and to colder temperatures over both the Scandinavian and the Barents and Kara sea sectors. We then compute the resulting annual surface mass balance over the Fennoscandian region from the simulated temperature and precipitation fields used to force an ice-sheet model. It clearly appears that the SMB is dominated by the ablation signal. In response to the sum-mer cooling induced by the Asum-merican ice-sheet albedo, high positive SMB values are obtained over the Eurasian region, leading thus to the growth of an ice sheet. On the contrary, the gradual increase of the American ice-sheet altitude in-duces more ablation over the Eurasian sector, hence limiting the growth of Fennoscandia. To test the robustness of our re-sults with respect to the Eurasian ice sheet state, we carried out two additional LMDZ experiments with new boundary conditions involving both the American (flat or full LGM) and high Eurasian ice sheets. The most striking result is that the Eurasian ice sheet is maintained under full-LGM North American ice-sheet conditions, but loses ∼10 % of its mass
1 Introduction
The last million years is characterized by alternating glacial and interglacial phases. During glacial periods, large ice sheets covering present-day Canada and northwestern Eura-sia (Dyke and Prest, 1987; Clark et al., 1993; Peltier, 2004; Svendsen et al., 2004; Lambeck et al., 2006; Tarasov et al., 2012) exerted a strong influence on climate. Several studies highlighted the importance the climatic changes induced by continental-scale ice sheets (e.g. Clark, 1999). It has been recognized that the ice-sheet topography is likely to be the main factor altering the atmospheric circulation in the North-ern Hemisphere (Broccoli and Manabe, 1987; Pausata et al., 2011). As an example, the pioneering study carried out by Manabe and Broccoli (1985) with an atmospheric general circulation model shows that the North American ice sheet caused a split of the westerlies. The authors also highlight a larger amplitude of the planetary waves due to the presence of ice sheets. Recently, Ullman et al. (2014) tested the influ-ence of different North American ice-sheet reconstructions on the climate. They showed that a higher American ice sheet leads to a more zonal Atlantic jet, thereby confirming the key role of ice-sheet topography on atmospheric circulation. Using model outputs from the Paleo Modelling Intercom-parison Project 2 (PMIP2) (Braconnot et al., 2007), Laîné et al. (2009) and Rivière et al. (2010) highlight a strength-ening and an equatorward displacement of the sub-tropical jet-stream during the Last Glacial Maximum (LGM) with re-spect to the pre-industrial period. Changes in the position and the strength of the North Atlantic jet stream induce changes in the storm tracks, and therefore in precipitation (Hall et al., 1996; Kageyama and Valdes, 2000; Laîné et al., 2009; Riv-ière et al., 2010). These changes also have an influence on the energy transport and can therefore modify the temperature.
The climatic changes induced by large-scale ice sheets ex-ert an influence on both temperature and precipitation that drive the ice-sheet surface mass balance (SMB), defined as the sum of snow accumulation and snow and ice ab-lation. Using a simple ice-sheet model based on an ideal-ized geometry coupled to a stationary-wave model, Roe and Lindzen (2001a, b) underline the importance of accounting for the feedbacks between ice sheets and temperatures in-duced by changes in stationary waves to properly simulate the evolution of an ice sheet. They show that the self-induced temperature anomaly due to an ice sheet leads to a warm-ing over the ice-sheet western part. This may explain the absence of ice over Alaska at the LGM. They also suggest that the stationary waves excited by the North American ice sheet may have contributed to a warming over Europe, in-fluencing the development of the Eurasian ice sheet. In the same way, with a three-dimensional stationary wave model, Liakka et al. (2011) showed that the position of the south-ern margin of ice sheets strongly depends on the temperature anomalies due to stationary waves, which are modified by the ice sheet itself. More recently, with the use of the CAM3
atmospheric model run under four different climatic contexts (last interglacial, marine isotope stages 5b and 4 (MIS5b and MIS4), and LGM periods), Löfverström et al. (2014) showed how the atmospheric circulation changes induced by the ice sheets could have influenced the growth of the ice sheets themselves. Similarly to Roe and Lindzen (2001a), they show that the summer atmospheric circulation change due to the presence of ice sheets may cause a sufficient warming over Siberia and Alaska to inhibit ice growth. They also perform two experiments under MIS4 conditions to test the influence of one ice sheet on the other. They conclude that the sum-mer temperature anomaly induced by the presence of the MIS4 American ice sheet is too weak to explain the small size of the European ice sheet at that period, but may have contributed to the westward shift of the ice-sheet mass cen-ter. Although several studies have been devoted to the mutual influences of the ice sheets (Roe and Lindzen, 2001a; Beghin et al., 2014; Löfverström et al., 2014), no study has specifi-cally investigated the mechanisms through which the Ameri-can ice sheet may have influenced the European climate, and therefore the European ice-sheet surface mass balance.
The aim of this paper is to investigate the atmospheric re-sponse to changes in the North American ice-sheet bound-ary conditions and to examine how the related atmospheric circulation changes impact the climate over the Scandina-vian and Barents–Kara sea regions. To achieve this goal, we use the LMDZ5 atmospheric general circulation model run with different thicknesses of the North American ice sheet taken as boundary conditions, with no ice at all over Eura-sia. We investigate the mechanisms by which the Ameri-can ice sheet may change the surface mass balance of the Eurasian ice sheet. Besides gradually increasing the altitude of the North American ice sheet, the originality of the present study also relies on ice-sheet model simulations. We use cli-matic fields simulated by the LMDZ5 model as inputs to a three-dimensional ice-sheet model to compute the surface mass balance of the Eurasian ice sheet. The description of the climate and ice-sheet models is given in Sect. 2 as well as the experimental design. The model results, presented in Sects. 3 and 4, are followed by a discussion (Sect. 5). Sec-tion 6 summarizes the main findings of our study.
2 Model and experiment
2.1 The atmospheric model
P. Beghin et al.: North American ice sheet influence on the Eurasian climate 1469
Figure 1.Ice-sheet and oceanic boundary conditions used for the LMDZ experiments.(a)Ice-sheet height (light blue scale) and land height (brown scale) given as boundary conditions for the 5 selected experiments out of 12. Dark blue–brown limits represent the sea-land mask, and brown–light blue limits represent the land-ice mask.(b)Averaged annual sea-surface temperature (shading) and sea-ice extent for boreal summer (red contours) and winter (blue contours) from the PMIP3 IPSL-CM5A-LR simulations. The averages are computed over 50 years which have been used to create the boundary conditions for the LMDZ experiments.
for baroclinic flows (Sadourny, 1975a, b) and the axisymmet-ric component of the angular momentum. The model version used in this study has 39 vertical levels and runs on a 96×95 model grid resolution (3.75◦×1.9◦). A complete description
of the model can be found in (Hourdin et al., 2013).
2.2 The ice-sheet model
equa-hLIS (m) ( 55.9°N) 00dhL 10dhL 20dhL 30dhL 40dhL 50dhL 60dhL 70dhL 80dhL 90dhL 100dhL
0%ΔhLISPMIP3
10% 20%
... 80% 90% ΔhLISPMIP3
Figure 2.Laurentide ice-sheet height for each LMDZ experiment (with name of the corresponding experiment). The height of the LIS is defined as a relative difference between PMIP3 Laurentide ice-sheet height and the present-day topography (1hPMIP3LIS ).
tions are solved on a cartesian grid (40 km×40 km). Over the grounded part of the ice sheet, the ice flow resulting from internal deformation is governed by the shallow-ice approxi-mation (Hutter, 1983; Morland et al., 1984). The model deals with ice flow through ice shelves using the shallow-shelf approximation (MacAyeal, 1989). It also predicts the large-scale characteristics of the ice streams using criteria based on the effective pressure and hydraulic load. At each time step, the velocity and vertical profiles of temperature in the ice are computed as well as the new geometry of the ice sheet. The isostatic adjustment of bedrock in response to ice load is gov-erned by the flow of the asthenosphere, with a characteristic time constant of 3000 years, and by the rigidity of the litho-sphere. The temperature field is computed both in the ice and in the bedrock by solving a time-dependent heat equation. The surface mass balance is defined as the sum between ac-cumulation and ablation computed by the empirical positive degree-day (PDD) method (Reeh, 1991; Fausto et al., 2009). This method assumes that melt rates of snow and ice are lin-early related to the number of PDD through degree-day fac-tors for snow and ice materials (Braithwaite, 1984, 1995).
2.3 Experimental set-up
In order to investigate the albedo and topography effects induced by the North American ice sheet on the Eurasian climate at the LGM, we carried out 12 simulations under LGM conditions for greenhouse gases (GHGs), insolation, sea-surface temperatures and sea-ice. In this series of sim-ulations, the altitude of the North American ice-sheet sur-face ranges from that of the present-day sursur-face to 100 % of that used in the PMIP3 LGM experiments. The PMIP3 LGM ice sheets result from a combination of three reconstruc-tions, namely ICE-6G v2.0 (Toscano et al., 2011), GLAC-1
(Tarasov et al., 2012) and ANU (Lambeck, 2001). The way this new reconstruction has been obtained is explained in detail on the PMIP3 website (https://wiki.lsce.ipsl.fr/pmip3/ doku.php/pmip3:design:pi:final:icesheet) and in Abe-Ouchi et al. (2015). In our baseline experiment (noIS), the land-ice mask is modified (with respect to PMIP3) to remove both the European and the American ice sheets and the altitude is that of the present day (Fig. 1). In the other simulations, we only remove the European ice-sheet mask. These simulations are referred to asxxdhL, where dhL represents the surface height difference between the PMIP3 LGM Laurentide ice sheet and the present-day surface, andxx represents the percent-age of dhL taken into account. To simplify the writing, the American and Eurasian ice sheets are respectively referred to as “Laurentide ice sheet” (LIS) and the “Fennoscandian ice sheet” (FIS) in the following.
The topography of the 00dhL experiment is therefore the same as today, but the land-ice mask is set to the LGM one (Figs. 1 and 2). Greenland and Antarctic ice sheets are the same as in the PMIP3 experimental set-up. Both insolation and GHG boundary conditions are similar to those defined in the PMIP3 protocol: the orbital forcing is taken at 21 kyr BP from (Berger, 1978), while atmospheric GHG concentrations are those recorded in Antarctic ice cores (CO2=185 ppm,
(Lüthi et al., 2008); CH4=350 ppb, (Loulergue et al., 2008);
N2O=200 ppb, (Spahni et al., 2005)). The LGM land–sea
mask is also taken into account, with closed Bering Strait, and land in Hudson Bay and Barents Sea (Fig. 1). The sea-surface temperatures (SSTs) and sea-ice cover come from 50 consecutive years of the IPSL PMIP3 LGM run outputs (Kageyama et al., 2013). These oceanic surface conditions are depicted in Fig. 1. In the North Atlantic area, the temper-ature meridional gradient is steep in the western part of the basin and weakens in its eastern part, as for the pre-industrial period. The sea-ice edge is located south of Iceland in win-ter and retreats to the northern limits of the Nordic seas in summer. These rather warm North Atlantic Ocean/Nordic sea conditions are due to a strong Atlantic meridional overturn-ing circulation (Kageyama et al., 2013). Usoverturn-ing these bound-ary conditions, the LMDZ5 simulations are run for 50 years, and we study the last 40 years to be at equilibrium. Two-sided Studentttests with apvalue=0.05 (von Storch and Zwiers,
2003) are performed on key diagnostics.
3 AGCM results
P. Beghin et al.: North American ice sheet influence on the Eurasian climate 1471
Figure 3.2 m summer (left) and winter (right) temperature without the LIS (noIS) and anomaly of the 2 m temperature between thexxdhL experiments and the noIS experiment; we can therefore quantify the impact of the LIS presence, depending on its topography. The visible surface albedo difference betweenxxdhL and noIS experiments are represented by orange contours (albedo difference=0.4) and yellow contours (albedo difference=0.2). The statistical significance of the patterns of temperature anomalies has been checked using a two-sided Studentttest with apvalue=0.05. The white shading indicates areas where the anomaly is not significant.
3.1 The northwestern Eurasian temperature 3.1.1 Impact of the Laurentide ice sheet
Using the comparison between the 00dhL and the noIS ex-periments, we first consider the impact of the LIS albedo on the 2 m summer air temperature over the Scandinavia– Barents–Kara (SBK) region (Fig. 3, 00dhL experiment, left column). The most striking feature is a cooling over the
whole Eurasian continent with a maximum (more than 10◦C)
centered over the Barents and Kara seas and a moderate cool-ing (2 to 4◦C) over Scandinavia. The area experiencing the
Figure 4.500 hPa summer geopotential height anomaly from zonal mean (left panels) and 500 hPa horizontal wind (arrows) and meridional wind (shaded, right panels).
in this area, causing in turn a positive feedback on tempera-tures. Figure 3 also displays the 2 m mean summer temper-ature over the SBK region for different altitudes of the LIS. Here, we only give results of selected experiments to simplify the presentation of our results. It appears that the SBK cool-ing gets smaller when the LIS gets higher. Overall, the sim-ulated summer surface air temperature evolves together with
the LIS altitude, with a progressive reduction of the zonal and meridional extent of the largest cooling zone. When the LIS reaches its full LGM size (100dhL-noIS), the summer cooling over the Barents and Kara seas is reduced to 4–6 and to 2◦
P. Beghin et al.: North American ice sheet influence on the Eurasian climate 1473
Figure 5.Same as Fig. 4 for the winter season.
In winter, the response of the temperature to the LIS albedo and its evolution with the LIS altitude are differ-ent from the summer response (Fig. 3, right panels). First, the LIS albedo induces warmer temperatures (+3◦C) over
southern Scandinavia, the British Isles and the present-day North and Baltic seas, and cooler temperatures over an area in the Barents Sea expanding from Svalbard to
No-vaya Zemlya (3◦
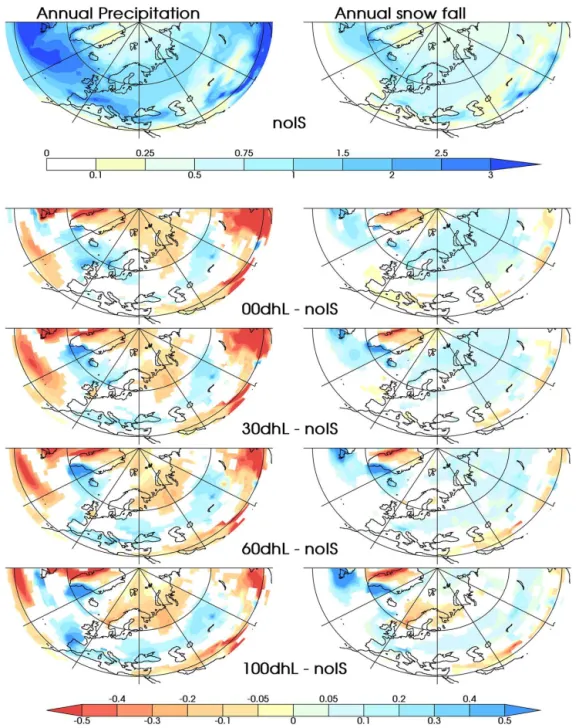
Figure 6.Same as Fig. 3 for annual precipitation (left column) and annual snowfall (right column).
contrast to the climatic response simulated for the summer season, the LIS topography leads to colder surface air tem-peratures in winter.
To understand the origin of these contrasted responses, we investigate the processes through which the changes in the altitude of the Laurentide ice sheet modify the atmospheric circulation.
3.1.2 Atmospheric circulation processes
The comparison of the zonal anomaly (00dhL vs. noIS) of the 500 hPa summer geopotential height shows that the sole
P. Beghin et al.: North American ice sheet influence on the Eurasian climate 1475
Figure 7.Large-scale (left panels) and convective (right panels) annual precipitation without LIS (noIS experiment, top panels), and anoma-lies of large-scale and convective precipitation between the xxdhL and noIS experiments. The statistical significance of the patterns of temperature anomalies has been checked using a two-sided Student-ttest with apvalue=0.05. The white shading indicates areas where the anomaly is not significant.
the stronger ridge over Greenland induces northerlies over Svalbard and the Barents Sea (Fig. 4) and therefore colder temperatures (Fig. 3).
The Labrador trough and the North Atlantic ridge become stronger when the LIS gets higher, until it reaches 60 % of its full size. Beyond 60dhL, the Labrador trough and the At-lantic ridge keep more or less the same amplitude. When the LIS gets higher, the Greenland ridge gets weaker, the Eu-ropean ridge remains almost unchanged (Fig. 4), and there
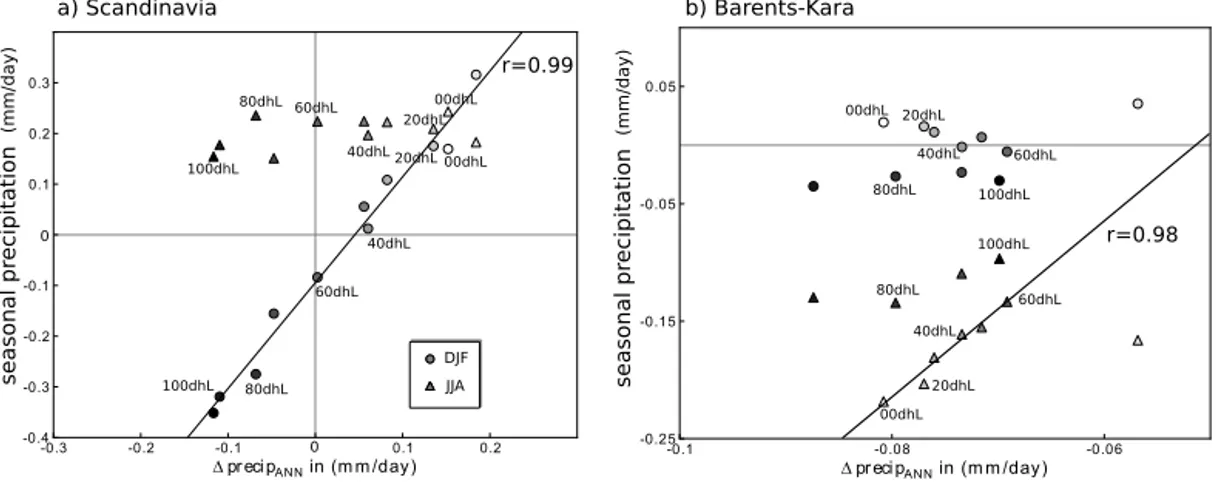
Figure 8.(a)Scandinavian and(b)Barents–Kara precipitation anomalies (xxdhL-noIS) during winter (circles) and summer (triangles) vs. annual precipitation anomaly. The lower the Laurentide ice-sheet altitude, the lighter grey the symbols are.
In winter (Fig. 5), the sole albedo effect of the LIS does not drastically change the geopotential anomaly. However, the meridional wind field shows a slight decrease of the souther-lies over the Barents Sea, explaining the slight cooling over this region. There is also a slight decrease of the northerlies simulated over the British Isles, the eastern North Atlantic Ocean and southern Scandinavia, consistent with the moder-ate warming simulmoder-ated over this region. In the 30dhL exper-iment, a strengthening of the southerlies is observed (Fig. 5) inducing a warming (with respect to 00dhL) over the SBK region (Fig. 3) and explaining the non-linear behavior on winter temperatures. When the altitude of the LIS further in-creases, there is a progressive emergence of a trough over the Scandinavian–Barents sector. This trough comes with northerlies over the Norwegian Sea and weaker southerlies over the Barents sea (Fig. 5, right column), consistently with colder temperatures over this area, as seen in Fig. 3.
This analysis explains why opposite sign temperature re-sponses are obtained for the summer and winter seasons. Since ablation is rather sensitive to the summer season, more ice is expected over the Fennoscandian area when the sole albedo effect of the LIS is operating (i.e. 00dhL experiment). However, the development of an ice sheet in this area also depends on the amount of snow accumulation. Therefore, we next examine hereafter the LIS impact on the SBK total pre-cipitation and snowfall.
3.2 Total and solid precipitation over northwestern Eurasia
3.2.1 Impact of the Laurentide ice sheet
In this section, we investigate the impact of the LIS on the mean annual precipitation and snowfall over northwestern Eurasia (Fig. 6). In response to the LIS albedo effect (00dhL-noIS panel) a slight excess of precipitation is simulated over the northeastern North Atlantic and the southern and
west-ern parts of Scandinavia, but less precipitation is simulated over the Barents–Kara sea area. However, over the whole SBK region, the snowfall anomaly is positive. This increase in snowfall is due to the summer signal (not shown) related to the cooling observed over this region (Fig. 3). This cool-ing is strong enough to allow for an increase of the fraction of solid precipitation and to maintain the snow cover.
When the LIS reaches its full LGM altitude (100dhL-noIS), the positive anomaly of total precipitation over Scan-dinavia simulated in the 00dhL experiment shifts southward, reaching even the French and the Iberian Peninsula Atlantic coasts. This results in dry conditions over the western flank of the Scandinavian region, both in terms of total and solid precipitation. Concomitantly, the negative anomaly of total precipitation over the Barents–Kara sea region simulated in 00dhL expands westward leading to a drier climate and to a decrease of snowfall over Scandinavia. These results suggest that the Barents and Kara seas and the Scandinavian regions are sensitive to different characteristics of the LIS; while the precipitation over Scandinavia appears to be sensitive to the LIS height, the precipitation anomaly over the Barents and Kara seas mainly appears to result from the LIS albedo ef-fect and is rather insensitive to height.
3.2.2 Large-scale vs. convective precipitation
P. Beghin et al.: North American ice sheet influence on the Eurasian climate 1477
Figure 9.(shaded) and position of the North Atlantic jet stream without LIS (dashed) and for thexxdhL experiment (solid line). Right column: summer precipitation (shaded) and snowfall (contour every 0.1 mm day−1, blue contour for positive values).
that the Scandinavian precipitation, as expected, is driven by large-scale processes.
The negative anomaly of precipitation appearing in the Arctic Ocean north of the Barents–Kara area (Fig. 6) is also clearly visible in the large-scale component (Fig. 7); by con-trast, the large negative precipitation anomaly south of the Novaya Zemlya clearly arises from convective processes. Over the Barents–Kara area, the origin of the precipitation
signal is less clear but seems to be a combination of both convective and large-scale processes. The decrease of con-vective precipitation negative anomaly (with respect to noIS) over the entire SBK sector when the LIS is higher can be easily explained by the weakening of the summer cooling discussed in section 3.1.
ex--0.5 -0.3 -0.1 0.1 0.3 ∆precipDJ Fin (mm/day)
-7 -6 -5 -4 -3 -2 -1 0 1 2 3 ∆ p o sJ etD J F in (latitude)
y = 10.11 * x + -1.33 r2 = 0.9628 p-value = 0.0000
Figure 10.850 hPa winter jet-stream shift (in latitude) vs. winter precipitation anomaly over the Scandinavian region. The range of results has been obtained by bootstrapping. Up and down trian-gles represent the 5th precipitation percentile vs. the 95th jet po-sition percentile, and the 95th precipitation percentile vs. the 5th jet position percentile respectively. Circles are the average values and crosses indicate the 5th and 95th percentiles.
amine the seasonality of precipitation. We first compute the average precipitation above Scandinavia (55–70◦
N : 0– 20◦
E) (Fig. 8a) and the Barents–Kara region (65–90◦
N : 20– 100◦
E) (Fig. 8b), then we compare summer and winter pre-cipitation anomalies with the annual prepre-cipitation anomaly. Results displayed in Figure 8 show that over Scandinavia winter precipitation changes are clearly correlated with an-nual precipitation (r=0.99). This means that the annual
sig-nal observed over Scandinavia (Figs. 6 and 7) is mainly due to winter precipitation. Conversely, the Barents–Kara sector is rather governed by summer precipitation (at least for LIS altitudes up to 60 % of the PMIP3 one), as shown by the pos-itive correlation (r=0.98) obtained for the summer season (Fig. 8b).
3.2.3 Precipitation changes over Scandinavia: implication of the jet stream shift
We therefore look for a mechanism prevailing in winter to explain the Scandinavian precipitation differences. Using the PMIP3 model outputs for the LGM and the PI time slices, Beghin et al. (2015) found a correlation between the south-ward shift of the North Atlantic jet stream from the pre-industrial to the LGM periods and the winter precipitation changes over the Iberian Peninsula. Following the same ap-proach, we examine whether a similar mechanism to the one found in (Beghin et al., 2015) may explain the precipita-tion changes over Scandinavia when the LIS characteristics (albedo and topography) are modified.
30 40 50 60 70
-200 -150 -100 -50 0 50 100
500 hPa geopotential anomaly
noIS 00dhL 30dhL 60dhL 100dhL
30 40 50 60 70
-100 -50 0 50 100 150 200 250
500 hPa geopotential anomaly
30 40 50 60 70
latitude 0 5 10 15 20 25 30
500 hPa zonal wind
East Laurentide sector
Atlantic sector
Atlantic sector East Laurentide sector
Atlantic sector
Atlantic sector East Laurentide sector
Atlantic sector
Atlantic sector East Laurentide sector
Atlantic sector
Atlantic sector East Laurentide sector
Atlantic sector
Atlantic sector East Laurentide sector
Atlantic sector
Atlantic sector East Laurentide sector
Atlantic sector
Atlantic sector East Laurentide sector
Atlantic sector
Atlantic sector East Laurentide sector
Atlantic sector
Atlantic sector East Laurentide sector
Atlantic sector
Atlantic sector East Laurentide sector
Atlantic sector
Atlantic sector East Laurentide sector
Atlantic sector
Atlantic sector East Laurentide sector
Atlantic sector
Atlantic sector East Laurentide sector
Atlantic sector
Atlantic sector East Laurentide sector
Atlantic sector
Atlantic sector
Figure 11.Meridional cross sections of the 500hPa geopotential height anomaly from zonal means over the East Laurentide (90– 60◦W, top panel) and the Atlantic sectors (50–10◦W, middle) in meters, and of the 500 hPa zonal wind (in m s−1) for the Atlantic sector.
Similarly to Chavaillaz et al. (2013), we use the 850 hPa zonal wind to define the jet stream. The position of the jet displayed in Fig. 9 corresponds to the position of the 850 hPa meridional wind maximum. The LIS albedo effect induces a slight northward shift (with respect to noIS) of the North Atlantic jet stream (00dhL-noIS panel). As the LIS becomes higher, the jet moves progressively southward and shifts southward of its noIS position between 30 and 60dhL. From 60dhL and beyond, the Scandinavian winter precipi-tation anomaly becomes more and more negative. This sug-gests a relationship between the shift of the North Atlantic jet stream and the precipitation over the Scandinavian region.
P. Beghin et al.: North American ice sheet influence on the Eurasian climate 1479
Figure 12.(a)Snow accumulation computed by the GRISLI ice-sheet model for the noIS experiment (top panel), and differences of snow accumulation between thexxdhL and the noIS experiments (in m yr−1).(b)same as(a)for the ablation (in m yr−1).
1ϕis defined as the difference of latitudes between noIS and xxdhL experiments where the 850 hPa zonal wind is at its highest value. The latitude of this maximum has been found by computing the zonal mean of the zonal wind over the At-lantic basin (50–10◦W). To minimize the uncertainties due
to model discretization, we used a parabolic interpolation around the grid point where the mean zonal wind is largest. The maximum of the corresponding parabola yields a better approximation of the exact latitude of the maximum jet wind. This method allows for a more accurate finding of the lati-tude of the jet maximum (Chavaillaz et al., 2013; Beghin et
Figure 13.(a)Surface mass balance at the beginning of the simulation (in m yr−1) and(b)surface elevation at the end of the simulation
computed by the ice-sheet model for the selected experiments (in meters).
and the winter precipitation changes over Scandinavia due to the effect of LIS.
The 500 hPa geopotential height (z500) zonal anomaly over the East Laurentide sector (90–60◦
W) does not change significantly when a flat LIS is imposed (Figs. 5, 11). As the LIS gets higher, the Labrador trough expands southward: Fig. 11 shows that the zero isoline is located at∼43◦
N in the noIS and 00dhL experiments and progressively reaches 37◦
N for a full-LGM LIS. Over the Atlantic sector (50– 10◦
W) the Icelandic low/Azores high pattern remain similar in all experiments up to 60dhL and only show a significant change in the full LIS experiment (Figs. 5, 11). Indeed, in 100dhL, the Icelandic low’s amplitude weakens but simul-taneously expands southward (Fig. 11). Consistently with these changes in thez500 zonal anomaly, the 500 hPa
west-erlies shift southward over the whole Atlantic sector (Fig. 11, bottom). Again, the largest southward shift for this variable is between the 60 and 100dhL experiments, showing the non-linearity of the atmospheric circulation to the LIS height.
P. Beghin et al.: North American ice sheet influence on the Eurasian climate 1481
-15 -13
-11 -9
-7 -5
-3 -1
1 3
5 7
9 11
13 15 a) 00dhL
2m temperature
b) 00dhLFIS
d) 100dhLFIS c) 100dhL
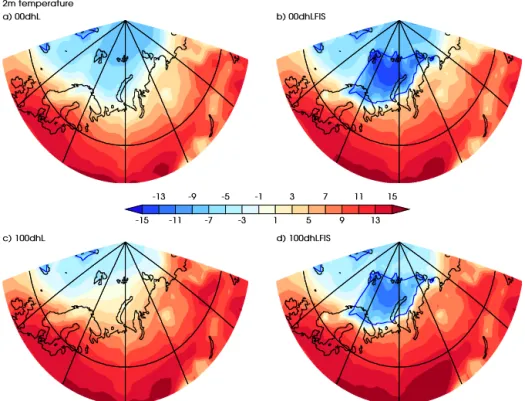
Figure 14.Summer 2 m temperatures for the(a)00dhL (flat LIS, no FIS) experiment,(b)00dhLFIS (flat LIS, high FIS),(c)100dhL (high LIS, no FIS) and(d)100dhLFIS (high LIS, high FIS). The extents of the ice sheets (blue contours) are superimposed on right panels for 00100 and 100dhLFIS runs.
-1 -0.8
-0.6 -0.4
-0.2 -0.1
0.1 0.2
0.4 0.6
0.8 1 a) 00dhL
Integrated Meridional heat transport and Integrated horizontal heat transport
5
b) 00dhLFIS
d) 100dhLFIS c) 100dhL
Figure 16.Same as Fig. 14 for the 850 hPa meridional wind (shaded) and the 850hPa horizontal winds (arrows) for the summer season (in m s−1).
altitude in response to warmer temperatures (Fig. 3). Con-versely, the summer snowfall amount decreases from 00 to 100dhL due to the progressive lowering of the fraction of solid vs. liquid precipitation.
3.3 Summary
To summarize, the LIS albedo effect induces colder summer temperatures over the entire northwestern Eurasian region (SBK area) with respect to the noIS experiment. Over south-ern Scandinavia, the winter temperatures (Fig. 3) are warmer due to weaker northerlies (Fig. 5). More precipitation is also simulated in winter in response to the poleward shift of the North Atlantic jet stream (Fig. 6). As the Barents–Kara sec-tor is dominated by the summer signal, less precipitation is simulated in response to colder summer temperatures (with respect to noIS), while a larger snowfall amount is obtained. When the LIS gets higher, the negative anomaly of sum-mer temperatures over the Barents–Kara region becomes weaker due to changes in the atmospheric circulation. In ad-dition, the higher the LIS, the smaller the amounts of an-nual precipitation and snowfall over the Scandinavian and the Barents–Kara areas, in response to the equatorward shift of the jet.
4 What is the influence of the LIS on the growth of the FIS?
4.1 In case of no initial Fennoscandian ice sheet
What are the impacts of the LIS on the surface mass bal-ance of both Scandinavian and Barents–Kara areas? To in-vestigate this question, we use the LMDZ5 monthly temper-atures and precipitation fields of each experiment to force the ice-sheet model GRISLI. LMDZ5 climatic fields are down-scaled over the GRISLI grid using a bilinear interpolation. Due to the difference of resolution between the atmospheric and the ice-sheet models, temperature is vertically corrected using a linear vertical gradient of 6 K km−1. Precipitation is also vertically corrected using an exponential function of the temperature (Charbit et al., 2002, 2007). Snowfall is recalcu-lated using the downscaled precipitation and temperature be-cause the more detailed topography of GRISLI allows snow-fall when LMDZ5 provides only liquid precipitation.
P. Beghin et al.: North American ice sheet influence on the Eurasian climate 1483
a) 00dhLFIS − 00dhL b) 00dhL − 100dhL
c) 100dhLFIS − 100dhL d) 00dhLFIS − 100dhLFIS
−0.200 −0.150 −0.100 −0.050 −0.025 −0.010 0.010 0.025 0.050 0.100 0.150 0.200
Figure 17.Differences in snow accumulation (in m yr−1) computed by the GRISLI ice-sheet model between(a)00dhLFIS and 00dhL
experiments(b)00dhLFIS and 100dhL experiments,(c)100dhLFIS and 100dhL experiments and(d)00 and 100dhLFIS experiments.
(Fig. 3), when the LIS is flat, the ablation is weaker over the entire SBK region, and increases as the LIS gets higher. Nev-ertheless, even with the full-LGM LIS, the ablation remains weaker than in the noIS experiment.
The resulting surface mass balance is shown in Fig. 13a. The similarities between the ablation (Fig. 12b) and the sur-face mass balance patterns indicate that the sursur-face mass bal-ance is dominated by the ablation. In the absence of LIS, the surface mass balance is positive over only a small part of the SBK area, namely over Svalbard. Under these conditions, no ice sheet grows (Fig. 13b). When the LIS is flat, the surface mass balance is positive over the Barents and Kara seas and over the northern part of Scandinavia, allowing the growth of ice. The resulting FIS is less extended than those provided by the ICE-6G (Toscano et al., 2011) and the ANU (Lam-beck, 2001) reconstructions. This is likely due to the absence of the albedo feedback, since our approach is not based on a full coupling method and does not allow to account for the impact of ice-sheet changes onto the climate. As the LIS gets higher, the limit of the positive surface mass balance shifts westward and northward, excluding the Kara Sea and Scan-dinavia from the positive surface-mass balance area. When the LIS has its full LGM size, the surface mass balance is positive only over the Svalbard. As a consequence, the simu-lated FIS is smaller.
4.2 What if the Fennoscandian ice sheet is initially high? The aim of this study is not to provide a fully realistic sce-nario of the evolution of the ice sheets throughout an entire glacial cycle. Rather, based on idealized cases, it is to
inves-tigate the impact of the Laurentide ice sheet on the Eurasian ice sheet surface mass balance. In the first part of this study, we have shown that the growth of the LIS prevents the de-velopment of the FIS. However, back to a more realistic con-text in which both ice sheets co-evolved, the relevance of this conclusion may be questioned and the issue of the FIS incep-tion under full LGM LIS condiincep-tions may appear somehow ar-tificial. Thus, to make our previous conclusions more robust, we perform two additional LMDZ experiments with new ice-sheet boundary conditions. In both simulations, the FIS has the elevation computed by the ice-sheet model for the 00dhL run (i.e. the largest FIS elevation of all the GRISLI experi-ments), while the LIS is either “flat” (00dhLFIS) or has its full LGM altitude (100dhLFIS). Here, our objective is to test the self-consistency of the overall study, by checking that the growth of the FIS is slowed down when the LIS gets higher. We first examine how a high FIS modifies the northwest-ern Eurasian climate under 00 and 100dhL conditions (i.e. with flat or full LGM LIS ice sheet), in terms of the temper-ature and precipitation fields used in our modeling approach to compute the ice-sheet surface mass balance. We then use the climatic outputs to force the ice-sheet model.
4.2.1 Response of the atmosphere
sum-Figure 18.Same as Fig. 14 for the precipitation (mm day−1) and 850 hPa horizontal winds in winter.
mer temperature. As expected, the presence of Fennoscan-dia induces a large cooling over the ice sheet itself, due to the temperature–altitude relationship and to the albedo ef-fect. In previous sections, we have shown that the cooling observed over the Barents–Kara region is weakened when the LIS gets higher due to a modification of the large-scale atmo-spheric circulation (Figs. 3–4). A similar mechanism is ob-served when the Fennoscandian ice sheet is high (100dhLFIS experiment): the cooling over the ice sheet is reduced and the warming along the southern margin is amplified (Fig. 14d vs. 14b). These features result from an increase of warm air advection in the Barents–Kara sector and to a decrease of northerly heat flux in the south. The presence of the FIS also induces a split of the North Atlantic jet stream in two branches resulting in northward deflected heat fluxes along the western margin of the ice sheet and the Barents Sea sec-tor (Figs. 15b, d and 16b, d). The heat advection modulates the ice-sheet altitude and albedo effects but is not sufficient to cancel out the cooling observed over the ice sheet.
Figure 17 displays maps of snow accumulation differences (after downscaling on the GRISLI grid) between the four ex-periments computed by GRISLI after downscaling. The pres-ence of the Fennoscandian ice sheet results in an increase of precipitation and snow accumulation over its western flank, along the Norwegian Sea coast (Fig. 17a, c). This is due to the barrier effect of the ice sheet and to the subsequent in-crease of the vertical wind. This effect is less pronounced
when the LIS is high (Fig. 17c) as a result of the southward displacement of the North Atlantic jet stream (Figs. 6, 11). A second striking feature is the increase of snow accumulation in the southern part of the Eurasian ice sheet with respect to the no FIS situation. This is mainly due to colder tem-peratures over the ice sheet, increasing the fraction of total precipitation which falls as snow. In case of a flat LIS, this accumulation zone is confined to the southern margin and drier conditions (with respect to the noFIS case) in the in-terior of the Eurasian ice sheet are observed, mainly located over the Kara Sea (Fig. 17a), and likely due to the strong barrier effect. By contrast, when the LIS is high (Fig. 17c), differences between FIS and no FIS experiments are larger and expand over more than the southern half of the FIS. This coincides with a larger temperature difference over the FIS area when the LIS is high (Figs. 14c, d) compared to the low LIS situation (Fig. 14a, b).
P. Beghin et al.: North American ice sheet influence on the Eurasian climate 1485
00dhLFIS − 100dhLFIS
−1000 −500 −250 −100 −50 −5 5 50 100 250 500 1000
Figure 19.Difference of simulated ice thickness of the Eurasian ice sheet between 00d and 100dhLFIS after 100 kyr (in meters).
the 00 and 100dhLFIS experiments are mainly located over the western and southeastern parts of the ice sheet with re-spectively larger and smaller snowfall amounts simulated in the 00dhLFIS experiment (with respect to 100dhLFIS). The excess of precipitation (total and solid) in the flat LIS/high FIS case is a direct consequence of the increase of both zonal and meridional humidity transports in winter (not shown) favored by the enhanced strength of the 850 hPa horizontal winds (Fig. 18).
4.2.2 Consequences on the simulated Eurasian ice sheets
The climatic outputs simulated in the 00 and 100dhLFIS ex-periments have been used to compute the surface mass bal-ance of the Eurasian ice sheet at the GRISLI resolution and to force the ice-sheet model with the downscaling procedure described in Sect. 4.1. Starting from the initial state pro-vided by the 00dhL GRISLI run with flat (00dhLFIS) or full LGM LIS (100dhLFIS), GRISLI has been integrated during 100 kyr. At the end of the simulation, the simulated ice vol-ume and ice covered area simulated in the 00dhLFIS exper-iment are respectively 10 and 11 % greater than those ob-tained with the 100dhLFIS simulation. The differences in simulated ice thickness between both simulations are dis-played in Fig. 19 (00–100dhLFIS). In most parts of the sim-ulated ice covered areas, ice thickness differences are fully consistent with the snow accumulation signal (Fig. 17). In particular, large positive anomalies (> 500 m) are found in the southwestern sector, that are greater than 1000 m near the ice sheet margin. In the northern part, lower ice thicknesses obtained in the 00dhLFIS experiment correspond to the area of lower snow accumulation (with respect to 100dhLFIS), as ablation is very small due to summer temperatures largely
below 0◦
C. Surprisingly, another large positive difference is found in the eastern part which is characterized by a lower amount of snow accumulation in case of flat LIS. (with re-spect to full LIS). This pattern results from warmer tem-peratures simulated in the southern and eastern parts of the 100dhLFIS Eurasian ice sheet in response to the decrease of cold air advection (see Sect. 4.2.1). Warmer temperatures found in the south and east of the FIS when the LIS has its full LGM size favor the westward and the northward retreats of the eastern and southern margins of the ice sheet. Since our approach does not account for the feedback of the simu-lated ice sheets on the climate, the amplitude of the different responses are likely to be underestimated due to an under-estimation of the albedo effect. However, this analysis con-firms that the growth of the FIS is slowed down when the LIS is high and demonstrates the self-consistency of the overall study.
5 Discussion
5.1 Glaciation scenario
Kleman et al. (2013) combined geological evidences and numerical modeling to reconstruct the paleotopography of past Northern Hemisphere ice sheets during MIS5b (∼86 kyr), and MIS4 (∼64 kyr) and 2 (LGM). They found that the LIS and the FIS grow in concert in the early part of the last glacial cycle (i.e. until MIS5b), while after MIS4, their evolution is radically different with a further growth of the LIS and a significant shrinkage of the FIS due to its southwestward retreat towards the main precipitation sources.
Löfverström et al. (2014) propose to attribute the westward shift of the FIS and the decrease of the Kara ice sheet to warm temperatures over the southeastern part of the Fennoscandian region, induced by the FIS itself, along with the upslope pre-cipitation effect proposed by Sanberg and Oerlemans (1983). In their study, the LIS exerts only a small influence on the re-treat of the Kara ice sheet. While Löfverström et al. (2014) used realistic LIS topographies provided by the Kleman’s et al. (2013) reconstructions, we used idealized geometries to study separately the impact of the LIS albedo and topography on climate. The results of our first series of xxdhL experi-ments clearly show that a large but low LIS favors a positive SMB over the SBK sector (Fig. 13, left panels) and therefore the FIS maintenance (Fig. 13, right panels). By contrast, as the LIS gets higher, ablation increases, leading to a smaller FIS. Back to a more realistic glacial context in which both North American and Eurasian ice sheets exist (xxdhLFIS ex-periments), we also simulate a net decrease of snow accumu-lation under full LGM LIS conditions (with respect to flat LIS) over the Kara sector combined with an increase over the western part of FIS (Fig. 17d), consistently with the up-slope precipitation effect proposed by Sandberg and Oerle-mans (1983). The large positive SMB values over the SBK sector when the LIS is low combined with the westward dis-placement of the Eurasian ice sheet as the LIS gets higher are fully in line with the ice-sheet paleotopography reconstruc-tions provided by Kleman et al. (2013) for the last glacial cy-cle. The remote interactions highlighted in the present study between the LIS and the FIS systems also suggest that the ab-lation increase over the Barents and Kara seas when the LIS has its LGM size may have contributed to the LGM FIS small size. Conversely, the larger size of the FIS (Svendsen et al., 2004) during the late Saalian (around 140 ka) with respect to the LGM may have been related to a smaller LIS.
The remote interactions highlighted in the present study between the LIS and the FIS systems also suggest that the larger size of the FIS (Svendsen et al., 2004) during the late Saalian (around 140 ka) with respect to the LGM may have been related to a smaller LIS.
Nevertheless, we must keep in mind that all experiments presented in this study have used the LGM land–sea mask and therefore the Barents–Kara region is considered to be a continental area. The consequences of this assumption on the simulated large-scale atmospheric circulation are likely to be negligible. However, accounting for a marine Barents–
Kara area would decrease the positive albedo feedback in this region, and thus the FIS inception (see Sect. 3.1.1). Our experimental setup uses LGM SST and sea-ice boundary conditions provided by the coupled atmosphere–ocean IPSL model (Kageyama et al., 2013). This prevents us from study-ing the conditions that could have prevailed with a marine Barents–Kara area, because this sector was covered by the FIS in this run, and future studies will be necessary to fur-ther investigate the relationships between the LIS and the FIS within more realistic contexts.
5.2 Ocean–atmosphere interactions
Our experimental setup has been designed to investigate how the atmospheric circulation changes in response to the LIS albedo and topography effects may impact the climate over the Eurasian region and therefore the evolution of the sur-face mass balance of the Fennoscandian ice sheet. We have therefore neglected the potential impact of the ocean and of its interactions with the atmosphere
Yet, changes in atmospheric circulation related to the pres-ence of continental ice sheets may induce large modifications of the oceanic circulation. For example, Wunsch (2006) pro-posed a scenario in which phase shifts of the stationary waves caused by the development of ice sheets modify the wind di-rection and strength leading to abrupt changes in tempera-ture and precipitation fields (and thus to climatic events hav-ing similar features as Dansgaard-Oeschger events). These changes eventually produce large-scale modifications of the oceanic circulation. In turn, any change in the large-scale oceanic circulation may influence the evolution of the North-ern Hemisphere ice sheets as well as their mutual interactions through the atmosphere–ocean coupling.
grad-P. Beghin et al.: North American ice sheet influence on the Eurasian climate 1487
ually increases well supports the existence of the southern branch as shown in Zhang et al. (2014) for the LGM, but their northern branch remains absent from our all simulations.
Actually, this comparison illustrates the diversity of model responses to changes in the LIS characteristics. The recent inter-comparison study of the North Atlantic jet stream in LGM vs. pre-industrial conditions in the PMIP3 coupled models (Braconnot et al., 2012) carried out by Beghin et al. (2015) clearly shows that the response of the jet stream to LGM conditions is highly model-dependent. This latter study confirms the range of various results found in the recent liter-ature. Using the outputs of four comprehensive atmosphere– ocean models, Laîné et al. (2009) found a southward dis-placement of the North Atlantic jet stream under LGM con-ditions. A similar conclusion can be drawn from the study of Ullman et al. (2014) carried out with the GISS model and two different LIS topographies as LGM ice-sheet boundary conditions: the difference of the simulated jet speed obtained with these different LIS reconstructions (see their Fig. 2) shows a more southward position of the jet when the LIS is higher. As was found in our study, Löfverström et al. (2014) found an equatorward position of the winter zonal winds and a more zonal jet under LGM conditions (with respect to MIS5b and MIS4). On the contrary, Roberts et al. (2014) found that a more zonal structure is simulated with the FA-MOUS model after the occurrence of a Heinrich event, which in their experimental set-up corresponds to a decrease of the Laurentide ice thickness. This indicates a southward shift of the North Atlantic jet stream when the LIS altitude is lower, and, by contrast, a northward displacement when it is higher. Besides these contrasted findings, other studies did not find any significant influence of the ocean on the atmospheric circulation. As an example, by using the coupled IPSL-CM4 model, Pausata et al. (2011) showed that the position of the North Atlantic jet stream is not substantially influenced by sea-surface temperatures or sea-ice cover, but rather by ice-sheet height. In the same way, using the CAM3 atmospheric model coupled to a slab ocean, Löfverström et al. (2014) did not find any significant changes in the simulated tempera-ture patterns over Alaska, Asia and the North Atlantic sector when two different oceanic heat transports corresponding to interglacial and LGM conditions are used.
The variety of the model responses calls for further stud-ies to investigate why the results are so model-dependent. It also underlines the need for a more in-depth investigation of the links between large-scale oceanic and atmospheric circu-lations with different models run under climatic conditions rather different from those of the present-day periods.
6 Conclusions
The goal of this study was to investigate the atmospheric pro-cesses through which the LIS can influence the northwest-ern Eurasian climate, and therefore how it can influence the
FIS surface mass balance. We performed 12 simulations un-der LGM conditions, but with different ice-sheet configura-tions. In our baseline experiment, the LIS and the FIS are removed. In the first set of simulations, we only removed the FIS, and the LIS has different heights. In the final series of experiments, we considered the impact of the LIS height on a high FIS. We therefore identified the effect of the LIS albedo and topography on the northwestern European climate. We focused on the fields having an impact on ice-sheet surface mass balance, i.e. the temperature and the precipitation. We showed the following:
1. The LIS albedo acts to decrease the summer temper-atures over the Fennoscandian sector. This decrease is amplified by positive snow albedo feedback. This pos-itive feedback is somewhat related to our experimental setup, which imposes land over the Barents–Kara sector instead of water, allowing snow maintenance. The tem-perature decrease is weaker when the LIS is higher, due to atmospheric circulation changes.
2. In winter, the LIS albedo impact decreases the Barents– Kara temperature, but increases the Scandinavian tem-perature. The higher the LIS, the colder the temperature over the whole Fennoscandian sector.
3. The effect of LIS albedo also tends to shift the North Atlantic jet stream poleward, and to bring more precip-itation and snowfall over Scandinavia. When the LIS is higher, the Atlantic jet shifts equatorward, bringing less precipitation over northern Europe. As a consequence, precipitation and snowfall decrease over Scandinavia and Barents–Kara sectors when the LIS is higher.
4. The analysis of the GRISLI simulations forced by the LMDZ precipitation and temperature fields shows that the LIS albedo favors the growth of the FIS, essentially because of weak ablation. As the LIS gets higher, the FIS gets smaller due to more ablation, in accordance with the LMDZ5 summer temperature response. When the LIS reaches its full-LGM size, ice remains over Svalbard only.
5. Within the context of glacial-interglacial cycles, the FIS inception under full-LGM LIS conditions appears to be unrealistic. Therefore, we performed additional simula-tions with a high FIS and flat and full-LGM LIS. The results of these new sensitivity experiments show a sim-ilar response to the first series of experiments: in the presence of a full LIS, the FIS undergoes a significant mass loss. This confirms that a large LIS counteracts the growth of the FIS although it is still maintained, such as it does within more realistic contexts, and highlights therefore the self-consistency of the overall study.
the ice-sheet model allows for the quantification of the impact of climatic changes due to the LIS presence on the FIS. It shows that the albedo of the LIS favors the FIS growth, whereas the LIS topography acts against the FIS development. This conclusion is reinforced by the results obtained with a high FIS. It is worth noting that without a transient simulation of the last glacial pe-riod, it is not possible to accurately elaborate the lead– lag relationships of the Northern Hemisphere ice sheets during the last glacial period. However, based on our results, a plausible glaciation scenario can be proposed with an early phase of FIS glacial inception favored by the areal expansion of the LIS, and followed by a lim-ited growth of the FIS with a progressive westward re-treat of the FIS itself as the LIS altitude gradually in-creased. Such proposed relationships between ice-sheet build-up demonstrate that this study also provides new insights in the understanding of the various Northern Hemisphere ice-sheet configurations during the differ-ent glacial–interglacial cycles.
Acknowledgements. The authors would like to thank Daniel Lunt, Francis Codron, David Salas-y-Mélia and Hu-bert Gallée for fruitful discussions about this work. They are also very grateful to G.Lohmann as well as to two anonymous reviewers for their constructive comments and suggestions that helped to im-prove the quality and the clarity of this manuscript. Pauline Beghin received a grant from CEA (Commissariat à l’Energie Atomique et aux Energies Alternatives) and this work was supported by the Université Versailles-Saint-Quentin. This work also benefited from the HPC resources of CCRT made available by GENCI (Grand Equipement National de Calcul Intensif), CEA and CNRS (Centre National de la Recherche Scientifique).
Edited by: G. Lohmann
References
Abe-Ouchi, A., Saito, F., Kageyama, M., Braconnot, P., Harrison, S. P., Lambeck, K., Otto-Bliesner, B. L., Peltier, W. R., Tarasov, L., Peterschmitt, J.-Y., and Takahashi, K.: Ice-sheet configuration in the CMIP5/PMIP3 Last Glacial Maximum experiments, Geosci. Model Dev. Discuss., 8, 4293–4336, doi:10.5194/gmdd-8-4293-2015, 2015.
Andersen, B. G. and Mangerud, J.: The last interglacial-glacial cy-cle in Fennoscandia, Quatern. Int., 3, 21–29, 1989.
Beghin, P., Charbit, S., Dumas, C., Kageyama, M., Roche, D. M., and Ritz, C.: Interdependence of the growth of the Northern Hemisphere ice sheets during the last glaciation: the role of at-mospheric circulation, Clim. Past, 10, 345–358, doi:10.5194/cp-10-345-2014, 2014.
Beghin, P., Charbit, S., Kageyama, M., Combourieu-Nebout, N., Hatte, C., Dumas, C., and Peterschmitt, J.-Y.: What drives LGM precipitation over the Western Mediterranean? A study focused on the Iberian peninsula and northern Moroco, Clim. Dynam., doi:10.1007/s00382-015-2720-0, in press, 2015.
Berger, A.: Long-term variations of daily insolation and quaternary climatic changes, J. Atmos. Sci., 35, 2362–2367, 1978. Braconnot, P., Otto-Bliesner, B., Harrison, S., Joussaume, S.,
Pe-terchmitt, J.-Y., Abe-Ouchi, A., Crucifix, M., Driesschaert, E., Fichefet, Th., Hewitt, C. D., Kageyama, M., Kitoh, A., Laîné, A., Loutre, M.-F., Marti, O., Merkel, U., Ramstein, G., Valdes, P., Weber, S. L., Yu, Y., and Zhao, Y.: Results of PMIP2 coupled simulations of the Mid-Holocene and Last Glacial Maximum – Part 1: experiments and large-scale features, Clim. Past, 3, 261– 277, doi:10.5194/cp-3-261-2007, 2007.
Braithwaite, R. J.: Calculation of degree-days for glacier-climate research, Zeitschrift für Gletscherkunde und Glazialgeologie, 20, 1–18, 1984.
Braithwaite, R. J.: Positive degree-day factors for ablation on the Greenland ice sheet studies by energy-balance modelling, J. Glaciol., 41, 153–160, 1995.
Broccoli, A. J. and Manabe, S.: The influence of continental ice, at-mospheric CO2, and land albedo on the climate of the last glacial
maximum, Clim. Dynam., 1, 87–99, 1987.
Charbit, S., Ritz, C., and Ramstein, G.: Simulations of Northern Hemisphere ice-sheet retreat: sensitivity to physical mechanisms involved during the Last Deglaciation., Quaternary Sci. Rev., 21, 243–265, 2002.
Charbit, S., Ritz, C., Philippon, G., Peyaud, V., and Kageyama, M.: Numerical reconstructions of the Northern Hemisphere ice sheets through the last glacial-interglacial cycle, Clim. Past, 3, 15–37, doi:10.5194/cp-3-15-2007, 2007.
Chavaillaz, Y., Codron, F., and Kageyama, M.: Southern westerlies in LGM and future (RCP4.5) climates, Clim. Past, 9, 517–524, doi:10.5194/cp-9-517-2013, 2013.
Clark, P. U.: Northern Hemisphere Ice-Sheet Influences on Global Climate Change, Science, 286, 1104–1111, 1999.
Clark, P. U., Clague, J. J., Curry, B. B., Dreimanis, A., Hicock, S. R., Miller, G. H., Berger, G. W., Eyles, N., Lamothe, M., Miller, B. B., Mott, R. J., Oldale, R. N., Stea, R. R., Szabo, J. P., Thor-leifson, L. H., and Vincent, J.-S.: Initiation and developement of the Laurentide and Cordilleran ice sheets following the last inter-glaciation, Quaternary Sci. Rev., 12, 79–114, 1993.
Dufresne, J. L., Foujols, M. A., Denvil, S., Caubel, A., Marti, O., Aumont, O., Balkanski, Y., Bekki, S., Bellenger, H., Benshila, R., Bony, S., Bopp, L., Braconnot, P., Brockmann, P., Cadule, P., Cheruy, F., Codron, F., Cozic, A., Cugnet, D., De Noblet, N., Duvel, J. P., Ethé, C., Fairhead, L., Fichefet, T., Flavoni, S., Friedlingstein, P., Grandpeix, J. Y., Guez, L., Guilyardi, E., Hauglustaine, D., Hourdin, F., Idelkadi, A., Ghattas, J., Jous-saume, S., Kageyama, M., Krinner, G., Labetoulle, S., Lahel-lec, A., Lefebvre, M. P., Lefevre, F., Levy, C., Li, Z. X., Lloyd, J., Lott, F., Madec, G., Mancip, M., Marchand, M., Masson, S., Meurdesoif, Y., Mignot, J., Musat, I., Parouty, S., Polcher, J., Rio, C., Schulz, M., Swingedouw, D., Szopa, S., Talandier, C., Terray, P., Viovy, N., and Vuichard, N.: Climate change projections us-ing the IPSL-CM5 Earth System Model: from CMIP3 to CMIP5, Clim. Dynam., 40, 2123–2165, 2013.
Dyke, A. S. and Prest, V. K.: Late Wisconsinan and Holocene re-treat of the Laurentide ice sheet, Geological Survey of Canada, Ottawa, Ontario Map 1702A, scale 1701 : 500000, 1987. Ehlers, J., Eissmann, L., Lippstreu, L., Stephan, H.-J., and Wansa,
P. Beghin et al.: North American ice sheet influence on the Eurasian climate 1489
Fausto, R. S., Ahlström, A. P., Van As, D., Johnsen, S., Langen, P. L., and Steffen, K.: Improving surface boundary conditions with focus on coupling snow densification and meltwater retention in large-scale ice-sheet models of Greenland, J. Glaciol., 55, 869– 878, 2009.
Hall, N. M. J., Valdes, P. J., and Dong, B.: The maintenance of the last great ice sheets: A UGAMP GCM study, J. Climate, 9, 1004– 1019, 1996.
Houmark-Nielsen, M.: A lithostratigraphy of Weichselian glacial and interstadial deposits in Denmark, B. Geol. Soc. Denmark, 46, 101–114, 1999.
Hourdin, F., Musat, I., Bony, S., Braconnot, P., Codron, F., Dufresne, J.-L., Fairhead, L., Filiberti, M.-A., Friedlingstein, P., Grandpeix, J.-Y., Krinner, G., LeVan, P., Li, Z.-X., and Lott, F.: The LMDZ4 general circulation model: climate performance and sensitivity to parametrized physics with emphasis on tropical convection, Clim. Dynam., 27, 787–813, 2006.
Hourdin, F., Foujols, M.-A., Codron, F., Guemas, V., Dufresne, J.-L., Bony, S., Denvil, S., Guez, J.-L., Lott, F., Ghattas, J., Braconnot, P., Marti, O., Meurdesoif, Y., and Bopp, L.: Impact of the LMDZ atmospheric grid configuration on the climate and sensitivity of the IPSL-CM5A coupled model, Clim. Dynam., 40, 2167–2192, doi:10.1007/s00382-012-1411-3, 2013.
Hutter, K.: Theoretical Glaciology. Material Science of Ice and The Mechanics of Glaciers and Ice Sheets, D. Reidel Publishing Company, Dordrecht, the Netherlands, 1983.
Kageyama, M. and Valdes, P.: Impact of the North American ice-sheet orography on the Last Glacial Maximum eddies and snow-fall, Geophys. Res. Lett., 27, 1515–1518, 2000.
Kageyama, M., Braconnot, P., Bopp, L., Caubel, A., Foujols, M.-A., Guilyardi, E., Khodri, M., Lloyd, J., Lombard, F., Mariotti, V., Marti, O., Roy, T., and Woillez, M.-N. e.: Mid-Holocene and Last Glacial Maximum climate simulations with the IPSL model-part I: comparing IPSL-CM5A to IPSL-CM4, Clim. Dynam., 40, 2447–2468, 2013.
Kasahara, A.: Computational aspects of numerical models for weather prediction and climate simulation, in: Methods in com-putational physics, edited by: Chang, J., vol. 17, 1–66, Academic Press, Inc., Amsterdam, 1977.
Kleman, J., Fastook, J., Ebert, K., Nilsson, J., and Caballero, R.: Pre-LGM Northern Hemisphere ice sheet topography, Clim. Past, 9, 2365–2378, doi:10.5194/cp-9-2365-2013, 2013. Laîné, A., Kageyama, M., Salas-Mélia, D., Voldoire, A., Rivière,
G., Ramstein, G., Planton, S., Tyteca, S., and Peterschmitt, J. Y.: Northern hemisphere storm tracks during the last glacial maxi-mum in the PMIP2 ocean-atmosphere coupled models: energetic study, seasonal cycle, precipitation, Clim. Dynam., 32, 593–614, doi:10.1007/s00382-008-0391-9, 2009.
Lambeck, K.: Sea Level Change Through the Last Glacial Cycle, Science, 292, 679–686, 2001.
Lambeck, K., Purcell, A., Funder, S., Kjaer, K., Larsen, E., and Möller, P.: Constraints on the Late Saalian to early Middle We-ichselian ice sheet of Eurasia from field data and rebound mod-elling, Boreas, 35, 539–575, 2006.
Landvik, J. Y., Bondevik, S., Elverhoi, A., Fjeldskaar, W., Mangerud, J., Salvigsen, O., Siegert, M. J., Svendsen, J. I., and Vorren, T. O.: The last Glacial Maximum of Svalbard and the Barents Sea area: ice sheet extent and configuration, Quaternary Sci. Rev., 17, 43–75, 1998.
Le Treut, H., Li, Z. X., and Forichon, M.: Sensitivity of the LMD general circulation model to greenhouse forcing associated with two different cloud water parameterizations, J. Climate, 7, 1827– 1841, 1994.
Le Treut, H., Forichon, M., Boucher, O., and Li, Z.-X.: Sulfate Aerosol Indirect Effect and CO2Greenhouse Forcing:
Equilib-riumResponse of the LMD GCM and Associated Cloud Feed-backs, J. Climate, 11, 1673–1684, 1998.
Liakka, J., Nilsson, J., and Löfverström, M.: Interactions between stationary waves and ice sheets: linear versus nonlinear atmo-spheric response, Clim. Dynam., 38, 1249–1262, 2011. Löfverström, M., Caballero, R., Nilsson, J., and Kleman, J.:
Evo-lution of the large-scale atmospheric circulation in response to changing ice sheets over the last glacial cycle, Clim. Past, 10, 1453–1471, doi:10.5194/cp-10-1453-2014, 2014.
Loulergue, L., Schilt, A., Spahni, R., Masson-Delmotte, V., Blu-nier, T., Lemieux, B., Barnola, J.-M., Raynaud, D., Stocker, T. F., and Chappellaz, J.: Orbital and millennial-scale features of atmospheric CH4over the past 800,000 years, Nature, 453, 383– 386, doi:10.1038/nature06950, 2008.
Lundqvist, J.: Glacial stratigraphy in Sweden, Geological Survey of Finland, Special Paper, 15, 43–59, 1992.
Lüthi, D., Le Floch, M., Bereiter, B., Blunier, T., Barnola, J.-M., Siegenthaler, U., Raynaud, D., Jouzel, J., Fischer, H., Kawamura, K., and Stocker, T. F.: High-resolution carbon dioxide concentra-tion record 650,000–800,000 years before present, Nature, 453, 379–382, 2008.
MacAyeal, D. R.: Large-scale ice flow over a viscous basal sedi-ment: Theory and application to ice stream B, Antarctica, J. Geo-phys. Res.-Sol. Ea., 94, 4071–4087, 1989.
Manabe, S. and Broccoli, A. J.: The influence of continental ice sheets on the climate of an ice age, J. Geophys. Res., 90, 2167– 2190, 1985.
Mangerud, J., Dokken, T., Hebbeln, D., Heggen, B., Ingolfsson, O., Landvik, J. Y., Mejdahl, V., Svendsen, J. I., and Vorren, T. O.: Fluctuations of the Svalbard-Barents Sea Ice Sheet during the last 150 000 years, Quaternary Sci. Rev., 17, 11–42, 1998. Morland, L., Smith G,. and Boulton G.: Basal sliding relations
de-duced from ice sheet data, J. Glaciol, 30, 131–139, 1984. Pausata, F. S. R., Li, C., Wettstein, J. J., Kageyama, M., and
Ni-sancioglu, K. H.: The key role of topography in altering North Atlantic atmospheric circulation during the last glacial period, Clim. Past, 7, 1089–1101, doi:10.5194/cp-7-1089-2011, 2011. Peltier, W. R.: Global glacial isostasy and the surface of the ice-age
Earth: the ICE-5G (VM2) model and GRACE, Annu. Rev. Earth Pl. Sc., 32, 111–149, 2004.
Peyaud, V., Ritz, C., and Krinner, G.: Modelling the Early We-ichselian Eurasian Ice Sheets: role of ice shelves and influence of ice-dammed lakes, Clim. Past, 3, 375–386, doi:10.5194/cp-3-375-2007, 2007.
Reeh, N.: Parameterization of melt rate and surface temperature on the Greenland ice sheet, Polarforschung, 59, 113–128, 1991. Ritz, C., Rommelaere, V., and Dumas, C.: Modeling the Antarctic
ice sheet evolution of the last 420 000 years: implication for alti-tude changes in the Vostok region, J. Geophys. Res., 106, 31943– 931964, 2001.
Last Glacial Maximum simulations, J. Climate, 23, 2987–3008, doi:10.1175/2010JCLI3372.1, 2010.
Roberts, W. H. G., Valdes, P. J., and Payne, A. J.: Topography’s crucial role in Heinrich events, P. Natl. Acad. Sci. USA, 111, 16688–16693, 2014.
Roe, G. H. and Lindzen, R. S.: The Mutual Interaction between Continental-Scale Ice Sheets and Atmospheric Stationary Waves, J. Climate, 14, 1450–1465, 2001a.
Roe, G. H. and Lindzen, R. S.: A one-dimensional model for the interaction between continental-scale ice sheets and atmospheric stationary waves, Clim. Dynam., 17, 479–487, 2001b.
Sadourny, R.: Compressible model flows on the sphere, J. Atmos. Sci., 32, 2103–2110, 1975a.
Sadourny, R.: The dynamics of finite-difference models of the shallow-water equations, J. Atmos. Sci., 32, 680–689, 1975b. Sadourny, R. and Laval, K.: January and July performances of the
LMD general circulation model. New persepectives in climate modelling, Dev. Atmos. Sci., Berger, A. and Nicolis, C., 173– 198, 1984.
Sanberg, J. and Oerlemans, J.: Modelling of pleistocene European ice sheets: the effect of upslope precipitation, Geologie en Mijn-bouw, 62, 267–273, 1983.
Spahni, R., Chappellaz, J., Stocker, T. F., Loulergue, L., Hausam-mann, G., Kawamura, K., Flückiger, J., Schwander, J., Raynaud, D., Masson-Delmotte, V., and Jouzel, J.: Atmospheric methane and nitrous oxide of the late Pleistocene from Antarctic ice cores, Science, 310, 1317–1320, 2005.
Svendsen, J. I., Alexanderson, H., Astakhov, V. I., Demidov, I., Dowdeswell, J., Funder, S., Gataullin, V., Henriksen, M., Hjort, C., Houmark-Nielsen, M., Hubberten, H. W., Ingolfsson, O., Jakobsson, M., Kjaer, K. H., Larsen, E., Lokrantz, H., Lunkka, J. P., Lysa, A., Mangerud, J., Matiouchkhov, A., Murray, A., Möller, P., Niessen, F., Nikolskaya, O., Polyak, L., Saarnisto, M., Siegert, C., Siegert, M. J., Spielhagen, R. F., and Stein, R.: Late Quaternary ice sheet history of Northern Eurasia, Quaternary Sci. Rev., 23, 1229–1271, 2004.
Tarasov, L., Dyke, A. S., Neal, R. M., and Peltier, W. R.: A data-calibrated distribution of deglacial chronolo-gies for the North American ice complex from glacio-logical modeling, Earth Planet. Sc. Lett., 315–316, 30–40, doi:10.1016/j.epsl.2011.09.010, 2012.
Toscano, M. A., Peltier, W. R., and Drummond, R.: ICE-5G and ICE-6G models of postglacial relative sea-level history applied to the Holocene coral reef record of northeastern St Croix, U.S.V.I.: investigating the influence of rotational feedback on GIA pro-cesses at tropical latitudes, Quaternary Sci. Rev., 30, 3032–3042, doi:10.1016/j.quascirev.2011.07.018, 2011.
Ullman, D. J., LeGrande, A. N., Carlson, A. E., Anslow, F. S., and Licciardi, J. M.: Assessing the impact of Laurentide Ice Sheet topography on glacial climate, Clim. Past, 10, 487–507, doi:10.5194/cp-10-487-2014, 2014.
von Storch, H. and Zwiers, F. W., Statistical Analysis in Climate Re-search, Cambridge University Press, Cambridge, United King-dom, 2003.
Wunsch, C.: Abrupt climate change: An alternative view, Quater-nary Res., 65, 191–203, 2006.