Genome
Fusheng Wei1., Jianwei Zhang1., Shiguo Zhou2
, Ruifeng He1, Mary Schaeffer3, Kristi Collura1, David Kudrna1, Ben P. Faga4, Marina Wissotski1, Wolfgang Golser1, Susan M. Rock5, Tina A. Graves5, Robert S. Fulton5, Ed Coe3, Patrick S. Schnable6, David C. Schwartz2, Doreen Ware4, Sandra W. Clifton5, Richard K. Wilson5,7, Rod A. Wing1*
1Arizona Genomics Institute, Departments of Plant Sciences and Ecology and Evolutionary Biology, BIO5 Institute for Collaborative Research, University of Arizona, Tucson, Arizona, United States of America,2Laboratory for Molecular and Computational Genomics, Department of Chemistry, Laboratory of Genetics, University of Wisconsin-Madison, Madison, Wisconsin, United States of America,3Plant Genetics Research Unit, USDA-ARS, and Division of Plant Sciences, University of Missouri, Columbia, Missouri, United States of America,4Cold Spring Harbor Laboratory, Cold Spring Harbor, New York, United States of America,5The Genome Center at Washington University School of Medicine, St. Louis, Missouri, United States of America,6Center for Plant Genomics, Iowa State University, Ames, Iowa, United States of America,7Department of Genetics, Washington University School of Medicine, St Louis, Missouri, United States of America
Abstract
Maize is a major cereal crop and an important model system for basic biological research. Knowledge gained from maize research can also be used to genetically improve its grass relatives such as sorghum, wheat, and rice. The primary objective of the Maize Genome Sequencing Consortium (MGSC) was to generate a reference genome sequence that was integrated with both the physical and genetic maps. Using a previously published integrated genetic and physical map, combined with in-coming maize genomic sequence, new sequence-based genetic markers, and an optical map, we dynamically picked a minimum tiling path (MTP) of 16,910 bacterial artificial chromosome (BAC) and fosmid clones that were used by the MGSC to sequence the maize genome. The final MTP resulted in a significantly improved physical map that reduced the number of contigs from 721 to 435, incorporated a total of 8,315 mapped markers, and ordered and oriented the majority of FPC contigs. The new integrated physical and genetic map covered 2,120 Mb (93%) of the 2,300-Mb genome, of which 405 contigs were anchored to the genetic map, totaling 2,103.4 Mb (99.2% of the 2,120 Mb physical map). More importantly, 336 contigs, comprising 94.0% of the physical map (,1,993 Mb), were ordered and oriented. Finally we used all available
physical, sequence, genetic, and optical data to generate a golden path (AGP) of chromosome-based pseudomolecules, herein referred to as the B73 Reference Genome Sequence version 1 (B73 RefGen_v1).
Citation:Wei F, Zhang J, Zhou S, He R, Schaeffer M, et al. (2009) The Physical and Genetic Framework of the Maize B73 Genome. PLoS Genet 5(11): e1000715. doi:10.1371/journal.pgen.1000715
Editor:Joseph R. Ecker, The Salk Institute for Biological Studies, United States of America
ReceivedJuly 14, 2009;AcceptedOctober 12, 2009;PublishedNovember 20, 2009
This is an open-access article distributed under the terms of the Creative Commons Public Domain declaration which stipulates that, once placed in the public domain, this work may be freely reproduced, distributed, transmitted, modified, built upon, or otherwise used by anyone for any lawful purpose.
Funding:This work is supported by NSF Plant Genome Program-The Maize Genome Sequencing Project (DBI-0527192) to RKW, SWC, RSF, PSS, DW, and RAW, and by the Maize Optical Map Project (DBI-0501818) to DCS. The funders had no role in study design, data collection and analysis, decision to publish, or preparation of the manuscript.
Competing Interests:The authors have declared that no competing interests exist. * E-mail: [email protected]
.These authors contributed equally to this work.
Introduction
Maize is an important crop and a model biological system. With global climate change and increasing caloric and raw material demands, the development of higher yielding and more stress-resistant maize cultivars is a major challenge facing 21st century breeders. Approximately 50 million years ago maize shared a common lineage with all grass and cereal ancestors [1]. Subsequently, the maize ancestor underwent allotetraploidization and diploidization [2–5], prior to domestication some 10,000 years ago in the Americas. The present day maize genome is genetically diploid (n = 10), and has a genome size (GS) of approximately 2300–2700 Mb [6], 85% of which is composed of transposable elements [7]. With the smaller and less complex cereal genome sequences of rice (GS = 389 Mb; [8]) and sorghum (GS = 700 Mb; [9]) already completed, the generation of a whole genome sequence of maize offers the greatest technical challenge to date for any complex plant genome.
Since 1998 the U.S.A. National Science Foundation’s Plant Genome Research Program has invested heavily in the develop-ment of resources and pilot projects to build a foundation to sequence the maize genome, including generation of maize genetic [10–14], physical [15–18], and optical maps [19], sequencing maize gene space by methylation filtration and highCotselection
[20–22], BAC end sequencing [23], random BAC sequencing [24], sequencing large contiguous maize regions [25], and the maize full-length cDNA project [26]. These investments came to fruition in 2005 with the funding of the Maize Genome Sequencing Consortium (MGSC) to use a novel clone-by-clone approach to sequence the genome of the maize inbred B73, a process that was completed in 2009 [7].
genome [18]) as thevade mecumto dynamically select a minimum tiling path (MTP) of BAC clones across the genome. We describe our progress in integrating new and more complex resources into the physical map to better guide the generation, validation and annotation of a reference genome sequence for maize. These processes included the use of maize genome sequence and optical map information to merge, break, anchor and orient FPC contigs. Upon completion of the shotgun sequencing and sequence improvement of most large-insert clones, we combined all available evidence (i.e. sequence, physical, genetic, and optical map information) to construct a golden path (AGP) of pseudo-molecules across the maize genome, hereinafter referred to as the ‘‘B73 RefGen_v1’’.
Results/Discussion
Generation of a Minimum Tiling Path (MTP) of Bacterial Artificial Chromosome (BAC) and fosmid clones to sequence the B73 maize genome
To sequence the maize genome (B73), we employed a clone-by-clone approach and selected a minimum tiling path of BACs across the integrated genetic and physical map. Initially we selected 3,200 BACs that were spaced approximately 800 kb apart across the genome. Additional criteria used to select these ‘‘seed’’ BAC clones were: 1) each had a genomic insert that was larger than the average insert sizes of the BAC libraries; 2) each had a pair of high-quality end sequences; 3) each had a high-quality fingerprint; and 4) where possible, each had an associated genetic and/or overgo marker [27]. These combined criteria ensured that the genomic position of each seed BAC clone was known, that each clone could be easily validated prior to shotgun library construction/sequencing, and that a maximum amount of sequence could be obtained from each region due to the large clone insert size.
Because the previously published B73 maize BES data set [23] was not adequate to walk from seed BACs, the MGSC resequenced BAC ends for the ZMMBBc EcoR1/MboI BAC library, resulting in a total of 340,869 new BESs to aid clone walking/sequencing. The ZMMBBc library was selected because
it had the larger average insert size of the two BAC libraries used to generate the physical map. Combined, we employed 815,473 BESs (70% paired) for the maize genome sequencing project. In addition, the MGSC also generated a total of 827,571 (72% paired end) fosmid end sequences/trace files that were used primarily for MTP gap filling (see below).
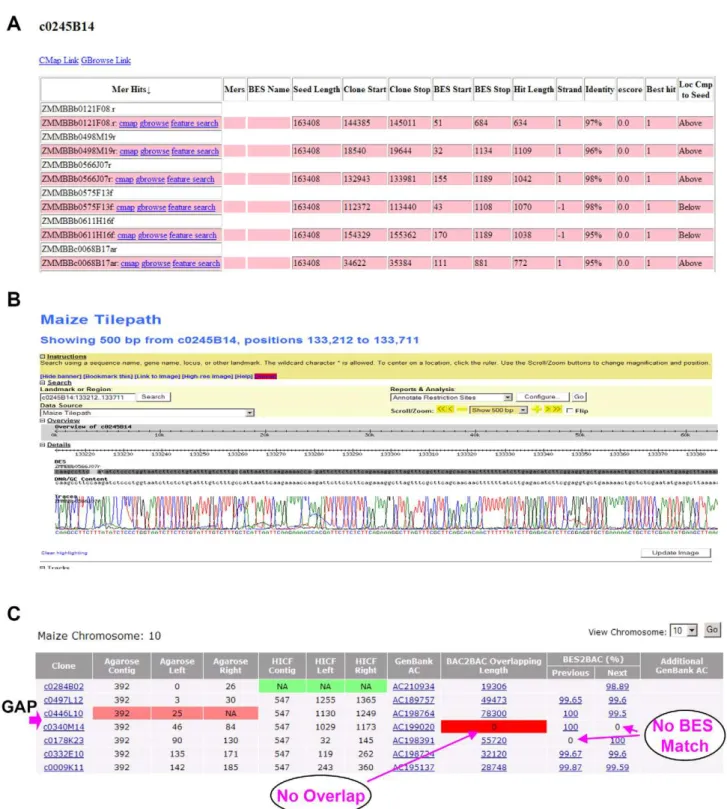
Once a seed BAC was sequenced we employed one of two methods to select adjacent BAC clones that had minimal sequence overlap. The first method, termed the sequenced tagged connector (STC) approach [28], utilized the BES data set (FASTA and trace files) to identify BESs that minimally aligned to the seed BAC sequence on either side of the sequence. Once a MTP BAC clone was identified, its position on the physical map was checked, then validated by BAC end sequencing prior to incorporation in the production sequencing pipeline. To make MTP clone selection more efficient, we developed a web-based MTP Tilepath pipeline interface (Figure 1A and 1B) that is described in detail in Text S1. The second method used for MTP selection relied solely on the underlying BAC fingerprints used to assemble the maize integrated genetic and physical map. This method was employed due to the scale of the project and the timeline mandated to complete the project. It simply was impossible to exclusively use the STC approach, because the improved seed-BAC and MTP-walk sequences were not generated rapidly enough to supply the shotgun library and production sequencing pipelines with adequate numbers of BACs to complete the project on time. To select MTP BAC clones for sequencing with fingerprints, we used an e-value score of e29
to e215
between adjacent BAC clones in the maize high information content fingerprint (HICF) map [17] to ensure minimal overlap. E-value scores for evaluating fingerprint overlap were assessed using the FPC Analysis function [29] and resulted in an average overlap of adjacent BAC clones of 38 kb across the genome. Such overlap can thereby exclude false overlaps created by two identical (or nearly identical) retrotransposons whose sizes are normally less than 15 kb. This e-value parameter could be used for MTP selection of other genomes where HICF physical maps are available.
The final step in MTP generation was to check and fill gaps with either BAC or fosmid clones. To simplify this task, we developed a comprehensive web-based MTP interface (Figure 1C) that is described in Text S1. To ensure high-confidence overlap between two contigs we set the following criteria: 1) two adjoining clones must have overlap in Megablast searches with over 99.9% sequence identity; 2) the highest scoring overlap must be between each clone, and not with any other clone in other parts of the genome; 3) the BES of one clone must align to the sequence of its adjacent clone with over 95% identity; and 4) if the sequence identity in the BAC-end search was less than 99%, the sequence alignment along with the trace chromatograph was manually checked. If any one of these criteria was not met, the clone was flagged and manually annotated. In conclusion, we selected a total of 16,910 MTP clones across the maize genome (3,200 seed, 5,748 STC walks, 6,048 FP walks, 1,795 BAC gaps and 63 Fosmid gaps, and 56 BACs from outside projects). The full list of MTP clones and an interactive website can be accessed at http://www2.genome.arizona.edu/genomes/ maize and in Table S1.
Improvement of the maize integrated genetic and physical map
In our previous study [18], we were unable to merge or genetically anchor additional FPC contigs based on fingerprint evidence alone. By utilizing maize genome sequence and genetic map information we were able to significantly improve the physical map by performing new contig merges, breaking mis-assembled contigs and anchoring additional FPC contigs to the maize genetic map.
Author Summary
Using the same rules described above for gap checking, in combination with the maize genome sequence, we were able to perform 109 FPC contig merges, and identified ten FPC contigs that were incorrectly merged (Table S2). These latter contigs were broken apart and then merged into 17 new FPC contigs. This analysis resulted in a total of 435 FPC contigs in the maize physical map, which covered,93% (2120 Mb) of the 2300-Mb
genome. In addition, 170 small low-coverage FPC contigs (,25 Mb in total) shown to represent contaminating cotton
sequences were removed from the physical map assembly. The contamination was identified by Kmer [30] and BAC end sequence analyses. All contaminated clones were from the ZMMBBb library and most likely originated during the BAC library construction process.
To fully integrate the physical map with the maize genetic map we utilized all publicly available marker data from the IBM2 2008 Neighbors Map (Schaeffer, Sanchez-Villeda, and Coe, 2008; http://maizegdb.org/map.php), and the literature. The IBM2 2008 Neighbors map contains 15,932 markers (11,475 publicly available). However, due to the long history of these genetic markers, dating back 20 years or more, the nucleotide sequences of many markers were not deposited into centralized databases, such as maizeGDB or GenBank. To integrate additional genetic markers at the sequence level, we conducted extensive literature and Google searches and identified 2,864 markers with sequences not associated with markers in maizeGDB or linked to GenBank entries.
In total, we obtained 9,229 sequence-based genetic markers with available sequences (http://www2.genome.arizona.edu/
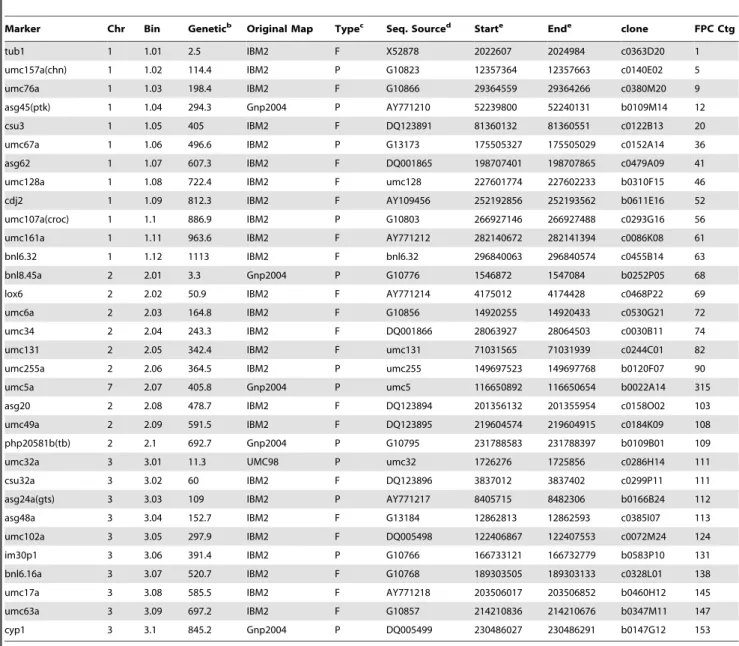
genomes/maize). Of these, 8,315 markers could be mapped onto both the physical map and the B73 RefGen_v1 (Table S3). We could not pinpoint the genomic locations of 134 markers (indicated as ‘‘no hit’’ in Table S3), perhaps due to lack of sequence or genome coverage in the related regions, or their origin as inbred-specific sequences. Gore et al. [31] reported that about 7.8% of the maize sequences could be inbred specific. The low genetic map resolution of these markers made it impossible to determine the cause for no coverage. Additionally, 780 markers were placed on different chromosomes in contrast to their reported genetic positions (Table S3). Most of these 780 markers were from low-resolution maps and their genetic positions could not be validated. Of the 90 bin markers (Table 1, partial; the full list is in Table S4) used to divide the maize genome genetically, we could confidently place 87 markers on both
Table 1.Position of bin markers in the B73 physical map and RefGen_v1a.
Marker Chr Bin Geneticb Original Map Typec Seq. Sourced Starte Ende clone FPC Ctg
tub1 1 1.01 2.5 IBM2 F X52878 2022607 2024984 c0363D20 1
umc157a(chn) 1 1.02 114.4 IBM2 P G10823 12357364 12357663 c0140E02 5
umc76a 1 1.03 198.4 IBM2 F G10866 29364559 29364266 c0380M20 9
asg45(ptk) 1 1.04 294.3 Gnp2004 P AY771210 52239800 52240131 b0109M14 12
csu3 1 1.05 405 IBM2 F DQ123891 81360132 81360551 c0122B13 20
umc67a 1 1.06 496.6 IBM2 P G13173 175505327 175505029 c0152A14 36
asg62 1 1.07 607.3 IBM2 F DQ001865 198707401 198707865 c0479A09 41
umc128a 1 1.08 722.4 IBM2 F umc128 227601774 227602233 b0310F15 46
cdj2 1 1.09 812.3 IBM2 F AY109456 252192856 252193562 b0611E16 52
umc107a(croc) 1 1.1 886.9 IBM2 P G10803 266927146 266927488 c0293G16 56 umc161a 1 1.11 963.6 IBM2 F AY771212 282140672 282141394 c0086K08 61
bnl6.32 1 1.12 1113 IBM2 F bnl6.32 296840063 296840574 c0455B14 63
bnl8.45a 2 2.01 3.3 Gnp2004 P G10776 1546872 1547084 b0252P05 68
lox6 2 2.02 50.9 IBM2 F AY771214 4175012 4174428 c0468P22 69
umc6a 2 2.03 164.8 IBM2 F G10856 14920255 14920433 c0530G21 72
umc34 2 2.04 243.3 IBM2 F DQ001866 28063927 28064503 c0030B11 74
umc131 2 2.05 342.4 IBM2 F umc131 71031565 71031939 c0244C01 82
umc255a 2 2.06 364.5 IBM2 P umc255 149697523 149697768 b0120F07 90
umc5a 7 2.07 405.8 Gnp2004 P umc5 116650892 116650654 b0022A14 315
asg20 2 2.08 478.7 IBM2 F DQ123894 201356132 201355954 c0158O02 103
umc49a 2 2.09 591.5 IBM2 F DQ123895 219604574 219604915 c0184K09 108
php20581b(tb) 2 2.1 692.7 Gnp2004 P G10795 231788583 231788397 b0109B01 109
umc32a 3 3.01 11.3 UMC98 P umc32 1726276 1725856 c0286H14 111
csu32a 3 3.02 60 IBM2 F DQ123896 3837012 3837402 c0299P11 111
asg24a(gts) 3 3.03 109 IBM2 P AY771217 8405715 8482306 b0166B24 112
asg48a 3 3.04 152.7 IBM2 F G13184 12862813 12862593 c0385I07 113
umc102a 3 3.05 297.9 IBM2 F DQ005498 122406867 122407553 c0072M24 124
im30p1 3 3.06 391.4 IBM2 P G10766 166733121 166732779 b0583P10 131
bnl6.16a 3 3.07 520.7 IBM2 F G10768 189303505 189303133 c0328L01 138 umc17a 3 3.08 585.5 IBM2 F AY771218 203506017 203506852 b0460H12 145
umc63a 3 3.09 697.2 IBM2 F G10857 214210836 214210676 b0347M11 147
cyp1 3 3.1 845.2 Gnp2004 P DQ005499 230486027 230486291 b0147G12 153
aThis is a partial list. The full list is in Table S4. bgenetic position.
cmarker type, P: Placement, not as accurate as Framework (F).
dSequence Source, marker names with no GenBank accession number indicated that the sequences are available at http://www2.genome.arizona.edu/genomes/maize. epositions in B73 RefGen_v1.
the physical map and the B73 RefGen_v1. There were three bin markers (RFLP markers umc5a, agrr37b, and csu93b) with physical positions that conflicted with their genetic positions. Most likely, those multiple copy markers were InDels that were present in different parental lines, but absent in B73 or in gaps, because each marker only had one locus in the B73 genome (RefGen_v1), instead of multiple ones in their original mapping parents.
After integration, 97.8% of the physical map could be assigned to the maize genetic map, as compared to 86.1% [18] prior to the genome sequence. Among the 435 contigs in the updated physical map, 392 could be anchored, totaling 2073 Mb (97.8% of the 2120 Mb physical map). Among these 392 anchored FPC contigs, 163 (totaling,1222.9 Mb; 57.7% of the physical map) could be
ordered and oriented in the maize genome, 92 (comprising
,387.4 Mb) could be ordered, but not oriented, and 137
(,462.8 Mb) had only rough genomic positions and were not
ordered and oriented. Finally, the genomic positions of 43 FPC contigs (,47 Mb; 2.2%) could not be determined due to lack of
any sequence overlap and/or genetic linkage information. Development and mapping of polymorphic genetic markers from these latter contigs would be the most efficient approach to incorporate them into the integrated genetic and physical map of maize or other species.
Ordering and orienting maize physical contigs using the maize optical map
Zhou et al. [19] reported the construction of an optical map for the B73 maize genome. The optical map was constructed by generating SwaI restriction maps of high molecular weight genomic DNA at 400-fold redundancy. The restriction maps were assembled into a whole genome optical map consisting of 66 contigs, many fewer than the 435 contigs in the maize physical map. To interdigitate the optical map with the integrated physical and genetic maps, we generated a contig-based in silico maize optical map by digesting the contig-based pseudomolecules (described below) with theSwaI restriction enzyme. The resulting
in silicorestriction map was then aligned to the maize optical map (see details in [19]) and used to assist with the ordering and anchoring of additional FPC contigs. For example, in Figure 2A, Ctg33 was well anchored on maize Chr1, while Ctg36 was only
ordered but not oriented. Both FPC Ctg33 and 36 were mapped adjacent to one another in the maize optical map (Omcontig_0) thus allowing Ctg36 to be oriented correctly. In another example (Figure 2B and 2C), Ctg304 was well anchored (ordered and oriented) on maize Chr7, but the chromosomal positions of Ctg459 and 470 were unknown. These three contigs mapped next to each other in the following order: Ctg304, 470, and 459 on maize Omcontig_10. These data provided a genome context for the two orphan FPC contigs (Ctg459 and 470).
Combining the optical map analysis with the improved integrated genetic and physical map, we were able to anchor an additional 13 FPC contigs to the maize genetic map, which resulted in a final total of 405 anchored FPC contigs comprising 99.2% of the 2120 Mb physical map. More importantly, more than twice as many FPC contigs (336 as opposed to 163), comprising 94.0% of the physical map (,1993 Mb), could be ordered and oriented. For the remaining
contigs, 21 (containing ,20.6 Mb) could be ordered, but not
oriented; and 48 (,90.1 Mb) had only approximate genomic
positions and were neither ordered nor oriented. The final 17.1 Mb contained 30 contigs with no genome context. The efficiency of using the maize optical map for anchoring is remarkable due to its deep coverage, large single molecule, and contig sizes.
The anchoring quality of each contig, including the evidence used for anchoring, ordering and orienting, is shown in Table 2 (partial; the full list is in Table S5). The final integrated genetic and phys-ical map can be downloaded at: http://www2.genome.arizona.edu/ genomes/maize.
Generation of A Golden Path (AGP) of the maize B73 genome
A major objective of the MGSC was to sequence the genome, integrate the sequence into the maize genetic and physical maps, and provide a high quality reference sequence in low copy regions. The final step of the MGSC, before annotation, was to generate a set of ten pseudomolecules that represented the ten chromosomes of maize—called ‘‘a golden path’’ or ‘‘AGP.’’ AGPs greatly simplify the analysis of a genome because an AGP removes all redundant overlapping sequences between BACs and fosmids, and provides a convenient set of contiguous sequence for annotation, as opposed to having to download over 16,000 individual BAC
Figure 2. Use of the maize optical map for FPC contig anchoring.In each panel, the top blue fragments represent a maize opticalSwaI restriction map, and the bottom orange fragments represent thein silicoopticalSwaI restriction map from contig-based pseudomolecules. Red fragments in (B) and (C) indicate a mis-sassmbly in the pseudomolecule that required manual editing. (A) Well-anchored Ctg36 helped to orient Ctg33, which was previously only ordered, but not oriented. (B) Anchored Ctg407 aided order and orientation of Ctg470, which was neither ordered nor oriented. (C). The newly anchored Ctg470 facilitated ordering and orienting of Ctg459.
sequences and assembling them into a genome sequence independently. Most BAC sequences, generated by the MGSC and deposited in GenBank, contained multiple sequence contigs (on average 11 per clone) some of which were neither ordered nor oriented; it was thus very challenging to construct the AGP.
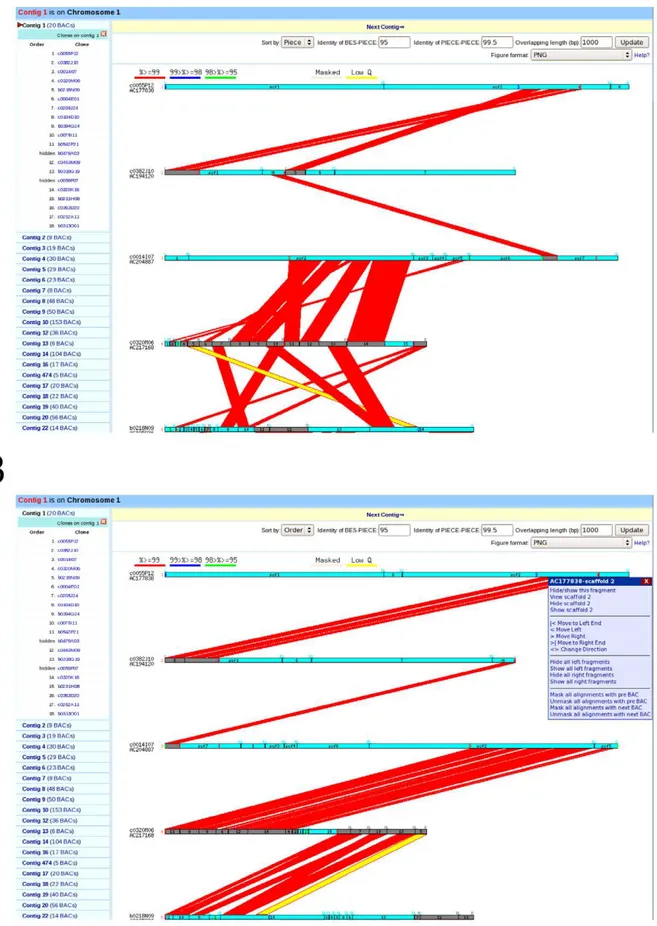
The main task in building a whole genome AGP is to determine the extent of overlapping sequence between adjacent clones, order and orient sequence contigs in the overlapping regions, and finally remove all redundant overlapping sequence. To accomplish this task, we built a semi-automated web-based AGP pipeline connected to a MySQL relational database that was run with custom Perl scripts. All available sequence data including BAC, BAC and fosmid –end, and marker sequence information from both the MGSC and outside projects were then loaded into the MySQL database. A set of comparisons was then performed between neighboring BAC sequences and/or BES using BLAST, which resulted in the identification of the left and/or right end of each BAC on adjacent BACs, as well as overlapping sequence between two adjoining clones. Employing a user-friendly graphical interface (Figure 3A and 3B), we manually curated the order and orientation of BAC pieces in overlapping regions, and removed
overlapping or redundant sequences from the final pseudomolecule according to sequence alignment. All processing information was saved into our database for creating the AGP file.
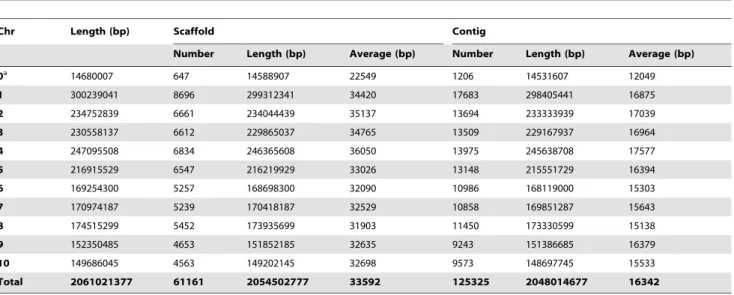
At present, a total of 16,910 clones assigned to 435 FPC contigs have been processed by the AGP pipeline. After removal of sequence overlap and ordering and orienting sequence contigs within the overlapping regions, we were able to generate a maize AGP composed of 2048 Mb of pseudomolecule sequences in 61,161 scaffolds from 125,325 sequence contigs, which covers,97% of the
2120-Mb physical map. Table 3 summarizes the sizes, scaffolds, and contig number of each maize chromosome plus those that are unanchored. The AGP and maize B73 RefGen_v1 are available at: http://www2.genome.arizona.edu/genomes/maize.
Conclusion
We used an integrated genetic and physical map to select and validate an MTP of clones across the maize genome as the template to generate a whole genome sequence. Using individual BAC assemblies, over 8,300 sequence-based genetic markers, and the optical map, we significantly improved the integrated genetic
Table 2.Contig anchoring quality and contig positions in B73 RefGen_v1a.
Contig Genetic Position Order/Orienb Number of Clones Number of Markers Physical Length (Kb) Chr Startc Endc
1 2.5 2 276 98 2523 1 1 2299274
2 13.5 2 132 53 1092 1 2300275 3419854
3 26.1 2 334 160 2126 1 3420855 5929995
4 82.8 2 616 262 4165 1 5930996 10045647
5 103 2 350 152 3224 1 10046648 13079531
6 124.7 2 459 172 2851 1 13080532 16193432
7 145 1 109 44 1156 1 16194433 17299506
8 160.6 2 793 280 5600 1 17300507 23505871
9 170 2 801 249 5933 1 23506872 29869500
10 205 2 2427 745 18541 1 29870501 48303993
12 290.1 2 506 179 4277 1 48304994 52419976
13 292.4 2 72 35 715 1 52420977 53153490
14 325.7 2 1672 434 12700 1 53154491 65772465
16 360.9 3 281 77 1920 1 65773466 67717626
474 385 0 79 39 705 1 67718627 68401065
17 386.4 2 247 63 2361 1 68402066 70727174
18 391.8 3 379 119 3189 1 70728175 73586599
19 392.95 3 626 136 4640 1 73587600 78384554
20 398.2 2 798 198 6350 1 78385555 84665058
22 406 3 253 68 1832 1 84666059 86598526
24 415 3 482 99 3973 1 86599527 90264916
23 417 2 578 114 4395 1 90265917 94733311
106 227.1 4 939 190 7359 9 53598148 60378895
432 227.2 4 701 135 4875 9 60379896 65011726
448 227.3 4 576 90 4512 9 65012727 69221205
425 unknown 5 218 51 1871 0 9718511 11319527
427 unknown 5 236 35 2033 0 11479785 13269771
429 unknown 5 166 41 1759 0 13443808 14680007
aThis is a partial list. The full list is in Table S5.
bCode: 0, chromosomal assignment is known, but not ordered and oriented; 1, ordered, but not oriented; 2, genetically anchored and oriented; 3, anchored and
oriented with assistance from optical map; 4, the block was anchored, but order and orientation are unknown; 5, unknown chromosomal context.
cpositions in B73 RefGen_v1.
Figure 3. Direct comparison of sequence overlap between adjacent clones before (A) and after (B) the semi automated AGP pipeline.
and physical map of maize, which in turn resulted in the generation of an AGP across the maize genome. The tremendous resources generated by this project will greatly facilitate basic and applied research on multiple fronts, including comparative and functional genomics studies, genome structure and evolution, map-based gene cloning, and molecular breeding.
Although the first release of the maize genome (i.e. B73 RefGen_v1) is now realized, as with any genome sequence, several improvements are still needed to produce an even more accurate reference sequence for maize. First, six percent of the genome (127.8 Mb in total) still needs to be genetically ordered and oriented. This includes 20.6 Mb (1.0% of the physical map in 21 contigs) to be oriented, 90.1 Mb (4.3% in 48 contigs) to be precisely ordered and oriented, and finally, 17.1 Mb (0.8% in 35 contigs) to be genetically mapped. Secondly, the physical map covers,93% of the B73 genome in 435 contigs, and significant
physical gaps remain to be bridged. For example, approximately 5% of the maize full-length cDNA data set could not be mapped to the genome (i.e. B73 RefGen_v1; [26]). Finally, we must continue to better orient sequence contigs within BACs using multiple data types, such as the optical map, syntenic relationships across the cereal genomes, full-length cDNA evidence, and paired-end whole genome shotgun sequence. Data generated from the maize diversity project should provide enough evidence to anchor most unanchored contigs (Ed Buckler, pers. comm.). Efforts to further improve the B73 RefGen_v1 are now underway, and new AGP releases will be made available regularly through the AGI website (www2.genome.arizona.edu/genome/maize).
Materials and Methods
Physical map editing and anchoring
All steps related to physical map editing were as previously described [18].
Sequence based genetic marker integration
See Text S1.
MTP clone selection pipeline
See Text S1.
AGP generation pipeline
See Text S1.
Supporting Information
Table S1 MTP clones and their physical position, sequence
characteristics, and overlap information.
Found at: doi:10.1371/journal.pgen.1000715.s001 (2.82 MB XLS)
Table S2 Contig number and orientation change after merging and breaking.
Found at: doi:10.1371/journal.pgen.1000715.s002 (0.03 MB XLS)
Table S3 Genetic markers and their genetic, physical, and
RefGen_v1 positions.
Found at: doi:10.1371/journal.pgen.1000715.s003 (1.80 MB XLS)
Table S4 The position of bin markers in the B73 physical map and RefGen_v1.
Found at: doi:10.1371/journal.pgen.1000715.s004 (0.03 MB XLS)
Table S5 Contig anchoring quality and contig positions in B73 RefGen_v1.
Found at: doi:10.1371/journal.pgen.1000715.s005 (0.05 MB XLS)
Text S1 The maize MTP pipeline, the maize AGP pipeline, and
sequence-based genetic markers.
Found at: doi:10.1371/journal.pgen.1000715.s006 (0.40 MB DOC)
Acknowledgments
We thank all personnel in the Maize Genome Sequencing Consortium, especially the great contribution from the shotgun library and sequencing production teams at the GCWU and AGI. We also appreciate the maize community for their contributions of genetic markers and personal communications.
Table 3.Sequence summary of the maize chromosomes in B73 RefGen_v1.
Chr Length (bp) Scaffold Contig
Number Length (bp) Average (bp) Number Length (bp) Average (bp)
0a 14680007 647 14588907 22549 1206 14531607 12049
1 300239041 8696 299312341 34420 17683 298405441 16875
2 234752839 6661 234044439 35137 13694 233333939 17039
3 230558137 6612 229865037 34765 13509 229167937 16964
4 247095508 6834 246365608 36050 13975 245638708 17577
5 216915529 6547 216219929 33026 13148 215551729 16394
6 169254300 5257 168698300 32090 10986 168119000 15303
7 170974187 5239 170418187 32529 10858 169851287 15643
8 174515299 5452 173935699 31903 11450 173330599 15138
9 152350485 4653 151852185 32635 9243 151386685 16379
10 149686045 4563 149202145 32698 9573 148697745 15533
Total 2061021377 61161 2054502777 33592 125325 2048014677 16342
atotal of all unanchored contigs.
Author Contributions
Conceived and designed the experiments: FW JZ RSF PSS DCS SWC RKW RAW. Performed the experiments: FW JZ RH KC DK MW WG
SMR TAG. Analyzed the data: FW JZ SZ MS EC. Contributed reagents/ materials/analysis tools: SZ MS BPF EC DCS DW. Wrote the paper: FW JZ RAW.
References
1. Moore G, Devos KM, Wang Z, Gale MD (1995) Cereal genome evolution -grasses, line up and form a circle. Current Biology 5: 737–739.
2. Rhoades M (1951) Duplicate genes in maize. Am Nat 85: 105–110. 3. Goodman MM, Stuber CW, Newton K, Weissinger HH (1980) Linkage
relationships of 19 enzyme loci in maize. Genetics 96: 697–710.
4. Wendel J, Stuber C, Edwards M, Goodman M (1986) Duplicated chromosome segments inZea maysL. : Further evidence from hexokinase enzymes. Theor Appl Genet 72: 178–185.
5. Gaut B, Doebley J (1997) DNA sequence evidence for the segmental allotetraploid origin of maize. Proc Natl Acad Sci USA 94: 6809–6814. 6. Rayburn A, Biradar D, Bullock D, McMurphy L (1993) Nuclear DNA content
in F1 hybrids of maize. Heredity 70: 294–300.
7. Schnable PS, Ware D, Fulton R, Stein J, Wei F, et al. (2009) The B73 maize genome: complexity, diversity and dynamics. Science 326: doi:1126/ science.1178534.
8. International Rice Genome Sequencing Project (2005) The map-based sequence of the rice genome. Nature 436: 793–800.
9. Paterson AH, Bowers JE, Bruggmann R, Dubchak I, Grimwood J, et al. (2009) The Sorghum bicolor genome and the diversification of grasses. Nature 457: 551–556.
10. Davis G, McMullen M, Baysdorfer C, Musket T, Grant D, et al. (1999) A maize map standard with sequenced core markers, grass genome reference points and 932 expressed sequence tagged sites (ESTs) in a 1736-locus map. Genetics 152: 1137–1172.
11. Sharopova N, McMullen MD, Schultz L, Schroeder S, Sanchez-Villeda H, et al. (2002) Development and mapping of SSR markers for maize. Plant Mol Biol 48: 463–481.
12. Fu Y, Wen T-J, Ronin YI, Chen HD, Guo L, et al. (2006) Genetic dissection of intermated recombinant inbred lines using a new genetic map of maize. Genetics 174: 1671–1683.
13. Yu J, Holland JB, McMullen MD, Buckler ES (2008) Genetic design and statistical power of nested association mapping in maize. Genetics 178: 539–551. 14. Liu S, Yeh C-T, Jie T, Ying K, Wu H, et al. (2009) Mu transposon insertion sites and meiotic recombination events co-localize with epigenetic markers for open chromatin across the maize genome. PLoS Genet 5: e733. doi: 10.1371/ journal.pgen.1000733.
15. Cone KC, McMullen MD, Bi IV, Davis GL, Yim Y-S, et al. (2002) Genetic, physical, and informatics resources for maize. On the road to an integrated map. Plant Physiol 130: 1598–1605.
16. Coe E, Schaeffer M (2005) Genetic, physical, maps, and database resources for maize. Maydica 50: 285–303.
17. Nelson WM, Bharti AK, Butler E, Wei F, Fuks G, et al. (2005) Whole-genome validation of high-information-content fingerprinting. Plant Physiol 139: 27–38. 18. Wei F, Coe E, Nelson W, Bharti AK, Engler F, et al. (2007) Physical and genetic structure of the maize genome reflects its complex evolutionary history. PLoS Genet 3: e123. doi:10.1371/journal.pgen.0030123.
19. Zhou S, Wei F, Nguyen J, Bechner M, Potamousis K, et al. (2009) A single molecule scaffold of the maize genome. PLoS Genet 5: e711. doi:10.1371/ journal.pgen.1000711.
20. Palmer LE, Rabinowicz PD, O’Shaughnessy AL, Balija VS, Nascimento LU, et al. (2003) Maize genome sequencing by methylation filtration. Science 302: 2115–2117.
21. Whitelaw CA, Barbazuk WB, Pertea G, Chan AP, Cheung F, et al. (2003) Enrichment of gene-coding sequences in maize by genome filtration. Science 302: 2118–2120.
22. Nelson W, Luo M, Ma J, Estep M, Estill J, et al. (2008) Methylation-sensitive linking libraries enhance gene-enriched sequencing of complex genomes and map DNA methylation domains. BMC Genomics 9: 621.
23. Messing J, Bharti AK, Karlowski WM, Gundlach H, Kim HR, et al. (2004) Sequence composition and genome organization of maize. Proc Natl Acad Sci USA 101: 14349–14354.
24. Haberer G, Young S, Bharti AK, Gundlach H, Raymond C, et al. (2005) Structure and architecture of the maize genome. Plant Physiol 139: 1612–1624. 25. Bruggmann R, Bharti AK, Gundlach H, Lai J, Young S, et al. (2006) Uneven chromosome contraction and expansion in the maize genome. Genome Res 16: 1241–1251.
26. Soderlund C, Descour A, Kudrna D, Bomhoff M, Boyd L, et al. (2009) Sequencing, mapping and analysis of 27,455 maize full-length cDNAs. PLoS Genet 5: e740. doi: 10.1371/journal.pgen.1000740.
27. Gardiner J, Schroeder S, Polacco ML, Sanchez-Villeda H, Fang Z, et al. (2004) Anchoring 9,371 maize expressed sequence tagged unigenes to the bacterial artificial chromosome contig map by two-dimensional overgo hybridization. Plant Physiol 134: 1317–1326.
28. Venter JC, Smith HO, Hood L (1996) A new strategy for genome sequencing. Nature 381: 364–366.
29. Soderlund C, Humphray S, Dunham A, French L (2000) Contigs built with fingerprints, markers, and FPC V4.7. Genome Res 10: 1772–1787. 30. Kurtz S, Narechania A, Stein J, Ware D (2008) A new method to compute
K-mer frequencies and its application to annotate large repetitive plant genomes. BMC Genomics 9: 517.