High-Density Genetic Linkage Map
Construction and QTL Mapping of Grain
Shape and Size in the Wheat Population
Yanda1817 × Beinong6
Qiu-Hong Wu1, Yong-Xing Chen1, Sheng-Hui Zhou1, Lin Fu1, Jiao-Jiao Chen1, Yao Xiao1, Dong Zhang1, Shu-Hong Ouyang1, Xiao-Jie Zhao1, Yu Cui1, De-Yun Zhang1, Yong Liang1, Zhen-Zhong Wang1, Jing-Zhong Xie1, Jin-Xia Qin1, Guo-Xin Wang1, De-Lin Li1, Yin-Lian Huang1, Mei-Hua Yu1, Ping Lu1, Li-Li Wang1, Ling Wang1, Hao Wang1, Chen Dang1, Jie Li1, Yan Zhang1, Hui-Ru Peng1, Cheng-Guo Yuan1¤, Ming-Shan You1, Qi-Xin Sun1,
Ji-Rui Wang2,3, Li-Xin Wang4, Ming-Cheng Luo2, Jun Han5*, Zhi-Yong Liu1*
1State Key Laboratory for Agrobiotechnology / Department of Plant Genetics & Breeding, China Agricultural University, Beijing 100193, China,2Department of Plant Sciences, University of California at Davis, Davis 95616, United States of America,3Triticeae Research Institute, Sichuan Agricultural University, Wenjiang, Chengdu, Sichuan 611130, China,4Beijing Academy of Agriculture and Forestry Sciences, Beijing 100197, China,5Beijing University of Agriculture, Beijing 102206, China
¤ Current address: Gaoyi Stock Seed Farm, Gaoyi 051330, China *[email protected](ZYL);[email protected](JH)
Abstract
High-density genetic linkage maps are necessary for precisely mapping quantitative trait loci (QTLs) controlling grain shape and size in wheat. By applying the Infinium iSelect 9K SNP assay, we have constructed a high-density genetic linkage map with 269 F8
recombi-nant inbred lines (RILs) developed between a Chinese cornerstone wheat breeding paren-tal line Yanda1817 and a high-yielding line Beinong6. The map contains 2431 SNPs and 128 SSR & EST-SSR markers in a total coverage of 3213.2 cM with an average interval of 1.26 cM per marker. Eighty-eight QTLs for thousand-grain weight (TGW), grain length (GL), grain width (GW) and grain thickness (GT) were detected in nine ecological environments (Beijing, Shijiazhuang and Kaifeng) during five years between 2010–2014 by inclusive
com-posite interval mapping (ICIM) (LOD2.5). Among which, 17 QTLs for TGW were mapped on chromosomes 1A, 1B, 2A, 2B, 3A, 3B, 3D, 4A, 4D, 5A, 5B and 6B with phenotypic varia-tions ranging from 2.62% to 12.08%. Four stable QTLs for TGW could be detected in five and seven environments, respectively. Thirty-two QTLs for GL were mapped on chromo-somes 1B, 1D, 2A, 2B, 2D, 3B, 3D, 4A, 4B, 4D, 5A, 5B, 6B, 7A and 7B, with phenotypic vari-ations ranging from 2.62% to 44.39%.QGl.cau-2A.2can be detected in all the
environments with the largest phenotypic variations, indicating that it is a major and stable QTL. For GW, 12 QTLs were identified with phenotypic variations range from 3.69% to 12.30%. We found 27 QTLs for GT with phenotypic variations ranged from 2.55% to 36.42%. In particular, QTLQGt.cau-5A.1with phenotypic variations of 6.82–23.59% was
detected in all the nine environments. Moreover, pleiotropic effects were detected for
a11111
OPEN ACCESS
Citation:Wu Q-H, Chen Y-X, Zhou S-H, Fu L, Chen J-J, Xiao Y, et al. (2015) High-Density Genetic Linkage Map Construction and QTL Mapping of Grain Shape and Size in the Wheat Population Yanda1817 × Beinong6. PLoS ONE 10(2): e0118144. doi:10.1371/journal.pone.0118144
Academic Editor:Tongming Yin, Nanjing Forestry University, CHINA
Received:September 12, 2014
Accepted:January 4, 2015
Published:February 12, 2015
Copyright:© 2015 Wu et al. This is an open access article distributed under the terms of theCreative Commons Attribution License, which permits unrestricted use, distribution, and reproduction in any medium, provided the original author and source are credited.
Data Availability Statement:All relevant data are within the paper and its Supporting Information files.
Funding:This work was supported by 973 project 2011CB100104; National Natural Science Foundation of China 31030056, 31271710; Ministry of Education of China 111-2-03. The funders had no role in study design, data collection and analysis, decision to publish, or preparation of the manuscript.
several QTL loci responsible for grain shape and size that could serve as target regions for fine mapping and marker assisted selection in wheat breeding programs.
Introduction
Wheat is the third highest producing cereal crop after maize and rice, and is the leading sources of vegetable protein in human food. The demand for wheat in the developing world is projected to increase by 60% by 2050 while production is expected to be affected negatively by climate change and natural resource depletion (FAO). Wheat is a staple food used to make flour for different kinds of products. Grain weight and size are the targets for breeding, not merely be-cause they are the major components of grain yield, but also due to their impacts on milling and baking quality [1]. Moreover, grain size can partially explain the process of crop domesti-cation [2].
Grain weight and size are complex quantitative traits controlled by a number of genes and significantly influenced by the environment. The grain weight and size can be divided into a number of components including thousand grain weight (TGW), grain length (GL), grain width (GW), and grain thickness (GT), etc. [3–7]. Previous studies have proved that TGW has high heritability values and is phenotypically the most stable yield component [8].
Monosomic and QTL analyses have been used to identify wheat genomic regions associated with grain weight and shape [3–12]. Röder et al. also reported fine genetic mapping of a grain weight QTL at the telomeric region of chromosome 7DS [13]. Up to date, no gene/QTL associ-ated with grain shape and size has been cloned in wheat via a map-based cloning approach. However, some QTLs for grain size and weight in wheat were associated with the orthologs of rice grain traits QTLs, includingTaCwi-1A[14],TaSus2–2B[15],TaGw2–6A[6],TaCKX6-D1
[16],TaSap1-A1[17],TaGS1–6D[18] andTaLsu1[19].
Genetic dissection of grain weight and size in bread wheat, however, is greatly hampered by an enourmous genome size (~17Gb), complex genomes (allohexaploid, 2n = 42, AABBDD), and prevalence of repetitive DNA. A well-saturated genetic linkage map is a powerful tool to dissect the genetic elements responsible for grain weight and size. Both restriction fragment length polymorphisms (RFLP) and simple sequence repeats (SSR) have been used in linkage map construction, and an increasing number of QTL studies have been conducted in attempts to analysis the genetic basis of grain weight and grain size in wheat [5,7,20–27]. However, RFLP markers have shown very low levels of polymorphism between wheat cultivars, although they are co-dominant and highly reliable in nature. In contrast, SSR markers reveal a higher level polymorphism in wheat but it is very laborious to construct high-density genetic linkage maps. The need for studies of complex traits with very high density genetic linkage maps and progress in polymorphism detection and genotyping techniques has promoted the recent de-velopment of single nucletide polymorphism (SNP) markers in wheat. Meanwhile, next gener-ation sequencing technology makes it possible to find more SNPs between wheat cultivars. The wheat Infinium iSelect 9k SNP genotyping assay was developed based on transcriptomes of 26 accessions of hexaploid wheat generated using Roche 454 and Illumina platforms [28].
Materials and Methods
Ethics Statement
No specific permission was required for the study. The field studies did not involve endangered or protected species.
Plant Materials and Field Trials
Yanda1817, a pure line derivative of wheat landrace Pingyao Xiaobaimai from Shanxi Prov-ince, was one of the‘cornerstone parental’breeding lines for the Northern China Winter Breeding Program between 1950–1960. Yanda1817 is highly tolerance to drought, winter har-diness and poor soil fertility, and has very strong tillering ability and taller plant height. More than fifty registered wheat cultivars, mostly grown in the Northern Winter Wheat Zone of China, have been generated from Yanda1817 in different breeding programs [29]. Beinong6 is a semi-dwarf high-yielding 1B/1R derivative released in the 1990s by Beijing University of Ag-riculture. Beinong6 consistently has larger grain size and higher kernel weight than
Yanda1817. Recombinant inbred lines (RILs) of Yanda1817/Beinong6 were selected for high-density linkage map construction and QTL mapping because the RIL populations are known to be segregating widely for agronomic traits, such as plant height, yield and presence/absence of awns.
The mapping population for QTL analysis comprised 269 F8to F12recombinant inbred lines (RILs) derived from Yanda1817/Beinong6 by single seed descent. Compared to Yanda1817, Beinong6 shows a higher TGW and larger grain size.
Yanda1817, Beinong6 and the 269 RILs were grown in Beijing (BJ, E116.10, N40.08), Shijia-zhuang (HB, E114.36, N37.38) and Kaifeng (HN, E114.23, N34.52) (S1 Fig.) from 2010–2014 at nine environments (E1–E9) for phenotype evaluations, viz., Beijing 2010 (E1), Beijing 2011 (E2), Shijiazhuang 2011 (E3), Beijing 2012 (E4), Shijiazhuang 2012 (E5), Beijing 2013 (E6), Shi-jiazhuang 2013 (E7), Beijing 2014 (E8) and Kaifeng 2014 (E9). Beijing (Northern Winter Wheat Zone), Shijiazhuang and Kaifeng (Yellow and Huai River Valleys Facultative Wheat Zone) represent two different wheat growing agro-climatic regions in China. The trials were performed in a randomized complete block design, and each treatment contains three repli-cates except for E1 and E2 which had one replicate. Each plot had two rows that were 2 m long and 25 cm wide and 30 seeds were evenly planted in each row. Field management was the same as commonly practiced in wheat production.
Testing of Grain Traits
From the center of the rows, ten representational plants were selected to harvest as samples for measuring TGW in grams, and GL, GW and GT in millimeters. The seeds were fully cleaned and dried and broken grains were removed before trait evaluations. TGW was recorded using an electronic balance to determine the average weight of two (E1, E2, E3, E8, E9) or three (E4, E5, E6, E7) independent samples of 100 grains. GL, GW and GT were measured for 10 random grains from each RIL for each replication using vernier calipers. Trait values of each year-loca-tion combinayear-loca-tion (defined as one environment) were used for QTL analysis.
Statistical Analysis
DNA Extraction
Genomic DNA was extracted from two week old leaf tissue of Yanda1817, Beinong6 and each RIL using the cetyltrimethyl ammonium bromide (CTAB) method [30]. DNA was quantified using 1% agarose gel electrophoresis withλDNA as the standard.
SSR and EST-SSR Genotyping
Genomic SSR and EST-SSR markers (Xcau) were screened for polymorphisms between Yada1817 and Beinong6. Primer sequences for the Beltsville Agricultural Research Center (BARC), Gatersleben wheat microsatellite (GWM), Wheat Microsatellite Consortium (WMC), INRA Clermont-Ferrand (CFA, CFD) and Gatersleben D-genome microsatellite (GDM) were obtained from the Grain Genes website (http://wheat.pw.usda.gov/GG2/index.shtml) and pub-lic available information [31–33]. EST-SSR markers were developed according to flanking se-quences of microsatellite motifs in wheat ESTs deposited in public EST databases. The polymorphic markers were used to genotype the RIL population. The PCR reactions were per-formed with an ABI9700 in a total volume of 10μL containing 10 mM Tris-Hcl, pH 7.5, 50 mM MgCl2,0.2 mM dNTP, 25 ng of each primer, 0.75 U of Taq polymerase, and 50 ng of genomic DNA as the template. After an initial denaturing step for 5 min at 94°C, 35 cycles were performed for 45 s at 94°C, 55–60°C (depending on the specific primers) for 45 s, and 72°C for 70 s, with a final extension at 72°C for 10 min. PCR products were separated in 8% non-denaturing polyacrylamide gels, visualized by silver staining and photographed.
Infinium iSelect SNP Genotyping
A total of 9,000 SNPs were selected based on their distribution across genome and frequency in the discovery population [28]. SNP genotyping was performed on the BeadStation and iScan instruments and conducted at the Genome Center of the University of California at Davis ac-cording to the manufacturer’s protocols (Illumina). Single nucleotide polymorphism allele clustering and genotype calling was performed with GenomeStudio v2011.1 software as de-scribed in Cavanagh et al. [28]. A genotype calling algorithm was generated for bread wheat using an iterative process to account for observed shifts in SNP allele cluster positions caused by differences in the number of duplicated (homeologous and paralogous) gene copies detected between assays [28,34].
High Density Linkage Map Construction and QTL Analysis
The linkage map was constructed with MultiPoint software and MAPMAKER/EXP version 3.0 [35] with a minimum LOD of 3.0 and maximum recombination fraction of 0.372. The
Results
Phenotypic Variation and Correlation Analysis
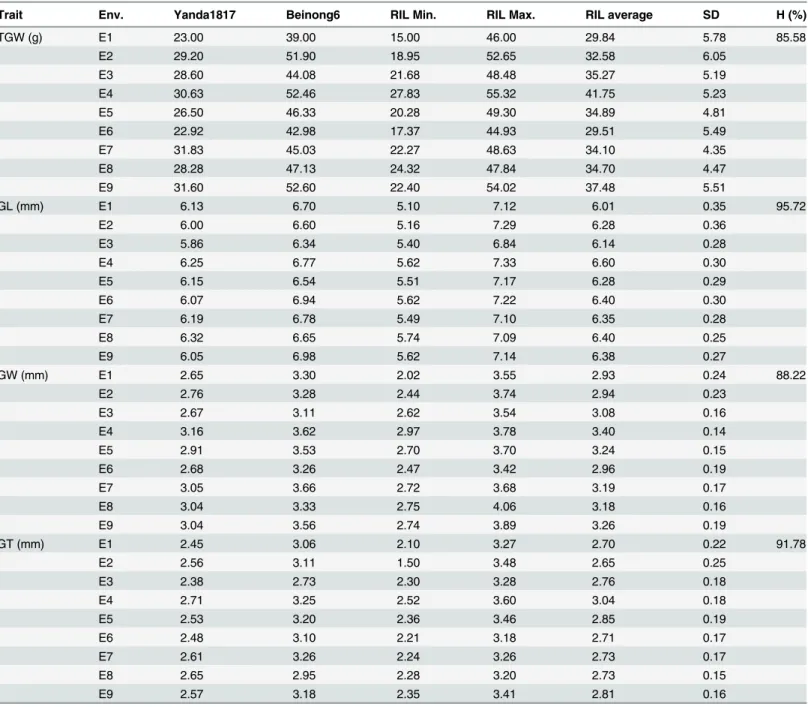
Field trials were conducted at Beijing, Shijiazhuang and Kaifeng under different agro-climatic conditions for five continuous years (2010–2014 in 9 total environments) to evaluate TGW, GL, GW and GT variation amongst the two parents (Yanda1817 and Beinong6) and the RIL populations. Beinong6 consistently showed higher values than Yanda1817 for all the grain traits tested in 9 environments (Table 1;S1 Table). The frequency distributions of the investi-gated traits reveled continuous variations and transgressive segregation in the RIL populations, suggesting that the phenotypic data of TGW, GL, GW and GT are normally distributed and that the traits are controlled by multiple loci. The heritability frequencies for TGW, GL, GW and GT are 85.58%, 95.72%, 88.22% and 91.78%, respectively, indicating that the grain shape and size are stable and are mainly under genetic control (Table 1;S1 Table).
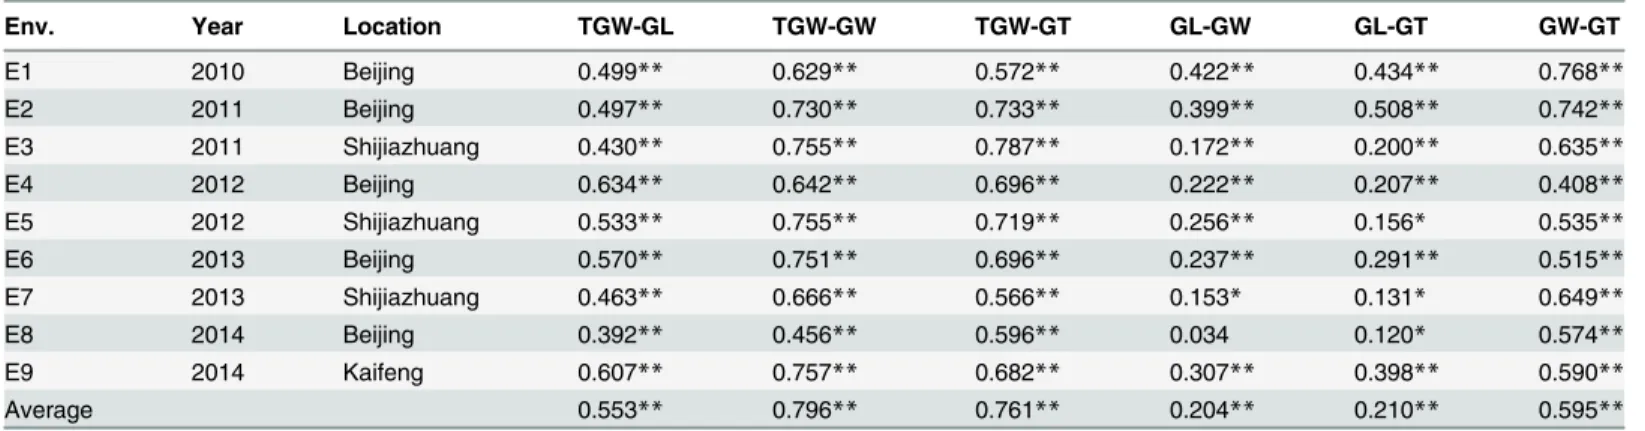
Correlation coefficients (r) among the TGW, GL, GW and GT traits in different environ-ments were calculated. All the four traits showed significant positive correlations with each other (significant at P = 0.01) (Table 2). The highest positive correlation was observed between TGW and GW (r = 0.796), followed by TGW and GT (r = 0.761). The correlation between GL and GW was very weak (r = 0.204), as well as between GL and GT (r = 0.210).
Genetic Linkage Map Construction
Out of 500 genomic SSR and EST-SSR primer pairs screened, 150 polymorphic markers were selected for RIL genotyping. Out of 8632 designated and validated SNPs in the 9k Infinium chip, 2873 SNPs were polymorphic between the parental lines Yanda1817 and Beinong6, as well as the RIL populations. Based on the 90K SNP consensus map [34] and after removing ambiguous and unlinked markers, the final genetic linkage map consists of 128 SSR, EST-SSR and 2431 SNP markers (mapped in 1062 polymorphic loci) that covered all the 21 wheat chro-mosomes (Table 3;S2 Table). Chromosomes 4A, 7B and 7D were integrated by two linkage groups, respectively. The entire map spaned 3213.2 cM including nine gaps (>30cM) distribut-ed on chromosomes 1D, 2D, 3A, 3D, 6A and 7D. However, the number of markers on each chromosome was uneven, ranging from 5 on 4D to 329 on 5B. The genetic coverage of each chromosome varied from 19.1 cM (4D) to 292.9 cM (5A). All together, the markers mapping on the B genome (1301) were greatly more than those on the A genome (1093), and consider-ably fewer markers (165) mapped on the D genome. Only the long arm was mapped for chro-mosome 1B which is consistent with the fact that Beinong6 is a 1BL/1RS translocation line (data not shown). However, only a 41.3 cM genetic coverage was found for the centromere re-gion of chromosome 1AL, and this was far below the aveage coverage of the A genome chro-mosomes (Table 3;S2 Table). No polymorphic SNPs was identified between Yanda1817 and Beinong6 for chromosome 1AS and the distal region of 1AL after checking the SNP mapping data [28,34]. The possible reason for this may be that the chromosome regions of 1AS and the distal regions of 1AL have the same genetic backgrounds between Yanda1817 and Beinong6.
Marker Density
addition to the gaps, 40 marker clusters (10 makers at one locus) were spreaded over chro-mosomes 1A, 1B, 2A, 2B, 3A, 3B, 4A, 4B, 5A, 5B, 6A, 6B, 6D and 7A (S2 Table). The largest marker cluster was found on chromosome 5B, which contains 63 markers, while only 6 clusters mapped on chromosome 2B. To facilicate data analysis of the 2559 markers mapping in the 1062 loci, only one marker was selected from each locus for QTL mapping. The average locus
Table 1. Phenotypic performance and distribution parameters for grain traits of parents and RILs in nine environments.
Trait Env. Yanda1817 Beinong6 RIL Min. RIL Max. RIL average SD H (%)
TGW (g) E1 23.00 39.00 15.00 46.00 29.84 5.78 85.58
E2 29.20 51.90 18.95 52.65 32.58 6.05
E3 28.60 44.08 21.68 48.48 35.27 5.19
E4 30.63 52.46 27.83 55.32 41.75 5.23
E5 26.50 46.33 20.28 49.30 34.89 4.81
E6 22.92 42.98 17.37 44.93 29.51 5.49
E7 31.83 45.03 22.27 48.63 34.10 4.35
E8 28.28 47.13 24.32 47.84 34.70 4.47
E9 31.60 52.60 22.40 54.02 37.48 5.51
GL (mm) E1 6.13 6.70 5.10 7.12 6.01 0.35 95.72
E2 6.00 6.60 5.16 7.29 6.28 0.36
E3 5.86 6.34 5.40 6.84 6.14 0.28
E4 6.25 6.77 5.62 7.33 6.60 0.30
E5 6.15 6.54 5.51 7.17 6.28 0.29
E6 6.07 6.94 5.62 7.22 6.40 0.30
E7 6.19 6.78 5.49 7.10 6.35 0.28
E8 6.32 6.65 5.74 7.09 6.40 0.25
E9 6.05 6.98 5.62 7.14 6.38 0.27
GW (mm) E1 2.65 3.30 2.02 3.55 2.93 0.24 88.22
E2 2.76 3.28 2.44 3.74 2.94 0.23
E3 2.67 3.11 2.62 3.54 3.08 0.16
E4 3.16 3.62 2.97 3.78 3.40 0.14
E5 2.91 3.53 2.70 3.70 3.24 0.15
E6 2.68 3.26 2.47 3.42 2.96 0.19
E7 3.05 3.66 2.72 3.68 3.19 0.17
E8 3.04 3.33 2.75 4.06 3.18 0.16
E9 3.04 3.56 2.74 3.89 3.26 0.19
GT (mm) E1 2.45 3.06 2.10 3.27 2.70 0.22 91.78
E2 2.56 3.11 1.50 3.48 2.65 0.25
E3 2.38 2.73 2.30 3.28 2.76 0.18
E4 2.71 3.25 2.52 3.60 3.04 0.18
E5 2.53 3.20 2.36 3.46 2.85 0.19
E6 2.48 3.10 2.21 3.18 2.71 0.17
E7 2.61 3.26 2.24 3.26 2.73 0.17
E8 2.65 2.95 2.28 3.20 2.73 0.15
E9 2.57 3.18 2.35 3.41 2.81 0.16
E1, E2, E3, E4, E5, E6, E7, E8 and E9 represent Beijing 2010, Beijing 2011, Shijiazhuang 2011, Beijing 2012, Shijiazhuang 2012, Beijing 2013, Shijiazhuang 2013, Beijing 2014 and Kaifeng 2014, respectively.
Table 2. Correlation coefficients between TGW, KL, GW, and GT in the RIL population in different environments.
Env. Year Location TGW-GL TGW-GW TGW-GT GL-GW GL-GT GW-GT
E1 2010 Beijing 0.499** 0.629** 0.572** 0.422** 0.434** 0.768**
E2 2011 Beijing 0.497** 0.730** 0.733** 0.399** 0.508** 0.742**
E3 2011 Shijiazhuang 0.430** 0.755** 0.787** 0.172** 0.200** 0.635**
E4 2012 Beijing 0.634** 0.642** 0.696** 0.222** 0.207** 0.408**
E5 2012 Shijiazhuang 0.533** 0.755** 0.719** 0.256** 0.156* 0.535**
E6 2013 Beijing 0.570** 0.751** 0.696** 0.237** 0.291** 0.515**
E7 2013 Shijiazhuang 0.463** 0.666** 0.566** 0.153* 0.131* 0.649**
E8 2014 Beijing 0.392** 0.456** 0.596** 0.034 0.120* 0.574**
E9 2014 Kaifeng 0.607** 0.757** 0.682** 0.307** 0.398** 0.590**
Average 0.553** 0.796** 0.761** 0.204** 0.210** 0.595**
*and**indicate significance levels at the P = 0.05 and 0.01 (2-tailed), respectively.
doi:10.1371/journal.pone.0118144.t002
Table 3. Distribution of markers and marker density across chromosomes in the common wheat map developed in Yanda1817 × Beinong6 RILs population.
Chromosome No. of markers No. of loci Map distance (cM) Map density (cM/marker) Map density (cM/locus)
1A 57 28 41.3 0.72 1.48
2A 234 93 187.0 0.80 2.01
3A 156 60 214.2 1.37 3.57
4A 162 61 182.6 1.13 2.99
5A 219 91 292.9 1.34 3.22
6A 108 43 146.6 1.36 3.41
7A 157 74 129.3 0.82 1.75
1B 193 67 179.8 0.93 2.68
2B 230 60 173.5 0.75 2.89
3B 228 86 263.3 1.15 3.06
4B 64 32 135.4 2.12 4.23
5B 329 119 279.6 0.85 2.35
6B 159 68 120.9 0.76 1.78
7B 98 66 221.7 2.26 3.36
1D 47 27 106.9 2.27 3.96
2D 22 16 76.2 3.46 4.76
3D 10 10 178.3 17.83 17.83
4D 5 5 19.1 3.82 3.82
5D 8 8 44.3 5.54 5.54
6D 59 34 150.6 2.55 4.43
7D 14 14 69.7 4.98 4.98
A genome 1093 450 1193.9 1.09 2.65
B genome 1301 498 1374.2 1.06 2.76
D genome 165 114 645.1 3.91 5.66
Total 2559 1062 3213.2 1.26 3.03
density of the genetic linkage map was 3.03 cM/locus with 2.65, 2.76 and 5.66 cM/locus for the A, B and D subgenomes, respectively (Table 3).
Segregation Distortion Regions
Of the 1062 loci mapped in the Yanda1817 / Beinong6 genetic linkage map, 328 loci (31%) demonstrated genetic distortion (Chi-Square<0.05) in the RIL population (S3 Table). Among the segregation distortion (SD) loci, one thrid of them (32.9%) were distorted in favor of Bei-nong6 and two thrids (67.1%) favored Yanda1817. Thrity-eight SD regions (SDR,3 SD loci) were distributed in the whole genome except for chromosomes 1D, 2A, 3D, 5D and 7D (S3 Table). Among the SDRs, 24 were found in the B subgenome and 10 were identified in the A subgenome. Two large SDRs, SDR-1B (55 locus) were skewed to Yanda1817 and SDR-7A.3 (43 locus) favored Beinong6. SDR-1B may result from the 1RS/1BL translocation in Beinong6.
QTL Analysis
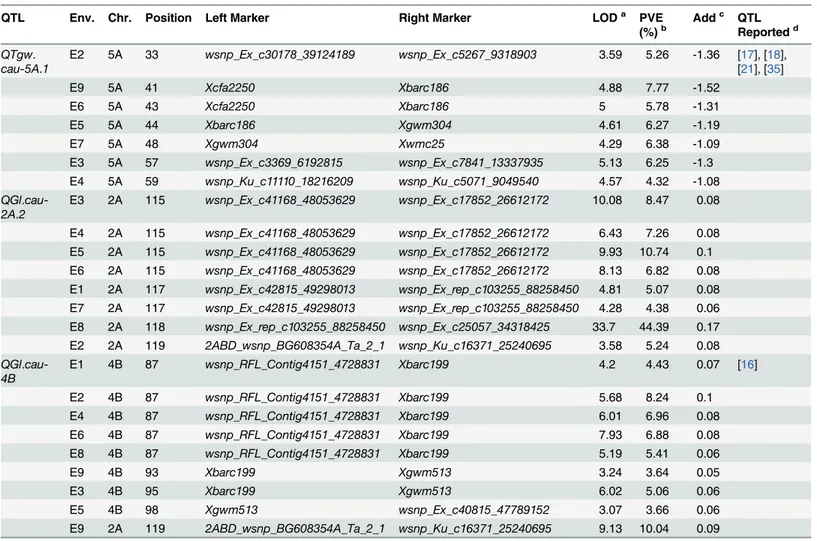
QTL mapping analyses revealed 88 putative additive QTLs for the four grain traits with pheno-typic variations of single QTL ranging from 2.55% to 44.39% in different environments, and QTLs were detected on all 21 chromosomes (Table 4,5;Fig. 1;S4,S5 Table). Chromosome 5A and 6B have a great number of identified QTLs, but chromosomes 1D, 2D, 5D, 6D and 7D have only one mapped QTL. Some QTLs appeared to be identical are closely linked even through the peaks were not at the same position. Thirty-nine individual QTLs (44.3% of all the QTLs) could be observed in at least two environments, of which 30 (76.9%) were associated with increased grain weight and size, through the Beinong6 alleles were mainly distributed on chrompsome 1B, 5A, 5B and 6B. Co-localized QTLs for different traits were also found on chromosomes 1B, 2A, 3B, 4A, 4D, 5A and 6B.
Seventeen QTLs for TGW were detected on chromosomes 1A, 1B, 2A, 2B, 3A, 3B, 3D, 4A, 4D, 5A, 5B and 6B with phenotypic variations ranging from 2.62% to 12.08% (Table 4;S4 Table). Seven QTLs (QTgw.cau-1A,QTgw.cau-1B,QTgw.cau-4A.1,QTgw.cau-4D,QTgw. cau-5A.2,QTgw.cau-5BandQTgw.cau-6B.2) were identified in two environments and five QTLs,
QTgw.cau-3D.1,QTgw.cau-6B.1,QTgw.cau-4A.2,QTgw.cau-6B.3andQTgw.cau-2A, were de-tected in three to five environments, indicating that these QTLs are relatively stable.QTgw. cau-5A.1, which is the most stable QTL, could be found in seven environments except for E1 and E8. Only four QTLs mapped in one environment.
Thirty-two QTLs for GL mapped on chromosomes 1B, 1D, 2A, 2B, 2D, 3B, 3D, 4A, 4B, 4D, 5A, 5B, 6B, 7A and 7B. Each of these QTLs explaining the proportion of phenotypic variation ranged from 2.62% to 44.39% (Table 4;S4 Table). Among these QTLs,QGl.cau-2A.2had the highest phenotypic variation and was the most stable QTL detected in all nine environments.
QGl.cau-4Bwas identified in eight environments, whileQGl.cau-5A.3,QGl.cau-5B.2andQGl.
cau-7A.2were present in six environments.QGl.cau-1B.1andQGl.cau-2B.1were found in five environments and two QTLs,QGl.cau-3B.1andQGl.cau-3B.2, could to be detected in four en-vironments. FurthermoreQGl.cau-1B.3,QGl.cau-5A.1,QGl.cau-6B.1,QGl.cau-6B and QGl.
cau-7B.2were observed in two or three environments and the remaining 14 QTLs were only found in one environment. Chromosome regions contributing to GL were associated with chromosomes 2A, 2B, 3B, and 4B of Yanda1817, and chromosomes 1B, 4A, 4D, 5A, 5B, 6B, 7A and 7B of Beinong6.
the phenotypic variation. QTLQGw.cau-6B.1was detected in five environments, whereas
QGw.cau-5A.2andQGw.cau-7Dwere identified in three and two environments, respectively. A total of twenty-seven QTLs for GT were identified on chromosomes 1A, 2A, 2B, 3A, 3B, 3D, 4A, 5A, 5B, 5D, 6A, 6B, 6D, 7A and 7B (Table 5;S4 Table). Among these,QGt.cau-5A.1, the most stable QTL locus for grain thickness and was detected in all nine environments with phenotypic variations of more than 10% in six environments.QGt.cau-3B.2was detected in seven environments with the highest phenotypic variation of 36.42%. Three QTLs,QGt. cau-6B,QGt.cau-5A.3andQGt.cau-7A, were expressed in five, four and three environments, re-spectively, whileQGt.cau-3B.1,QGt.cau-4A.1andQGt.cau-6Dwere observed in
two environments.
Table 4. Partial stable QTLs for TGW and GL detected in the Yanda1817/Beinong6 RIL population.
QTL Env. Chr. Position Left Marker Right Marker LODa PVE
(%)b
Addc QTL Reportedd
QTgw.
cau-5A.1
E2 5A 33 wsnp_Ex_c30178_39124189 wsnp_Ex_c5267_9318903 3.59 5.26 -1.36 [17], [18], [21], [35]
E9 5A 41 Xcfa2250 Xbarc186 4.88 7.77 -1.52
E6 5A 43 Xcfa2250 Xbarc186 5 5.78 -1.31
E5 5A 44 Xbarc186 Xgwm304 4.61 6.27 -1.19
E7 5A 48 Xgwm304 Xwmc25 4.29 6.38 -1.09
E3 5A 57 wsnp_Ex_c3369_6192815 wsnp_Ex_c7841_13337935 5.13 6.25 -1.3
E4 5A 59 wsnp_Ku_c11110_18216209 wsnp_Ku_c5071_9049540 4.57 4.32 -1.08
QGl. cau-2A.2
E3 2A 115 wsnp_Ex_c41168_48053629 wsnp_Ex_c17852_26612172 10.08 8.47 0.08
E4 2A 115 wsnp_Ex_c41168_48053629 wsnp_Ex_c17852_26612172 6.43 7.26 0.08 E5 2A 115 wsnp_Ex_c41168_48053629 wsnp_Ex_c17852_26612172 9.93 10.74 0.1 E6 2A 115 wsnp_Ex_c41168_48053629 wsnp_Ex_c17852_26612172 8.13 6.82 0.08 E1 2A 117 wsnp_Ex_c42815_49298013 wsnp_Ex_rep_c103255_88258450 4.81 5.07 0.08 E7 2A 117 wsnp_Ex_c42815_49298013 wsnp_Ex_rep_c103255_88258450 4.28 4.38 0.06 E8 2A 118 wsnp_Ex_rep_c103255_88258450 wsnp_Ex_c25057_34318425 33.7 44.39 0.17 E2 2A 119 2ABD_wsnp_BG608354A_Ta_2_1 wsnp_Ku_c16371_25240695 3.58 5.24 0.08
QGl. cau-4B
E1 4B 87 wsnp_RFL_Contig4151_4728831 Xbarc199 4.2 4.43 0.07 [16]
E2 4B 87 wsnp_RFL_Contig4151_4728831 Xbarc199 5.68 8.24 0.1
E4 4B 87 wsnp_RFL_Contig4151_4728831 Xbarc199 6.01 6.96 0.08
E6 4B 87 wsnp_RFL_Contig4151_4728831 Xbarc199 7.93 6.88 0.08
E8 4B 87 wsnp_RFL_Contig4151_4728831 Xbarc199 5.19 5.41 0.06
E9 4B 93 Xbarc199 Xgwm513 3.24 3.64 0.05
E3 4B 95 Xbarc199 Xgwm513 6.02 5.06 0.06
E5 4B 98 Xgwm513 wsnp_Ex_c40815_47789152 3.07 3.66 0.06
E9 2A 119 2ABD_wsnp_BG608354A_Ta_2_1 wsnp_Ku_c16371_25240695 9.13 10.04 0.09
aLOD score from the location with the underlinedP-value
bPVE (%) = phenotypic variance estimated from marker regression against phenotype
cAdditive effect. Positive values indicate a positive effect of Yanda1817 alleles, whereas negative values indicate the contribution of the Beinong6 allele dQTL reported by references
Discussion
A High-Density Linkage Map for QTL Mapping
Improvement of grain weight and size has always been a challenging task for breeders because it is very difficult to select complex quantitative traits such as TGW, GL, GW and GT directly. Therefore, marker-assisted selection (MAS) has been proposed as an alternative approach for indirect selection to improve the grain weight and size. With a complex and large genome, high-density marker coverage of the genome is crucial for QTL mapping in common wheat.
Previous genetic linkage maps used for QTL detection in wheat generally contained hun-dreds of markers, mostly AFLPs and SSRs, which were laborious and time-consuming to devel-op [38–42]. Here, we have constructed a high-density genetic linkage map consisting of 2559 markers (1062 polymorphic loci) that spanns 3213.2 cM covering all 21 wheat chromosomes using the recent developed Infinium iSelect 9K SNP assay intergrated with SSR and EST-SSR markers. The coverage of the Yanda1817/Beinong6 genetic linkage map is in agreement with
Table 5. Partial stable QTLs for GW and GT detected in the Yanda1817/Beinong6 RIL population.
QTL Env. Chr. Position Left Marker Right Marker LODa PVE (%)b Addc QTL
Reportedd
QGw. cau-5A.1
E1 5A 27 Xcfd81 wsnp_Ex_c15046_23216392 3.3 4.39 -0.05 [18]
E3 5A 39 wsnp_Ex_c62351_62025537 Xcfa2250 6.82 11.03 -0.05
E9 5A 41 Xcfa2250 Xbarc186 4.42 7.28 -0.05
E6 5A 45 Xbarc186 Xgwm304 5.92 8.63 -0.06
E5 5A 47 Xgwm304 Xwmc25 7.15 10.12 -0.05
E7 5A 47 Xgwm304 Xwmc25 7.89 12.3 -0.06
E4 5A 55 Xgwm293 5ABD_wsnp_BE500291A_Ta_2_1 9.13 12.03 -0.05
QGt. cau-3B.2
E1 3B 107 wsnp_Ex_c15944_24350833 wsnp_Ex_c4888_8713275 6.37 7.42 -0.06
E4 3B 111 wsnp_Ex_c4888_8713275 wsnp_JD_c8629_9594108 9.07 8.04 -0.05 E3 3B 112 wsnp_JD_c8629_9594108 wsnp_Ex_c13906_21771680 3.22 2.89 -0.03 E6 3B 112 wsnp_JD_c8629_9594108 wsnp_Ex_c13906_21771680 4.18 3.99 -0.03 E2 3B 113 wsnp_JD_c8629_9594108 wsnp_Ex_c13906_21771680 4.07 6.41 -0.06 E5 3B 115 wsnp_JD_c9902_10674725 wsnp_Ex_c19982_29009504 27.16 36.42 -0.11 E8 3B 115 wsnp_JD_c9902_10674725 wsnp_Ex_c19982_29009504 4.83 6.93 -0.04
QGt. cau-5A.1
E1 5A 28 Xcfd81 wsnp_Ex_c15046_23216392 8.71 10.61 -0.07
E2 5A 33 wsnp_Ex_c30178_39124189 wsnp_Ex_c5267_9318903 4.69 7.06 -0.06 E3 5A 34 wsnp_Ex_c30178_39124192 wsnp_Ex_c5267_9318906 16.47 16.72 -0.07 E4 5A 34 wsnp_Ex_c30178_39124192 wsnp_Ex_c5267_9318906 23.55 23.59 -0.08 E5 5A 34 wsnp_Ex_c30178_39124192 wsnp_Ex_c5267_9318906 11.27 12.87 -0.07
E8 5A 38 wsnp_Ex_c62351_62025537 Xcfa2250 4.3 6.82 -0.04
E6 5A 42 Xcfa2250 Xbarc186 18.26 19.85 -0.08
E9 5A 42 Xcfa2250 Xbarc186 10.99 17.43 -0.07
E7 5A 48 Xgwm304 Xwmc25 15.28 21.11 -0.08
aLOD score from the location with the underlinedP-value
bPVE (%) = phenotypic variance estimated from marker regression against phenotype
cAdditive effect. Positive values indicate a positive effect of Yanda1817 alleles, whereas negative values indicate the contribution of the Beinong6 allele dQTL reported by references
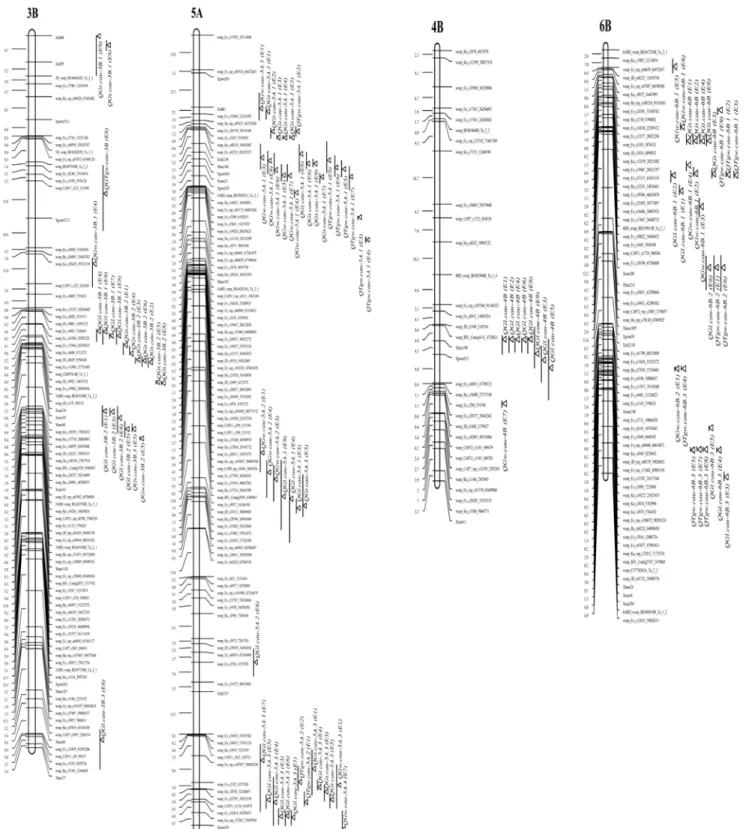
Fig 1. Partial pleiotropic QTL effects for TGW, GW and GT.Distribution of the detected QTLs for TGW, GL, GW and GT of the Yanda1817/Beinong6 RILs on the chromosome 3B, 4B, 5A and 6B. Supported intervals for QTL are indicated by vertical bars, the length of the bar show a one LOD confidence interval. LOD max is pointed by atriangle.
previously reported maps in common wheat with genetic coverage from 1070 cM [5] to 4223.1 cM [41]. The B genome has the longest length and the most markers, which is also consistent with earlier reports [5,7,22,27]. In our genetic linkage map, the marker density was 1.26 cM/ marker, far less than 3.7cM to 14.8cM per marker in previously reported wheat genetic linkage maps [5,7,27,40].
Another advantage of the Infinium iSelect 9K SNP assay was the high throughtput genotyp-ing of multiply DNA samples at the same time. As the accuracy of a genetic linkage map was heavily influenced by population size, our mapping population containing 269 RILs is large enough to develop a high-density genetic linkage map with adequate genetic information for QTL analysis.
A significant phenomenon noticed in our study was the SNP marker clusters and gaps in the SNP only genetic linkage map. One possible reason may be that the SNPs were developed from the transcriptomes of 26 hexaploid wheat accessions and that most of the SNPs were de-rived from the gene-rich regions. Another version may be because the mapping population used for linkage map construction was developed from a cross between two Chinese wheat lines and some of the SNPs in the 9k Infinium chip were absent in the RILs. Therefore, we inte-grated 128 SSR and EST-SSR markers in the genetic linkage map to close some of the gaps.
Low Level of Polymorphism in the D Genome
The polymorphic ratio of SSR and EST-SSR markers is about 30% (150/500) at the whole ge-nome level in our mapping population, whereas a higher polymorphic ratio (33.3%, 2873/ 8632) was observed for SNPs. We detected relatively high SNP and SSR polymorphism levels in our mapping population and a possible reason may be due to the high divergence of the two parental lines: Yanda1817 is a Chinese landrace while Beinong6 is an advanced semi-dwarf high-yielding breeding line.
In the 3 sub-genomes, B and A have the most polymorphic markers and the D genome has the lowest number of markers. Out of 2559 polymorphic markers, only 165 markers (6.4%) mapped on the D genome, which is consistent with previous studies [33,43–46]. The low ge-netic coverage of the D genome may be responsible for the low number of QTLs in the D genome.
After two polyploidization events during the common wheat evolution, the gene flow be-tweenAe.tauschiiandT.aestivumwas limited to only a small population/accessionsAe. stra-gulatafrom north Iran and the southwest Caspian sea introgressed into hexaploid wheat, whereas a continuous gene flow occurred due to frequent hybridization betweenT.aestivum
and tetraploid wheat species, and these events increased the diversity of the A and B genomes [47–49]. Increasing the genetic diversity of the D genome is still an urgent task for wheat breed-ers. Considering that many important genes/QTLs controlling agronomic traits were located on the D genome, additional work to increase the number and density of markers in the D ge-nome should be considered by applying new approach like next generation sequencing (NGS).
QTLs for Grain Shape and Size
TGW has been subjected to QTL analysis in many studies but very limited information is avail-able for QTL mapping of GL, GW and GT in wheat. To date, QTLs for grain shape and size have been detected on almost all 21 wheat chromosomes [3,4,9–12,20,22–25,27,38,39,50–53]. Using introgression lines (ILs), Röder et al. described fine mapping ofQTgw.ipk-7Dassociated with the microsatellite markerXgwm1002–7D[13]. Due to the low coverage of chromosome
doubled haploid (DH) populations and RILs, respectively. Furthermore,TaGW2, the ortholog ofOsGW2in rice [54], was mapped earlier on 6AS and considered to be a candidate gene relat-ed to wheat grain development [6]. However, we did not detect any QTL on chromosome 6AS in our genetic map. In addition, due to the diversity of mapping populations, field trail condi-tions, and genetic coverage of the linkage maps used for QTL mapping, QTLs were often ob-served on different chromosome regions for grain weight and size when analyses were carried out with different phenotypic variation effects. Therefore, more refined analyses we focused on the QTLs detected at least in more than two environments.
We detected 17 QTLs for TGW and thirteen of these were found in at least two environ-ments. In order to compare our QTL mapping data with published results, we used the inte-grated high-density SSR genetic linkage map [33] as a reference to anchor SSR markers and mapped QTLs (Table 4;S4,S5 Table).QTgw.cau-6B.1andQTgw.cau-3D.1were newly identi-fied QTLs in three environments with phenotypic variation from 2.98% to 9.90%.QTgw. cau-1Bwas located in chromosome 1B near theXgwm268–1Blocus where an important QTL for
TGW was previously identified using 262 accessions from a mini-core collection of Chinese wheat [26]. Similarly,QTgw.cau-2Afor TGW was detected in the interval of Xgwm249-Xgwm473on chromosome 2A, which corresponds to the QTLs previously found by Sun et al. [7], Huang et al. [24] and Wu et al. [55], respectively.QTgw.cau-4Dwas closely linked to mark-erXcfd71which may correspond to the TGW QTL reported by Huang et al. [39]. The QTL
QTgw.cau-5A.1detected in two environments mapped in a position that also has been de-scribed by many researchers [22,23,26,27,40,52,53], indicating its stability and major effects. TheQTgw.cau-5A.2was detected in two environments and located on the end of 5AL. In the same genetic region, QTLs for TGW were also reported by Mir et al. [56] with interval and as-sociation mapping and by Wu et al. [55] with a DH population genetic map. The interval of
QTgw.cau-5Bwas described by Patil et al. [52] and is similar to the TGW QTL identified by Groos et al. [38] and Wang et al. [27]. In addition, Cui et al. [57] and Wu et al. [55] also de-tected QTLs for kernel weight per spike (KWPS) or TGW in same chromosome region. The
QTgw.cau-6B.2identified in two environments may be same as that reported by Sun et al. [7]. Out of the 14 QTLs for GL that we detected in more than one environment, five were de-scribed in previous studies and the remaining nine may be new loci. QTLQGl.cau-1Bpresent in 5 environments in our study was linked to markerXgwm259. Sun et al. [7] also detected a QTL for GL that is associated with SSR markerXgwm140which is closely linked with
Xgwm259. A GL QTL reported by Gegas et al. [23] maps at the same location asQGl.cau-3B.1
in our mapping study. By using two hexaploid wheat mapping populations, Breseghello and Sorrells [21] detected two QTLs for GL on 4B and 5B, which are close toQGl.cau-4BandQGl.
cau-5B.2location in our study. On chromosome 7A, the detected QTLQGl.cau-7A.2seems to correspond with the QTL previously detected by Williams et al. [11].
Four GW QTLs located on 5A, 6B and 7D were detected in more than one environment, and among theses, onlyQGw.cau-5A.1was previously described [23].
QTL for grain thickness was rarely reported previously in wheat [10–12]. In our study, the GT QTLs,QGt.cau-3B.2,QGt.cau-5A.1,QGt.cau-5A.3andQGt.cau-6B, were identified in more than four environments. Due to the diversity of molecular markers, it was difficult to align and compare QTLs detected by these studies. TGW, GL and GW QTLs were also detected at the same chromosome regions, indicating possible linkage or pleiotropic effects.
Trait Correlations and QTL Clustering
were especially prevalent on chromosomes 3B, 5A and 6B. Two QTL clusters were identified on chromosome 5A. One was located on the distal end of 5AS and is involved in controlling TGW, GW and GT. Another cluster on the distal end of 5AL is involved in regulating a GT QTL detected in four environments, a TGW QTL detected in two environments, a GL QTL de-tected in six environments, and a GW QTL was identified in only one environment. On chro-mosome 6B, QTL clusters were mainly related to TGW, GW and GT. As previous described [7,23,38,50,53,58,59] this is consistent with the positive relationships between the four grain shape and size traits, especially among TGW, GW and GT. These QTL clusters for TGW, GL, GW and GT provide important information for wheat breeders to improve the grain shape and size via marker-assisted selection.
Supporting Information
S1 Fig. The three locations {Beijing, Hebei (HB), and Henan (HN)}for field trails evalua-tion.
(PPTX)
S1 Table. The phenotypic data of Yada1817, Beinong6 and the RILs in 9 environments. (XLSX)
S2 Table. The original SNP and SSR mapping data of the 269 RILs. (XLSX)
S3 Table. Chi-square test for segregation distortion of locus in RIL population. (XLSX)
S4 Table. QTLs detected on different chromosomes. (DOCX)
S5 Table. QTLs Mapping of all the chromosomes (XLSX)
Acknowledgments
The authors are grateful to Andrew O. Jackson of University of California at Berkeley for edit-ing the manuscript.
Author Contributions
Conceived and designed the experiments: QHW YXC MCL JH ZYL. Performed the experi-ments: QHW YXC SHZ LF JJC YX DZ SHO XJZ YC DYZ YL ZZW JZX JXQ GXW MHY PL LLW LW HW CD JL YZ CGY MSY QXS. Analyzed the data: QHW JZX DLL YLH HRP JRW MCL ZYL. Contributed reagents/materials/analysis tools: LXW JRW JH ZYL. Wrote the paper: QHW SHO ZYL.
References
1. Gupta PK, Rustgi S, Kumar N (2006) Genetic and molecular basis of grain size and grain number and its relevance to grain productivity in higher plants. Genome 49:565–571 PMID:16936836
2. Pozzi C, Rossini L, Vecchietti A, Salamini F (2005) Gene and genome changes during domestication of cereals. Cereal Genomics. Springer, pp 165–198
3. Campbell KG, Bergman CJ, Gualberto DG, Anderson JA, Giroux MJ, et al. (1999) Quantitative trait loci associated with kernel traits in a soft × hard wheat cross. Crop Science 39:1184–1195
5. Ramya P, Chaubal A, Kulkarni K, Gupta L, Kadoo N, et al. (2010) QTL mapping of 1000-kernel weight, kernel length, and kernel width in bread wheat (Triticum aestivumL.). J of Appl Gene 51:421–429 doi: 10.1111/j.1472-765X.2010.02910.xPMID:20796212
6. Su Z, Hao C, Wang L, Dong Y, Zhang X (2011) Identification and development of a functional marker of
TaGW2associated with grain weight in bread wheat (Triticum aestivumL.). Theor Appl Genet 122:211–223 doi:10.1007/s00122-010-1437-zPMID:20838758
7. Sun XY, Wu K, Zhao Y, Kong FM, Han GZ, et al. (2009) QTL analysis of kernel shape and weight using recombinant inbred lines in wheat. Euphytica 165:615–624
8. Giura A, Saulescu N (1996) Chromosomal location of genes controlling grain size in a large grained se-lection of wheat (Triticum aestivumL.). Euphytica 89:77–80
9. Varshney RK, Prasad M, Roy JK, Kumar N, Singh H, et al. (2000) Identification of eight chromosomes and one microsatelite marker on 1AS associated with QTL for grain weight in bread wheat. Theor Appl Genet 100:1290–1295
10. Williams K, Munkvold J, Sorrells M (2013) Comparison of digital image analysis using elliptic fourier de-scriptors and major dimensions to phenotype seed shape in hexaploid wheat (Triticum aestivumL.). Euphytica 190:99–116
11. Williams K, Sorrells M (2014) Three-dimensional seed size and shape QTL in hexaploid wheat ( Triti-cum aestivumL.) populations. Crop Sci 54:98–110
12. Rasheed A, Xia XC, Ogbonnaya F, Mahmood T, Zhang ZW, et al. (2014) Genome-wide association for grain morphology in synthetic hexaploid wheats using digital imaging analysis. BMC Plant Biology 14:128 doi:10.1186/1471-2229-14-128PMID:24884376
13. Röder MS, Huang XQ, Rörner A (2008) Fine mapping of the region on wheat chromosome 7D control-ling grain weight. Funct Integr Genomics 8:79–86 PMID:17554574
14. Ma D, Yan J, He Z (2012) Characterization of a cell wall invertase geneTaCwi-A1on common wheat chromosome 2A and development of functional markers. Mol Breed 29:43–52
15. Jiang Q, Hou J, Hao C (2011) The wheat (T. aestivum) sucrose synthase 2 gene (TaSus2) active in en-dosperm development is associated with yield traits. Funct Integr Genomics 11:49–61 doi:10.1007/ s10142-010-0188-xPMID:20821031
16. Zhang L, Zhao Y, Gao L, Zhao G, Zhou R, et al. (2012)TaCKX6-D1, the ortholog of riceOsCKX2, is as-sociated with grain weight in hexaploid wheat. New Phytol 195:574–584 doi:10.1111/j.1469-8137. 2012.04194.xPMID:22670578
17. Chang J, Zhang J, Mao X (2013) Polymorphism ofTaSAP1-A1and its association with agronomic traits in wheat. Planta 237:1495–1508 doi:10.1007/s00425-013-1860-xPMID:23462884
18. Guo Y, Sun J, Zhang G, Wang Y, Kong F, et al. (2013) Haplotype, molecular marker and phenotype ef-fects associated with mineral nutrient and grain size traits ofTaGS1ain wheat. Field Crops Res 154:119–125.
19. Kang G, Liu G, Peng X, Wei L, Wang C, et al. (2013) Increasing the starch content and grain weight of common wheat by overexpression of the cytosolic AGPase large subunit gene. Plant Physiol Biochem 73:93–98 doi:10.1016/j.plaphy.2013.09.003PMID:24080395
20. Ammiraju J, Dholakia B, Santra D, Singh H, Lagu M, et al. (2001) Identification of inter simple sequence repeat (ISSR) markers associated with seed size in wheat. Theor Appl Genet 102:726–732
21. Breseghello F, Sorrells ME (2007) QTL analysis of kernel size and shape in two hexaploid wheat map-ping populations. Field Crops Research 101:172–179
22. Cuthbert JL, Somers DJ, Brûlé-Babel AL, Brown PD, Crow GH (2008) Molecular mapping of quantita-tive trait loci for yield and yield components in spring wheat (Triticum aestivum L.). Theor Appl Genet 117:595–608 doi:10.1007/s00122-008-0804-5PMID:18516583
23. Gegas VC, Nazari A, Griffiths S, Simmonds J, Fish L, et al. (2010) A genetic framework for grain size and shape variation in wheat. The Plant Cell 22:1046–1056 doi:10.1105/tpc.110.074153PMID: 20363770
24. Huang X, Cöster H, Ganal M, Röder M (2003) Advanced backcross QTL analysis for the identification of quantitative trait loci alleles from wild relatives of wheat (Triticum aestivumL.). Theor Appl Genet 106:1379–1389 PMID:12750781
25. Kumar N, Kulwal PL, Gaur A, Tyagi AK, Khurana JP, et al. (2006) QTL analysis for grain weight in com-mon wheat. Euphytica 151:135–144
27. Wang R, Hai L, Zhang X, You G, Yan C, et al. (2009) QTL mapping for grain filling rate and yield-related traits in RILs of the Chinese winter wheat population Heshangmai× Yu8679. Theor Appl Genet 118:313–325 doi:10.1007/s00122-008-0901-5PMID:18853131
28. Cavanagh CR, Chao S, Wang S, Huang BE, Stephen S, et al. (2013) Genome-wide comparative diver-sity uncovers multiple targets of selection for improvement in hexaploid wheat landraces and cultivars. Proceedings of the National Academy of Sciences USA 110:8057–8062 doi:10.1073/pnas.
1217133110PMID:23630259
29. Zhuang Q (2003) Chinese wheat improvement and pedigree analysis. Beijing: China Agriculture Press (in Chinese)
30. Allen G, Flores-Vergara M, Krasynanski S, Kumar S, Thompson W (2006) A modified protocol for rapid DNA isolation from plant tissues using cetyltrimethylammonium bromide. Nature Protocols 1:2320–2325 PMID:17406474
31. Pestsova E, Ganal M, Röder M (2000) Isolation and mapping of microsatellite markers specific for the D genome of bread wheat. Genome 43:689–697 PMID:10984182
32. Röder MS, Korzun V, Wendehake K, Plaschke J, Tixier M-H, et al. (1998) A microsatellite map of wheat. Genetics 149:2007–2023 PMID:9691054
33. Somers DJ, Isaac P, Edwards K (2004) A high-density microsatellite consensus map for bread wheat (Triticum aestivumL.). Theor Appl Genet 109:1105–1114 PMID:15490101
34. Wang S, Wong D, Forrest K, Allen A, Chao S, et al. (2014) Characterization of polyploid wheat genomic diversity using a high-density 90 000 single nucleotide polymorphism array. Plant Biotechnology Jour-nal 12, pp. 787–796 doi:10.1111/pbi.12183PMID:24646323
35. Lincoln L, Lander E (1993) Constructing Genetic Linkage Maps with MAPMAKER/EXP Version 3.0: A Tutorial and Reference Manual. Cambridge: Lander ES:1–9
36. Kosambi D (1943) The estimation of map distances from recombination values. Annals of Eugenics 12:172–175
37. Liu R, Meng J (2003) MapDraw: a microsoft excel macro for drawing genetic linkage maps based on given genetic linkage data. Hereditas (Beijing) 25:317–321
38. Groos C, Robert N, Bervas E, Charmet G (2003) Genetic analysis of grain protein-content, grain yield and thousand-kernel weight in bread wheat. Theor Appl Genet 106:1032–1040 PMID:12671751
39. Huang X, Cloutier S, Lycar L, Radovanovic N, Humphreys D, et al. (2006) Molecular detection of QTLs for agronomic and quality traits in a doubled haploid population derived from two Canadian wheats ( Tri-ticum aestivumL.). Theor Appl Genet 113:753–766 PMID:16838135
40. Sun X, Marza F, Ma H, Carver BF, Bai G (2010) Mapping quantitative trait loci for quality factors in an inter-class cross of US and Chinese wheat. Theor Appl Genet 120:1041–1051 doi: 10.1007/s00122-009-1232-xPMID:20012855
41. Xue S, Zhang Z, Lin F, Kong Z, Cao Y, et al. (2008) A high-density intervarietal map of the wheat ge-nome enriched with markers derived from expressed sequence tags. Theor Appl Genet 117:181–189 doi:10.1007/s00122-008-0764-9PMID:18437345
42. Zanetti S, Winzeler M, Feuillet C, Keller B, Messmer M (2001) Genetic analysis of bread-making quality in wheat and spelt. Plant Breeding 120:13–19
43. Akhunov E, Nicolet C, Dvorak J (2009) Single nucleotide polymorphism genotyping in polyploid wheat with the Illumina GoldenGate assay. Theor Appl Genet 119:507–517 doi:10.1007/s00122-009-1059-5 PMID:19449174
44. Bérard A, Le Paslier MC, Dardevet M, Exbrayat-Vinson F, Bonnin I, et al. (2009) High-throughput single nucleotide polymorphism genotyping in wheat (Triticumspp.). Plant Biotechnology Journal 7:364–374 doi:10.1111/j.1467-7652.2009.00404.xPMID:19379285
45. Chao S, Zhang W, Akhunov E, Sherman J, Ma Y, et al. (2009) Analysis of gene-derived SNP marker polymorphism in US wheat (Triticum aestivumL.) cultivars. Molecular Breeding 23:23–33
46. Dvorak J, Akhunov ED (2005) Tempos of gene locus deletions and duplications and their relationship to recombination rate during diploid and polyploid evolution in theAegilops-Triticumalliance. Genetics 171:323–332 PMID:15996988
47. Dubcovsky J, Dvorak J (2007) Genome plasticity a key factor in the success of polyploid wheat under domestication. Science 316:1862–1866 PMID:17600208
49. Wang JR, Luo MC, Chen ZX, You FM, Wei YM, et al. (2013)Aegilops tauschiisingle nucleotide poly-morphisms shed light on the origins of wheat D-genome genetic diversity and pinpoint the geographic origin of hexaploid wheat. New phytologist 198: 925–937 doi:10.1111/nph.12164PMID:23374069
50. Quarrie S, Steed A, Calestani C, Semikhodskii A, Lebreton C, et al. (2005) A high-density genetic map of hexaploid wheat (Triticum aestivumL.) from the cross Chinese Spring× SQ1 and its use to compare QTLs for grain yield across a range of environments. Theor Appl Genet 110:865–880 PMID:15719212
51. Li S, Jia J, Wei X, Zhang X, Li L, et al. (2007) A intervarietal genetic map and QTL analysis for yield traits in wheat. Molecular Breeding 20:167–178
52. Patil R, Tamhankar S, Oak M, Raut A, Honrao B, et al. (2013) Mapping of QTL for agronomic traits and kernel characters in durum wheat (Triticum durumDesf.). Euphytica 190:117–129
53. Paux E, Sourdille P, Mackay I, Feuillet C (2012) Sequence-based marker development in wheat: ad-vances and applications to breeding. Biotechnology Adad-vances 30:1071–1088 doi:10.1016/j. biotechadv.2011.09.015PMID:21989506
54. Song XJ, Huang W, Shi M, Zhu MZ, Lin HX (2007) A QTL for rice kernel width and weight encodes a previously unknown RING-type E3 ubiquitin ligase. Nat Genet 39:623–630 PMID:17417637
55. Wu X, Chang X, Jing R (2012) Genetic insight into yield-associated traits of wheat grown in multiple rain-fed environments. PloS ONE 7:e31249 doi:10.1371/journal.pone.0031249PMID:22363596
56. Mir R, Kumar N, Jaiswal V, Girdharwal N, Prasad M, et al. (2012) Genetic dissection of grain weight in bread wheat through quantitative trait locus interval and association mapping. Molecular Breeding 29:963–972
57. Cui F, Zhao C, Li J, Ding A, Li X, et al. (2013) Kernel weight per spike: what contributes to it at the indi-vidual QTL level? Molecular Breeding 31:265–278
58. Peng J, Ronin Y, Fahima T, Röder MS, Li Y, et al. (2003) Domestication quantitative trait loci inTriticum dicoccoides, the progenitor of wheat. Proceedings of the National Academy of Sciences USA 100:2489–2494 PMID:12604784