The Identification of Specific Methylation
Patterns across Different Cancers
Chunlong Zhang1☯, Hongyan Zhao2☯, Jie Li1, Hongbo Liu1, Fang Wang1, Yanjun Wei1, Jianzhong Su1, Dongwei Zhang3, Tiefu Liu2*, Yan Zhang1*
1College of Bioinformatics Science and Technology, Harbin Medical University, Harbin, China,2
Department of Gastroenterology, The fourth Affiliated Hospital of Harbin Medical University, Harbin, China,3 Department of General Surgery, The Second Affiliated Hospital of Harbin Medical University, Harbin, China
☯These authors contributed equally to this work.
*[email protected](YZ);[email protected](TL)
Abstract
Abnormal DNA methylation is known as playing an important role in the tumorgenesis. It is helpful for distinguishing the specificity of diagnosis and therapeutic targets for cancers based on characteristics of DNA methylation patterns across cancers. High throughput DNA methylation analysis provides the possibility to comprehensively filter the epigenetics diversity across various cancers. We integrated whole-genome methylation data detected in 798 samples from seven cancers. The hierarchical clustering revealed the existence of cancer-specific methylation pattern. Then we identified 331 differentially methylated genes across these cancers, most of which (266) were specifically differential methylation in unique cancer. A DNA methylation correlation network (DMCN) was built based on the methylation correlation between these genes. It was shown the hubs in the DMCN were in-clined to cancer-specific genes in seven cancers. Further survival analysis using the part of genes in the DMCN revealed high-risk group and low-risk group were distinguished by seven biomarkers (PCDHB15, WBSCR17, IGF1, GYPC, CYGB, ACTG2, andPRRT1) in breast cancer and eight biomarkers (ZBTB32, OR51B4, CCL8, TMEFF2, SALL3, GPSM1, MAGEA8, andSALL1) in colon cancer, respectively. At last, a protein-protein interaction network was introduced to verify the biological function of differentially methylated genes. It was shown thatMAP3K14, PTN, ACVR1andHCKsharing different DNA methylation and gene expression across cancers were relatively high degree distribution in PPI network. The study suggested that not only the identified cancer-specific genes provided reference for individual treatment but also the relationship across cancers could be explained by differ-ential DNA methylation.
Background
Epigenetics is referred to a heritable mechanism that affects the gene expression which is un-changed in DNA sequence [1]. DNA methylation is one of the most important epigenetic events in mammals, and mainly refers to the covalent addition of a methyl group (CH3) on the OPEN ACCESS
Citation:Zhang C, Zhao H, Li J, Liu H, Wang F, Wei Y, et al. (2015) The Identification of Specific Methylation Patterns across Different Cancers. PLoS ONE 10(3): e0120361. doi:10.1371/journal. pone.0120361
Academic Editor:Hiromu Suzuki, Sapporo Medical University, JAPAN
Received:October 2, 2014
Accepted:January 20, 2015
Published:March 16, 2015
Copyright:© 2015 Zhang et al. This is an open access article distributed under the terms of the
Creative Commons Attribution License, which permits unrestricted use, distribution, and reproduction in any medium, provided the original author and source are credited.
Data Availability Statement:All relevant data are within the paper and its Supporting Information files.
Funding:Support was provided by the National Natural Science Foundation of China [no. 31371334, 61203262, 61403112, 61402139]. The funders had no role in study design, data collection and analysis, decision to publish, or preparation of the manuscript.
5’position of cytosine. A CpG-rich region is called a CpG island which always overlaps on gene promoters and associates with negative regulation of the gene expression [2,3]. It has been revealed that CpG methylation plays an important role in biological processes including im-printing, retrotransposon silencing, X chromatin inactivation, DNA duplication, transcription, repair, even development of cancers and many other complex diseases[4]. Recent researches demonstrate that the methylation mechanism has strong effects within the cancer genes [5,6]. Therefore further understanding of the CpG methylation on complex diseases will be helpful to disease diagnosis, treatment and prognosis. To date, there are an increasing number of stud-ies mainly focusing on mechanism of epigenetic processes, especially CpG methylation [7].
Cancers have been regarded as complex diseases [8]. There are many factors involved in cancers such as copy number alteration, differential expression, epigenetic aberration and so on, among which abnormal DNA methylation has been discovered in many cancers, including breast cancer, lung cancer and colorectal cancer. Hypermethylation in promoter regions inhib-its the expression of tumor suppressor genes. On the other hand, hypomethylation in promoter regions activates the oncogene expression. Global hypomethylation also plays an important feature in the process of carcinogenesis, increasing genomic and chromosomal instability [9,10]. For example, many reports have demonstrated that breast cancer is the most widespread cancer in women around the world and has more than six significant subtypes described by gene expression.BRCA1/2are the most cancer-related genes in breast cancer, they involve in DNA repair, regulation of transcriptional activation and apoptosis. The hypermethylation of
BRCA1/2in promoter regions results in the inactivation of function and increases the risk of breast cancer [11,12]. Similarly, the hypermethylation ofAOX1(aldehyde oxidase 1) and
GSTP1(Glutathione S-transferase 1) in prostate cancer also lead to the silence of gene expres-sion [13,14].LINE-1(long interspersed nucleotide element-1) is often regarded as a surrogate marker for global DNA methylation and the overexpression ofLINE-1induced by hypomethy-lation in promoters results in a poor prognosis in non-small cell lung cancer [15].
A large number of cancer-related genes have been recognized and many significant genes are associated with more than one cancer.CDH1(E-cadherin), an intercellular adhesion mole-cule in epithelial cells plays an important role in establishing and maintaining intercellular con-nections. The hypermethylation ofCDH1in colorectal carcinogenesis reduces the gene expression and destroys the function of cell-cell adhesion system [16]. Moreover the hyper-methylation ofCDH1also disrupts the intercellular adhesion in gastric cancer, breast cancer and bladder cancer [17–19].RASSF1(RAS association domain family gene 1) also has high fre-quency of methylation in promoter regions and acts as a risk factor in prostate cancer and squamous cervical cancer [20–22]. Therefore, it is necessary to develop an integrated analysis across tumors to discover similarities of different cancers and tumor-specific characteristics.
Materials and Methods
DNA methylation and expression data
DNA methylation data was obtained from the Cancer Genome Atlas (TCGA). The samples consisted of 832 cancer samples and 284 normal samples collected from matched adjacent nor-mal tissues, including breast invasive carcinoma (BRCA), colon adenocarcinoma (COAD), kid-ney renal clear cell carcinoma (KIRC), kidkid-ney renal papillary cell carcinoma (KIRP), lung adenocarcinoma (LUAD), lung squamous cell carcinoma (LUSC), rectum adenocarcinoma (READ) and their matched samples as normal ones. The data was detected by the Infinium HumanMethylation27 BeadChip containing of 27,578 CpG sites in 14,475 genes. The data was from level 2 andβvalue was defined as DNA methylation level which was calculated as radio of methylated probe (M/ (U+M)) ranging from 0 to 1.
The probes with detection“NA”were treated as missing data. Samples with more than 150 missing probes were treated as missing data and 66 samples were deleted. Next, the sites with missing data were deleted. Coefficient of variation (CV) was used to assess the discrete degree of all data. The genes with CV less than 0.5 in more than 80% samples were remained. CV = SD/AVE. CV was the coefficient of variation of sites belonging the same gene in one sample, SD was the variance of sites, AVE was the average of sites. Average methylation level of multi-ple CpGs on the same gene was defined as the methylation level of gene.
The expression data was obtained from 210 cancer samples and 68 normal samples (includ-ing matched and normal samples) in TCGA. COAD and READ were detected by the platform AgilentG4502A including 17,814 genes. BRCA, KIRC, KIRP, LUAD and LUSC were detected by the platform illminaHiseq_RNASeqV2 including 20,531 genes. The sample information of both DNA methylation data and expression data were listed inS1 Table.
Identification of differential genes
In this study, we used the R library package“samr”based on t-test statistical significance to identify the differentially methylated genes (DMGs). DMG was defined as significance level false discovery rate (FDR) less than 0.05 and difference of DNA methylation level more than 0.15 between cancers and normal samples [24]. The version of package tool we used was 4.0. In order to understand the mechanism of DNA methylation in cancers, we also used samr to identify the differentially expressed genes (DEGs) with significance level false discovery rate (FDR) less than 0.05.
Construction of DNA methylation correlation network
The intersection of DMGs and DEGs were used as the nodes in constructing DNA methylation correlation network. Then we calculated the correlation coefficients by the methylation levels of differential genes as the edges, the absolute value of Pearson coefficient correlation was no less than 0.7 with significance level p-value less than 0.05[25].
Survival analysis of differentially methylated genes
The survival analysis was performed based on the prognostic index (PI) to generate the risk groups.
PI¼b1x1þb2x2þ. . . .þbpxp
where xpwas the expression of biomarker genes andβpwas calculated through the COX
regres-sion. With the PI increased, the patients would have a poor prognosis. We used the PI to sepa-rate the samples into two groups with the same samples to test whether the biomarkers were associated with the survival stage.
Construction of protein-protein interaction network
We chose an integrated PPI network as background, which was integrated from the Biomolec-ular Interaction Network Database (BIND), the Biological General Repository for Interaction Data sets (BioGRID), the Database of Interacting Proteins (DIP), the Human Protein Reference Database (HPRD), IntAct, the Molecular IN Teraction database (MINT), the mammalian PPI database of the Munich Information Center on Protein Sequences (MIPS), PDZBase (a PPI da-tabase for PDZ-domains) and Reactome. The constructed seed gene set were SIN_D, DOU_D and TRI_D identified above. They were mapped into integrated PPI network and a sub-net-work was extracted. The sub-netsub-net-work was composed of the seed genes and the genes connect-ing with seed genes in integrated PPI network. The degree of node in sub-network was defined as the number of genes which were connected with seed genes. It could be used to predict the importance of identified cancer-related DMGs.
Results
Differential methylation patterns across cancers
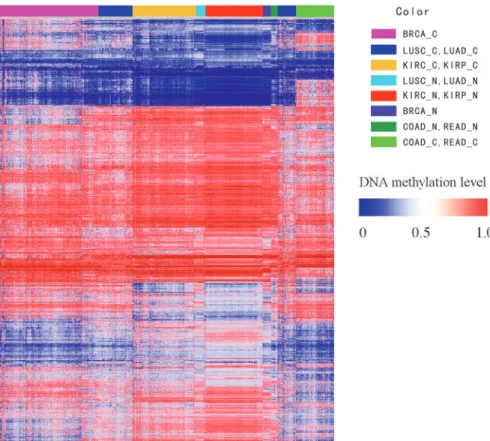
Seven cancer data from TCGA were used in this study, including their DNA methylation pro-file and gene expression propro-file. After data preprocessing (seematerials and methods), 832 can-cer samples and 284 normal samples of the seven cancan-cers were remained (Table 1). For the further identification of DMGs, we maintained 7,936 genes whose DNA methylation value ex-isted in all cancers (S2 Table). The DMGs for seven cancers were identified respectively through samr. There were 509 genes showing differential methylation in BRCA, 591 genes in COAD, 130 genes in KIRC, 67 genes in KIRP, 53 genes in LUAD, 508 genes in LUSC and 701 genes in READ (S3 Table). The union of the DMGs was 1,318 (S4 Table). The distribution of methylation patterns of DMGs among cancers were observed based on bidirectional hierarchi-cal clustering analysis (Fig. 1). Samples were clustered into clades based on the specific types of
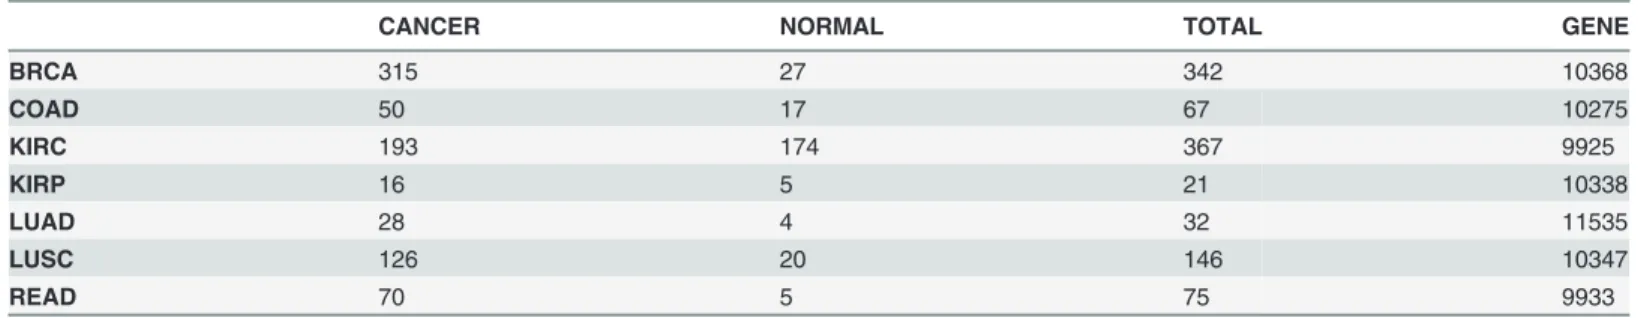
Table 1. The number of samples for the identification of DNA methylation patterns and differentially methylated genes.
CANCER NORMAL TOTAL GENE
BRCA 315 27 342 10368
COAD 50 17 67 10275
KIRC 193 174 367 9925
KIRP 16 5 21 10338
LUAD 28 4 32 11535
LUSC 126 20 146 10347
READ 70 5 75 9933
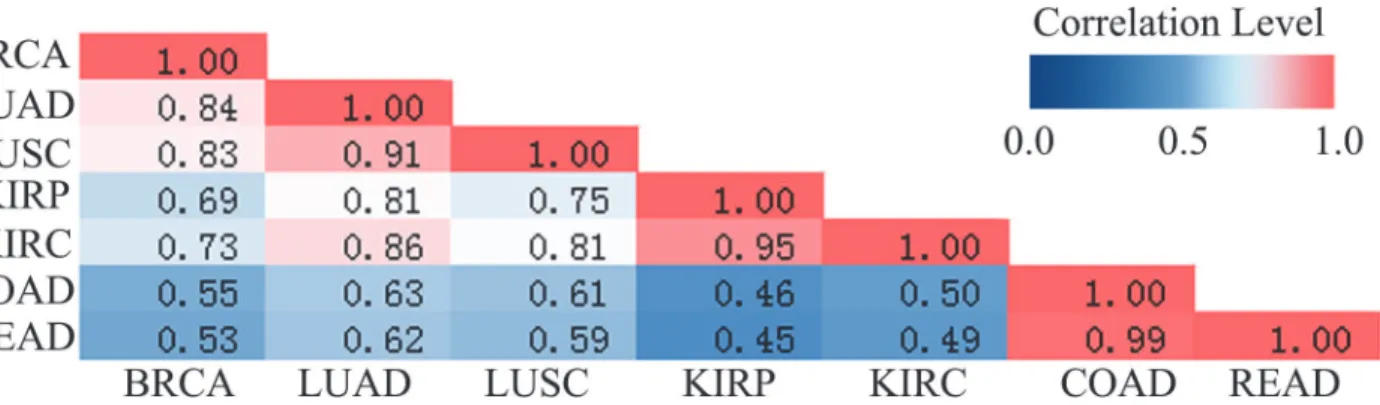
biological samples. The COAD and READ were clustered together which showed similar meth-ylation patterns between these two cancers. Most of DMGs showed high methmeth-ylation level in COAD and READ compared to other five cancer samples and normal samples, and about 11% in the DMGs displayed specific hypermethylation in COAD and READ respectively. The result was supported that the tumors seemed to be hypermethylated more frequently and there were no significant differences which could distinguish colon and rectum cancers at methylation level [26]. The similar results were also showed in LUAD and LUSC, KIRP and KIRC. To testi-fy the observed results, we calculated the correlation coefficients that displayed the same conse-quence as hierarchical clustering analysis (Fig. 2). Interestingly, BRCA was high correlated with LUAD and LUSC. They might be caused by the radiotherapy of breast cancer which in-creased the mortality rate of lung cancers [27]. Moreover, normal samples of above-mentioned cancers also showed similar methylation patterns. On the other hands, cancers from different original organizations had the differential DNA methylation levels (Fig. 1). It was suggested that DNA methylation patterns were associated with tissue and cancer types.
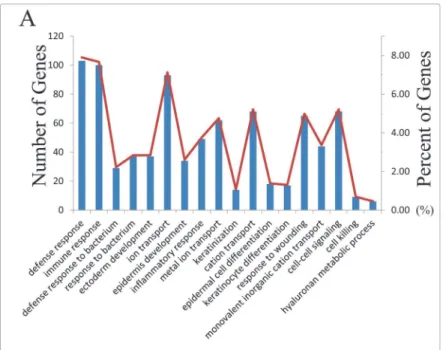
Moreover, function enrichment analysis of these 1,318 DMGs was carried using DAVID (http://david.abcc.ncifcrf.gov/) (S5 Table). These genes were mainly enriched in defense re-sponse, immune rere-sponse, cell-cell signaling, cell adhesion, cell killing and so on. Cancer was regarded as a malignant disease and related to defense system, immune response and many other biological processes which involved in unregulated cell growth[28]. Apoptosis was a basic biological process that might have an important relationship with many diseases, such as cancers and autoimmune diseases. Apoptosis was regulated in tumors negatively and the Fig 1. The bidirectional hierarchical clustering of cancer samples of seven phenotypesThe letter C represented cancer, and N represented normal. Red was hypermethylation, white is midmethylation and blue was hypomethylation. The samples coming from the same or similar tissues were clustering together, the result of cluster was labeling on the top of the figure.
abnormality of apoptosis was involved in cancers [29]. These biological processes might be de-regulated by the abnormal methylation of the differential genes, thus affecting the process of cancers. In addition, these genes were associated with many cancer-related pathways (Fig. 3).
Differentially expressed genes negatively regulated by DNA methylation
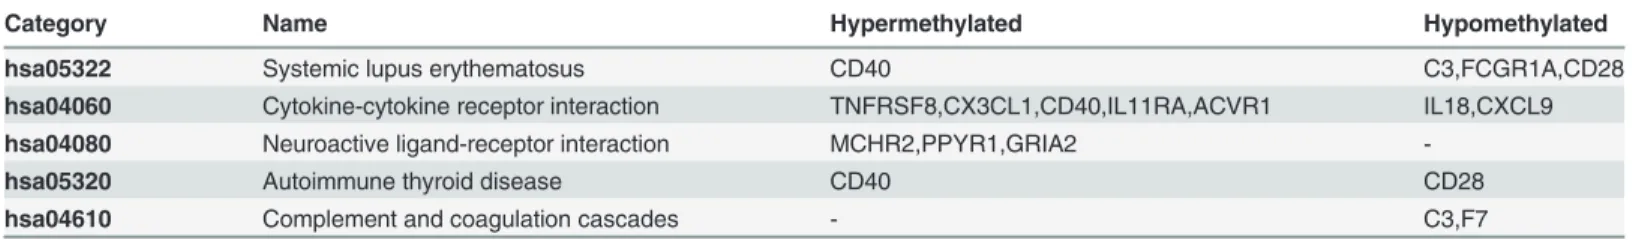
DNA methylation in promoter regions had an important function of housekeeping genes. A number of studies indicated that gene expression was regulated negatively by DNA methyla-tion status [30]. In this study, 201 genes of 1,318 DMGs sharing negative relationship between DMGs and DEGs were distinguished. They were divided into 127 hypermethylated genes and 74 hypomethylated genes based on the difference value between cancer samples and normal samples. In further investigation of the function for the negatively related genes, the hyper-methylated genes were mainly enriched in cancer-related pathways, including Systemic lupus erythematosus(CD40), Cytokine-cytokine receptor interaction(TNFRSF8, CX3CL1, CD40, IL11RA, ACVR1), Neuroactive ligand-receptor interaction(MCHR2, PPYR1, GRIA2) and auto-immune thyroid disease(CD40). Specially,CD40was existed in three pathways. CD40 could generate different growth signals between normal tissues and tumors. It was demonstrated to be a tumor suppressor gene and to be hypermethylated in breast cancer (Table 2) [31]. There-fore the methylation ofCD40supported the evidence for prediction of breast cancer and made an important contribution to the treatment of breast cancer. However hypomethylated genes did not show the clear association with cancer-related pathways. The results suggested that these hypermethylated genes in cancer were cancer-related genes and could be regarded as the candidate biomarkers for the prognosis of cancers.
Differential DNA methylation gene correlation network
In order to investigate the relationship across cancers with DNA methylation medium, we quantified the correlation of DMGs based on their methylation patterns across cancers. A dif-ferential DNA methylation correlation network (DMCN) was constructed according to the Pearson correlation coefficients of methylation levels, which was an undirected graph display-ing the complex relationship of a great deal of genes and seven cancers. DMCN consisted of 5,492 edges and 331 nodes respectively (Fig. 4A). The intersection between DEGs and DMGs were used as nodes, meanwhile edges were weighted by methylation correlation coefficients be-tween DMGs.
Fig 2. The correlation of seven cancersThe pink stood for high correlation coefficient, yellow stood for middle correlation coefficient and green stood for low correlation coefficient. BRCA, LUSC and READ had the strong correlation. Besides this KIRC and KIRP, COAD and READ also had the similar result separately.
We analyzed DMCN to demonstrate the reliability of our network by two topological struc-tures separately, including clustering coefficient and average of degree. First, we perturbed the data in every genes and calculated the correlation coefficients (p<= 0.01) and averages of
de-gree (1000 times). Then we compared clustering coefficients (0.54) and average of dede-gree (33.18) in DMCN to the random networks (Fig. 4B C). The result showed that our network was more correlated and significant than random networks. Moreover, hub genes were a class of genes with high degree and played an important role as key regulatory features in disease network. The degree was from 1 to 127 and the genes with top 10 degrees were defined as hubs Fig 3. The function enrichment graph of differentially methylated genesThe Y axis in the left and the blue histogram stood for the numbers of annotated in KEGG and BP, the Y axis in the right and red curve stood for the percent of annotated genes in BP and KEGG.
(Fig. 4D). The hub genes included ADCYAP1, ZNF454, ZBTB32, SST, PCDHB15, WBSCR17, OR51B4, CCL8, CRISPLD2, NALCN, IGF1, TMEFF2, HYLS1 and GYPC. From the result, we found that the significant genes were mainly distributed in BRCA and COAD, which was dis-played strong correlation between the two cancers [32].
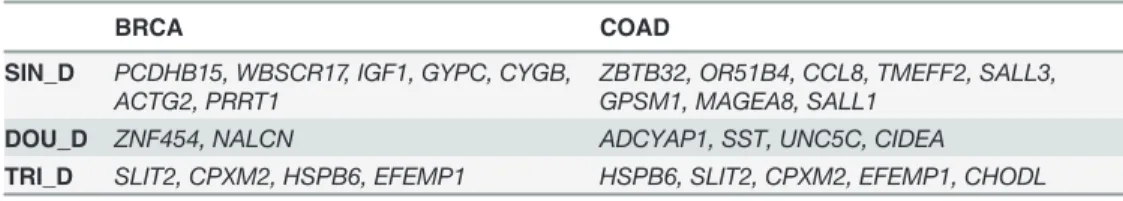
As shown inFig. 4A, seven colors were used to distinguish the nodes which cancers they be-longed to. There were 72 genes showing specific methylation in BRCA, 81 in COAD, 36 in KIRC, 7 in KIRP, 3 in LUAD, 48 in LUSC and 19 in READ in the network. The nodes in net-work were mainly classified into three categories including triple differential (TRI_D, 5 genes), double differential (DOU_D, 60 genes) and single differential (SIN_D, 266 genes). For exam-ple,SLIT2of TRI_D was abnormal in BRCA, COAD and READ, which showed negative Table 2. The KEGG pathway of the DEGs regulated by DNA methylation.
Category Name Hypermethylated Hypomethylated
hsa05322 Systemic lupus erythematosus CD40 C3,FCGR1A,CD28
hsa04060 Cytokine-cytokine receptor interaction TNFRSF8,CX3CL1,CD40,IL11RA,ACVR1 IL18,CXCL9 hsa04080 Neuroactive ligand-receptor interaction MCHR2,PPYR1,GRIA2
-hsa05320 Autoimmune thyroid disease CD40 CD28
hsa04610 Complement and coagulation cascades - C3,F7
doi:10.1371/journal.pone.0120361.t002
Fig 4. The DMCN of differentially methylated genes.(A) The color stood for different cancers. The size of the nodes stood for the degree of the genes. The line stood for the correlation between two genes. (B) Distribution of clustering coefficient. Y axis was the distribution of random networks; x axis was the clustering coefficient. The star was the value we calculated (C) Distribution of degree. (D) Hub genes and degrees. Blue bar stood for which cancers the differential genes located in.
relationship between DNA methylation and gene expression.SLIT2was usually regarded as a tumor suppressor gene and silenced both in colorectal cancer and breast cancer, whose silence was caused by the hypermethylation of its promoter regions and allelic loss [33,34]. Gene
EFEMP1as a member of fibulin family also was abnormal in BRCA, COAD and READ. This gene was related to the angiogenesis and was described as key element of cancer progression. The down-regulation of it was due to the hypermethylation of promoter. Moreover, the de-creased expression ofEFEMP1seemed to strongly correlate with poor disease-free and overall survival [35,36]. In addition, althoughCHODLwas not shown function in previous studies, we found the gene was also aberrant of DNA methylation level in BRCA, COAD and READ and displayed negative regulation between DNA methylation and gene expression. It was suggested that there was a strong relationship among BRCA, CORD and READ. In DOU_D set, there were 31 genes which were differential in COAD and READ. This phenomenon implied the cor-relation between COAD and READ, which was consistent with the result of hierarchical clus-tering. About 80% genes were part of SIN_D, displaying widely specific among cancers. Particularly, many cancer-related genes includingCDH5, BVES, CX3CL1, FGFR1, IGF1and
CD40were identified in SIN_D. The result suggested that the genes we identified had high as-sociation with cancers and played an important role in biological process and in development of cancers.
Survival analysis for cancer specific genes
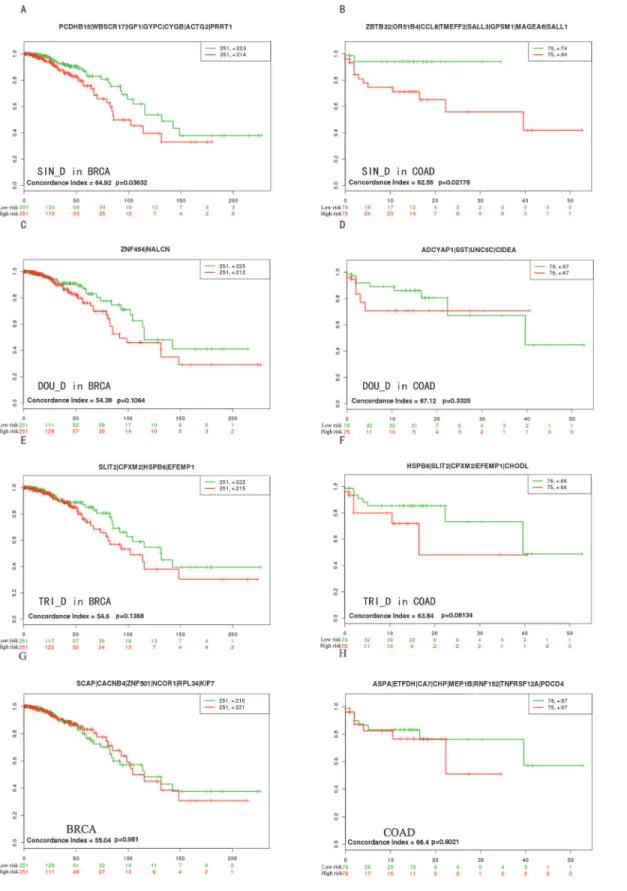
Survival analysis of BRCA and COAD were performed to evaluate the potential roles of candi-date biomarkers including all TRI_D genes, the top 10 with high degrees of SIN_D and DOU_D genes, respectively (Table 3). We selected 502 samples of BRCA and 151 samples of COAD which were downloaded from TCGA for the survival analysis. Samples were divided into two groups through the median of PI (prognostic index, high values stood for high risk and low values stood for low risks) and used median risk score as the cutoff. We found SIN_D could separate high-risk group and low-risk group more significantly than DOU_D or TRI_D (Fig. 5). Furthermore the patients with high scores had the shorter survival time. In addition, we used seven genes in BRCA and eight genes in COAD which were differentially expressed but not differentially methylated respectively, to perform the survival analysis as controls. The results of SIN_D in BRCA (p = 0.036) and COAD (p = 0.022) were more significant than their control results (p = 0.981 in BRCA and p = 0.602 in COAD) (Fig. 5 G, H). This result suggested that the combination between DNA methylation and expression could make a better contribu-tion to prognosis than expression only.
Differentially methylated genes in protein-protein interaction network
Protein-protein interaction networks could be more accurate to describe the relationships be-tween complex elements and more visible to display the constructions of these elements. In order to explore significance of DMGs which were related with cancers, PPI sub-network was
Table 3. The genes for the survival analysis.
BRCA COAD
SIN_D PCDHB15, WBSCR17, IGF1, GYPC, CYGB, ACTG2, PRRT1
ZBTB32, OR51B4, CCL8, TMEFF2, SALL3, GPSM1, MAGEA8, SALL1
DOU_D ZNF454, NALCN ADCYAP1, SST, UNC5C, CIDEA
TRI_D SLIT2, CPXM2, HSPB6, EFEMP1 HSPB6, SLIT2, CPXM2, EFEMP1, CHODL
Fig 5. The survival analysis of candidate biomarkers.The“+”stood for the censoring samples. The X axis and Y axis respectively stood for observation time (months) and percent of survival people. Red and Green curves were high-risk group and low-risk group. The biomarkers were on the top of every picture. Concordance Index (CI) and p-value were in the bottom-left insets.
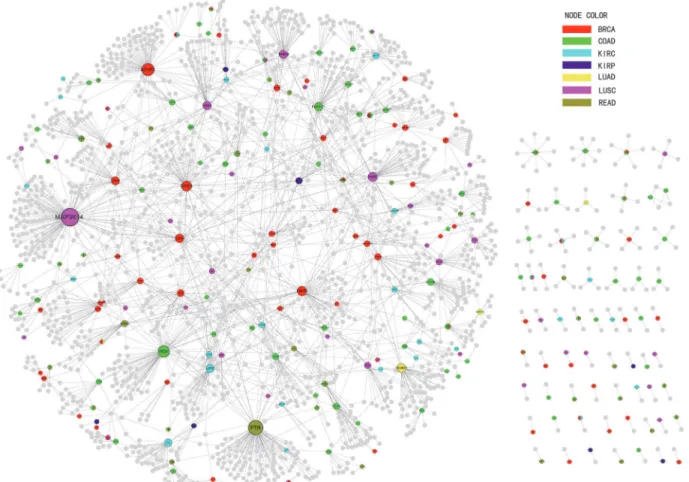
built by published PPI network. There were a lot of databases storing the interactions of genes, including the Biomolecular Interaction Network Database (BIND), the Biological General Re-pository for Interaction Data sets (BioGRID), the Database of Interacting Proteins (DIP), the Human Protein Reference Database (HPRD), IntAct, the Molecular IN Teraction database (MINT), the mammalian PPI database of the Munich Information Center on Protein Se-quences (MIPS), PDZBase (a PPI database for PDZ-domains) and Reactome[37–45]. Because many experimental factors might influence the result of PPI network, which led to the repeat-able interactions in PPI network, we integrated a high-confidence PPI network based on the above-mentioned databases as our background network [46]. The network we built was com-posed of 80,980 edges and 13,361 nodes. Therefore we mapped SIN_Ds, DOU_Ds and TRI_Ds as seed genes into the PPI network. The interactions including seed genes were retrieved corre-sponding to 2,272 edges and 1,892 nodes as a sub-network (Fig. 6). According to the sub-net-work, there were four genes as hubs ranking in the top 10 degrees, includingMAP3K14, PTN, ACVR1, andHCK, and they were all seed genes. The results suggested that DMGs might play an important role in carcinogenesis. For example,MAP3K14(Mitogen-activated protein kinase kinase kinase 14) hypermethylated in LUSC regulated the NF-κB activity pathway and took part in a NF-κB-inducing signaling to receptors of the tumor-necrosis/nerve-growth factor (TNF/NGF) family [47]. In addition, based on the interaction between genes in the sub-net-work, we identified 127 genes which degrees were more than three as the novel cancer-related
Fig 6. Sub-PPI network of seed genes.The nodes stood for the gene and colors stood for the differential genes in cancers. The grey gene was the biomarkers we forecasted.
genes. The functional enrichment analysis of these 127 genes using DAVID showed that many cancer-associated biological processes and pathways were significant (S6 Table), such as“ regu-lation of programmed cell death”,“regulation of apoptosis”,“positive regulation of pro-grammed cell death”,“positive regulation of transcription”and so on. From the result we realized that the biological processes (BP) were focused on the regulation of apoptosis, pro-grammed cell death and regulation of transcription. On account of previous research, these bi-ological processes were related to the cancers [48,49]. Thus the genes predicted based on the PPI network and abnormal genes might be involved in processes of cancers as
potential biomarkers.
Moreover, some researches showed that many pathways associated with cancers from KEGG were significant [50,51]. Our analysis showed that the potential biomarkers obtained in this study were enriched in 11 cancer related pathways, and the most significant pathway was
“pathways in cancer (hsa05200)”in which there were 33 genes annotated (FDR = 2.44E-15). This pathway included lots of pathways which were related to cancers such as Wnt signaling pathway, mapk signaling pathway, vega signaling pathway and so on[52,53]. Besides, our bio-markers also were annotated in many other cancer-related pathways, for example,“ErbB sig-naling pathway”,“Chemokine signaling pathway”,“Natural killer cell mediated cytotoxicity”
and“Focal adhesion”[54–56]. The result of annotation indicated that the potential biomarkers participated in many progresses of cancers, and acted as an important role in cancers.
Discussion
Aberrant DNA methylation on gene promoter regions are usually associated with cancers. For example, aberrant DNA methylation ofSIRT1is frequently observed in different cancers and played an important role in carcinogenesis [57]. Epigenetic inactivation ofST6GAL1is indicat-ed a tumor suppressive role in bladder carcinogenesis[58]. In addition,ST6GAL1is also associ-ated with breast cancer. According to the examples above, the features of DNA methylation are reflected cancer-specific and cancer-sharing. It is likely that multiple cancers are placed of ori-gin from the same tissues, resulting in the same DNA methylation patterns. For example, there is a study showing that colon and rectal cancers are difficult to distinguish by DNA methyla-tion level [26]. Therefore, it is useful to analyze the relationship among different cancers through integrating DNA methylation from genome-wide.
In this study, the result of hierarchical clustering and Pearson correlation demonstrated that the DNA methylation level of different cancers were influenced by the anatomical origins, moreover the DNA methylation level had stable DNA methylation signatures in same cancers, which is coincident with previous studies[26]. And the DMGs were mainly enriched in defense response, immune response, cell-cell signaling, cell adhesion and cell killing and other cancer-related KEGG pathways by function annotation analysis, suggesting that the damage of these biological processes activate the proliferation of cancer cells and inhibit protection of individu-als [59–64]. Additionally, the hypermethylated genes were mainly enriched in multiple cancer-related KEGG pathways compared to hypomethylated genes, and this finding supported previ-ous study of the focal hypermethylation in tumorigenicity[65].
The result further demonstrated the potential roles of hub genes in DMCN and the importance of integrated analysis between DNA methylation and gene expression.
Additionally, the result in PPI network indicated the accuracy of our prediction and the po-tential roles of the novel cancer-related genes in cancers. The result demonstrated that our DMGs could not only predict novel biomarkers accurately but also influence the process of cancers.
Finally we used DMCN, survival analysis, PPI network and many other methods to assess the importance of DMGs for the cancers. The analysis among different cancers showed the po-tential role of DMGs in the research of cancers. However, more and more high throughput data have been obtained such as Reduced Representation Bisulfite Sequencing (RRBS), Bisulfite Sequencing (BS-seq) and Infinium HumanMethylation450, and our data are on a small scale [67–69]. Therefore, our study will make a contribution to the further understanding of devel-opment and progression in cancers through the high throughput data and more and more studies are needed for the integrated analysis of different cancers and improve the prediction of biomarkers in cancers.
Supporting Information
S1 Table. The information of DNA methylation and expression data.
(XLS)
S2 Table. The list of genes existing in seven cancers.
(XLS)
S3 Table. The list of differentially methylated genes.
(XLS)
S4 Table. The list of genes for bidirectional hierarchical clustering analysis.
(XLS)
S5 Table. The result of differentially methylated genes for DAVID.
(XLS)
S6 Table. The result of biomarker genes in PPI network for DAVID.
(XLS)
Acknowledgments
We thank the support of our laboratory.
Author Contributions
Conceived and designed the experiments: YZ. Performed the experiments: CZ HL JS TL. Ana-lyzed the data: CZ YZ JL. Contributed reagents/materials/analysis tools: HZ FW YW. Wrote the paper: DZ CZ.
References
1. Sutherland JE, Costa M. Epigenetics and the environment. Ann N Y Acad Sci. 2003; 983: 151–160. PMID:12724220
3. Varley KE, Gertz J, Bowling KM, Parker SL, Reddy TE, Pauli-Behn F, et al. Dynamic DNA methylation across diverse human cell lines and tissues. Genome Res. 2013; 23: 555–567. doi:10.1101/gr. 147942.112PMID:23325432
4. Choo KB. Epigenetics in disease and cancer. Malays J Pathol. 2011; 33: 61–70. PMID:22299205 5. Deng J, Liang H, Zhang R, Ying G, Xie X, Yu J, et al. Methylated CpG site count of dapper homolog 1
(DACT1) promoter prediction the poor survival of gastric cancer. Am J Cancer Res. 2014; 4: 518–527. PMID:25232493
6. Nakamura J, Tanaka T, Kitajima Y, Noshiro H, Miyazaki K. Methylation-mediated gene silencing as bio-markers of gastric cancer: A review. World J Gastroenterol. 2014; 20: 11991–12006. doi:10.3748/wjg. v20.i34.11991PMID:25232236
7. Gokul G, Khosla S. DNA methylation and cancer. Subcell Biochem. 2013; 61: 597–625. doi:10.1007/ 978-94-007-4525-4_26PMID:23150269
8. Kang C, Song JJ, Lee J, Kim MY. Epigenetics: an emerging player in gastric cancer. World J Gastroen-terol. 2014; 20: 6433–6447. doi:10.3748/wjg.v20.i21.6433PMID:24914365
9. Davis CD, Uthus EO. DNA methylation, cancer susceptibility, and nutrient interactions. Exp Biol Med (Maywood). 2004; 229: 988–995. PMID:15522834
10. Kawano H, Saeki H, Kitao H, Tsuda Y, Otsu H, Ando K, et al. Chromosomal Instability Associated with Global DNA Hypomethylation is Associated with the Initiation and Progression of Esophageal Squa-mous Cell Carcinoma. Ann Surg Oncol 21 Suppl: . 2014; 4: 696–702.
11. The Cancer Genome Atlas Network. Comprehensive molecular portraits of human breast tumours. Na-ture. 2012; 490: 61–70. doi:10.1038/nature11412PMID:23000897
12. van den Broek AJ, de Ruiter K, van 't Veer LJ, Tollenaar RA, van Leeuwen FE, Verhoef S, et al. Evalua-tion of the Dutch BRCA1/2 clinical genetic center referral criteria in an unselected early breast cancer population. Eur J Hum Genet. 2014.
13. Mahon KL, Qu W, Devaney J, Paul C, Castillo L, Wykes RJ, et al. Methylated Glutathione S-transferase 1 (mGSTP1) is a potential plasma free DNA epigenetic marker of prognosis and response to chemo-therapy in castrate-resistant prostate cancer. Br J Cancer. 2014.
14. Varisli L. Identification of new genes downregulated in prostate cancer and investigation of their effects on prognosis. Genet Test Mol Biomarkers. 2013; 17: 562–566. doi:10.1089/gtmb.2012.0524PMID: 23621580
15. Barchitta M, Quattrocchi A, Maugeri A, Vinciguerra M, Agodi A. LINE-1 hypomethylation in blood and tissue samples as an epigenetic marker for cancer risk: a systematic review and meta-analysis. PLoS One. 2014; 9: e109478. doi:10.1371/journal.pone.0109478PMID:25275447
16. Li YX, Lu Y, Li CY, Yuan P, Lin SS.Role of CDH1 promoter methylation in colorectal carcinogenesis: a meta-analysis. DNA Cell Biol. 2014; 33: 455–462. doi:10.1089/dna.2013.2291PMID:24684676 17. Oh JH, Rhyu MG, Jung SH, Choi SW, Kim SI, Hong SJ. Slow overmethylation of housekeeping genes
in the body mucosa is associated with the risk for gastric cancer. Cancer Prev Res (Phila). 2014; 7: 585–595. doi:10.1158/1940-6207.CAPR-13-0320PMID:24654229
18. Asiaf A, Ahmad ST, Aziz SA, Malik AA, Rasool Z, Masood A, et al. Loss of Expression and Aberrant Methylation of the CDH1 (E-cadherin) Gene in Breast Cancer Patients from Kashmir. Asian Pac J Can-cer Prev. 2014; 15: 6397–6403. PMID:25124632
19. Li G, Liu Y, Yin H, Zhang X, Mo X, Tang J, et al. E-cadherin gene promoter hypermethylation may con-tribute to the risk of bladder cancer among Asian populations. Gene. 2013.
20. Litovkin K, Joniau S, Lerut E, Laenen A, Gevaert O, Spahn M, et al. Methylation of PITX2, HOXD3, RASSF1 and TDRD1 predicts biochemical recurrence in high-risk prostate cancer. J Cancer Res Clin Oncol. 2014.
21. Daniunaite K, Jarmalaite S, Kalinauskaite N, Petroska D, Laurinavicius A, Lazutka JR, et al. Prognostic value of RASSF1 promoter methylation in prostate cancer. J Urol. 2014.
22. Guerrero-Setas D, Perez-Janices N, Blanco-Fernandez L, Ojer A, Cambra K, Berdasco M, et al. RASSF2 hypermethylation is present and related to shorter survival in squamous cervical cancer. Mod Pathol. 2013; 26: 1111–1122. doi:10.1038/modpathol.2013.32PMID:23542458
23. Liu Z, Zhang S. Toward a systematic understanding of cancers: a survey of the pan-cancer study. Front Genet. 2014; 5: 194. doi:10.3389/fgene.2014.00194PMID:25071824
24. Tusher VG, Tibshirani R, Chu G. Significance analysis of microarrays applied to the ionizing radiation response. Proc Natl Acad Sci U S A. 2001; 98: 5116–5121. PMID:11309499
26. Cancer Genome Atlas Network. Comprehensive molecular characterization of human colon and rectal cancer. Nature. 2012; 487: 330–337. doi:10.1038/nature11252PMID:22810696
27. Correa CR, Darby SC. Cardiac disease and second lung cancer after radiotherapy for breast cancer. Eur J Cancer 45. 2009; Suppl 1: 420–421. doi:10.1016/S0959-8049(09)70073-5PMID:19775655 28. de Visser KE, Eichten A, Coussens LM. Paradoxical roles of the immune system during cancer
devel-opment. Nat Rev Cancer. 2006; 6: 24–37. PMID:16397525
29. Pu H, Horbinski C, Hensley PJ, Matuszak EA, Atkinson T, Kyprianou N. PARP-1 Regulates Epithelial-Mesenchymal-Transition (EMT) in Prostate Tumorigenesis. Carcinogenesis. 2014.
30. Guardiola M, Oliva I, Guillaumet A, Martin-Trujillo A, Rosales R, Vallve JC, et al. Tissue-specific DNA methylation profiles regulate liver-specific expression of the APOA1/C3/A4/A5 cluster and can be ma-nipulated with demethylating agents on intestinal cells. Atherosclerosis. 2014; 237: 528–535. doi:10. 1016/j.atherosclerosis.2014.10.029PMID:25463085
31. Bediaga NG, Acha-Sagredo A, Guerra I, Viguri A, Albaina C, Ruiz Diaz I, et al. DNA methylation epigen-otypes in breast cancer molecular subtypes. Breast Cancer Res. 2010; 12: R77. doi:10.1186/bcr2721 PMID:20920229
32. Murray TI, Neugut AI, Garbowski GC, Waye JD, Forde KA, Treat MR. Relationship between breast can-cer and colorectal adenomatous polyps. A case-control study. Cancan-cer. 1992; 69: 2232–2234. PMID: 1562968
33. Prasad A, Paruchuri V, Preet A, Latif F, Ganju RK. Slit-2 induces a tumor-suppressive effect by regulat-ing beta-catenin in breast cancer cells. J Biol Chem. 2008; 283: 26624–26633. doi:10.1074/jbc. M800679200PMID:18611862
34. Dallol A, Morton D, Maher ER, Latif F. SLIT2 axon guidance molecule is frequently inactivated in colo-rectal cancer and suppresses growth of colocolo-rectal carcinoma cells. Cancer Res. 2003; 63: 1054–1058. PMID:12615722
35. Sadr-Nabavi A, Ramser J, Volkmann J, Naehrig J, Wiesmann F, Betz B, et al. Decreased expression of angiogenesis antagonist EFEMP1 in sporadic breast cancer is caused by aberrant promoter methyla-tion and points to an impact of EFEMP1 as molecular biomarker. Int J Cancer. 2009; 124: 1727–1735. doi:10.1002/ijc.24108PMID:19115204
36. Gallagher WM, Greene LM, Ryan MP, Sierra V, Berger A, Laurent-Puig P, et al. Human fibulin-4: analy-sis of its biosynthetic processing and mRNA expression in normal and tumour tissues. FEBS Lett. 2001; 489: 59–66. PMID:11231014
37. Isserlin R, El-Badrawi RA, Bader GD. The Biomolecular Interaction Network Database in PSI-MI 2.5. Database (Oxford). 2011; baq037.
38. Stark C, Breitkreutz BJ, Chatr-Aryamontri A, Boucher L, Oughtred R, Livstone MS, et al. The BioGRID Interaction Database: 2011 update. Nucleic Acids Res. 2011; 39: D698–704. doi:10.1093/nar/ gkq1116PMID:21071413
39. Salwinski L, Miller CS, Smith AJ, Pettit FK, Bowie JU, Eisenberg D. The Database of Interacting Pro-teins: 2004 update. Nucleic Acids Res. 2004; 32: D449–451. PMID:14681454
40. Peri S, Navarro JD, Amanchy R, Kristiansen TZ, Jonnalagadda CK, Surendranath V, et al. Develop-ment of human protein reference database as an initial platform for approaching systems biology in hu-mans. Genome Res. 2003; 13: 2363–2371. PMID:14525934
41. Aranda B, Achuthan P, Alam-Faruque Y, Armean I, Bridge A, Derow C, et al. The IntAct molecular inter-action database in 2010. Nucleic Acids Res. 2010; 38: D525–531. doi:10.1093/nar/gkp878PMID: 19850723
42. Licata L, Briganti L, Peluso D, Perfetto L, Iannuccelli M, Galeota E, et al. MINT, the molecular interaction database: 2012 update. Nucleic Acids Res. 2012; 40: D857–861. doi:10.1093/nar/gkr930PMID: 22096227
43. Pagel P, Kovac S, Oesterheld M, Brauner B, Dunger-Kaltenbach I, Frishman G, et al. The MIPS mam-malian protein-protein interaction database. Bioinformatics. 2005; 21: 832–834. PMID:15531608 44. Beuming T, Skrabanek L, Niv MY, Mukherjee P, Weinstein H. PDZBase: a protein-protein interaction
database for PDZ-domains. Bioinformatics. 2005; 21: 827–828. PMID:15513994
45. Vastrik I, D'Eustachio P, Schmidt E, Gopinath G, Croft D, de Bono B, et al. Reactome: a knowledge base of biologic pathways and processes. Genome Biol. 2007; 8: R39. PMID:17367534
46. Yu X, Wallqvist A, Reifman J. Inferring high-confidence human protein-protein interactions. BMC Bioin-formatics. 2012; 13: 79. doi:10.1186/1471-2105-13-79PMID:22558947
48. Wang W, Zhao J, Wang H, Sun Y, Peng Z, Zhou G, et al. Programmed cell death 4 (PDCD4) mediates the sensitivity of gastric cancer cells to TRAIL-induced apoptosis by down-regulation of FLIP expres-sion. Exp Cell Res. 2010; 316: 2456–2464. doi:10.1016/j.yexcr.2010.05.027PMID:20595005 49. Wang L, Zeng Y, Liu Y, Hu X, Li S, Wang Y, et al. Fucoxanthin induces growth arrest and apoptosis in
human bladder cancer T24 cells by up-regulation of p21 and down-regulation of mortalin. Acta Biochim Biophys Sin (Shanghai). 2014.
50. Soreide K, Janssen EA, Soiland H, Korner H, Baak JP. Microsatellite instability in colorectal cancer. Br J Surg. 2006; 93: 395–406. PMID:16555243
51. Anwar S, Hall C, White J, Deakin M, Farrell W, Elder JB. Hereditary non-polyposis colorectal cancer: an updated review. Eur J Surg Oncol. 2000; 26: 635–645. PMID:11078609
52. Abdel-Magid AF. Wnt/beta-Catenin Signaling Pathway Inhibitors: A Promising Cancer Therapy. ACS Med Chem Lett. 2014; 5: 956–957. doi:10.1021/ml500276aPMID:25264477
53. Vivanco I. Targeting molecular addictions in cancer. Br J Cancer. 2014.
54. Ghasemi R, Rapposelli IG, Capone E, Rossi C, Lattanzio R, Piantelli M, et al. Dual targeting of ErbB-2/ ErbB-3 results in enhanced antitumor activity in preclinical models of pancreatic cancer. Oncogenesis. 2014; 3: e117. doi:10.1038/oncsis.2014.31PMID:25133484
55. Miura D, Yoneyama K, Furuhata Y, Shimizu K. Paclitaxel Enhances Antibody-dependent Cell-mediated Cytotoxicity of Trastuzumab by Rapid Recruitment of Natural Killer Cells in HER2-positive Breast Can-cer. J Nippon Med Sch. 2014; 81: 211–220. PMID:25186575
56. Armendariz BG, Del Mar Masdeu M, Soriano E, Urena JM, Burgaya F. The diverse roles and multiple forms of focal adhesion kinase in brain. Eur J Neurosci. 2014.
57. Kiga K, Fukuda-Yuzawa Y, Tanabe M, Tsuji S, Sasakawa C, Fukao T. Comprehensive Silencing of Tar-get-Sharing microRNAs is a Mechanism for SIRT1 Overexpression in Cancer. RNA Biol. 2014; e32093.
58. Antony P, Rose M, Heidenreich A, Knuchel R, Gaisa NT, Dahl E. Epigenetic inactivation of ST6GAL1 in human bladder cancer. BMC Cancer. 2014; 14: 901. doi:10.1186/1471-2407-14-901PMID:25465919 59. Sakoda LC, Blackston C, Doherty JA, Ray RM, Lin MG, Stalsberg H, et al. Polymorphisms in steroid
hormone biosynthesis genes and risk of breast cancer and fibrocystic breast conditions in Chinese women. Cancer Epidemiol Biomarkers Prev. 2008; 17: 1066–1073. doi: 10.1158/1055-9965.EPI-07-2680PMID:18483327
60. Giani C, Fierabracci P, Bonacci R, Gigliotti A, Campani D, De Negri F, et al. Relationship between breast cancer and thyroid disease: relevance of autoimmune thyroid disorders in breast malignancy. J Clin Endocrinol Metab. 1996; 81: 990–994. PMID:8772562
61. Krupp M, Maass T, Marquardt JU, Staib F, Bauer T, Konig R, et al. The functional cancer map: a sys-tems-level synopsis of genetic deregulation in cancer. BMC Med Genomics. 2011; 4: 53. doi:10.1186/ 1755-8794-4-53PMID:21718500
62. Bernatsky S, Boivin JF, Joseph L, Rajan R, Zoma A, Manzi S, et al. An international cohort study of can-cer in systemic lupus erythematosus. Arthritis Rheum. 2005; 52: 1481–1490. PMID:15880596 63. Wei Z, Li H. A Markov random field model for network-based analysis of genomic data. Bioinformatics
23. 2007; 1537–1544. PMID:17483504
64. Schreiber G, Walter MR. Cytokine-receptor interactions as drug targets. Curr Opin Chem Biol. 2010; 14: 511–519. doi:10.1016/j.cbpa.2010.06.165PMID:20619718
65. Wu BK, Mei SC, Brenner C. RFTS-deleted DNMT1 enhances tumorigenicity with focal hypermethylation and global hypomethylation. Cell Cycle. 2014; 13: 3222–3231. doi:10.4161/15384101.2014.950886 PMID:25485502
66. Vidigal JA, Ventura A. The biological functions of miRNAs: lessons from in vivo studies. Trends Cell Biol. 2014.
67. Gu H, Bock C, Mikkelsen TS, Jager N, Smith ZD, Tomazou E, et al. Genome-scale DNA methylation mapping of clinical samples at single-nucleotide resolution. Nat Methods. 2010; 7: 133–136. doi:10. 1038/nmeth.1414PMID:20062050
68. Bibikova M, Barnes B, Tsan C, Ho V, Klotzle B, Le JM, et al. High density DNA methylation array with single CpG site resolution. Genomics. 2011; 98: 288–295. doi:10.1016/j.ygeno.2011.07.007PMID: 21839163