TCD
5, 951–1001, 2011Stable water isotopes of precipitation and
firn cores
F. Fernandoy et al.
Title Page
Abstract Introduction
Conclusions References
Tables Figures
◭ ◮
◭ ◮
Back Close
Full Screen / Esc
Printer-friendly Version Interactive Discussion
Discussion
P
a
per
|
Dis
cussion
P
a
per
|
Discussion
P
a
per
|
Discussio
n
P
a
per
|
The Cryosphere Discuss., 5, 951–1001, 2011 www.the-cryosphere-discuss.net/5/951/2011/ doi:10.5194/tcd-5-951-2011
© Author(s) 2011. CC Attribution 3.0 License.
The Cryosphere Discussions
This discussion paper is/has been under review for the journal The Cryosphere (TC). Please refer to the corresponding final paper in TC if available.
Stable water isotopes of precipitation and
firn cores from the northern Antarctic
Peninsula region as a proxy for climate
reconstruction
F. Fernandoy1, H. Meyer1, and M. Tonelli2
1
Alfred Wegener Institute for Polar and Marine Research in the Helmholtz Association, Potsdam, Germany
2
Oceanographic Institute, University of S ˜ao Paulo, Brazil
Received: 18 December 2010 – Accepted: 6 March 2011 – Published: 17 March 2011
Correspondence to: F. Fernandoy (francisco.fernandoy@awi.de)
TCD
5, 951–1001, 2011Stable water isotopes of precipitation and
firn cores
F. Fernandoy et al.
Title Page
Abstract Introduction
Conclusions References
Tables Figures
◭ ◮
◭ ◮
Back Close
Full Screen / Esc
Printer-friendly Version Interactive Discussion
Discussion
P
a
per
|
Dis
cussion
P
a
per
|
Discussion
P
a
per
|
Discussio
n
P
a
per
|
Abstract
In order to investigate the climate variability in the north Antarctic Peninsula region, this paper focuses on the relationship between stable isotope content of precipitation and firn, and main meteorological variables (air temperature, relative humidity, sea surface temperature, and sea ice extent). Between 2008 and 2010, we collected
pre-5
cipitation samples and retrieved firn cores from several key sites in this region. We conclude that the deuterium excess oscillation represents a robust indicator of the me-teorological variability on a seasonal to sub-seasonal scale. Low absolute deuterium excess values and the synchronous variation of both deuterium excess and air temper-ature imply that the evaporation of moisture occurs in the adjacent Southern Ocean.
10
Theδ18O–air temperature relationship is complicated and significant only at a (multi) seasonal scale. Backward trajectory calculations show that air-parcels arriving at the region during precipitation events predominantly originate at the South Pacific Ocean and Bellingshausen Sea. These investigations will be used as a calibration for on-going and future research in the area, suggesting that appropriate locations are located
15
above 600 m a.s.l. We selected the Plateau Laclavere, Antarctic Peninsula as the most promising site for a deeper drilling campaign.
1 Introduction
It is well known that Antarctica plays a key role in the earth’s climate regulation. The influence of the Antarctic Circumpolar Current over the ocean and atmosphere in the
20
Southern Hemisphere demonstrate the strong interconnection of the climate dynamics (White and Peterson, 1996). Lately, Antarctica has been in the focus of scientific atten-tion, due to the elevated rate of atmospheric warming during the second half of the 20th century. The warming rate of 0.082◦C decade−1as a mean value for whole Antarctica
(Chapman and Walsh, 2007) is in fact close to the rate for the Southern Hemisphere
25
TCD
5, 951–1001, 2011Stable water isotopes of precipitation and
firn cores
F. Fernandoy et al.
Title Page
Abstract Introduction
Conclusions References
Tables Figures
◭ ◮
◭ ◮
Back Close
Full Screen / Esc
Printer-friendly Version Interactive Discussion
Discussion
P
a
per
|
Dis
cussion
P
a
per
|
Discussion
P
a
per
|
Discussio
n
P
a
per
|
(0.4◦C decade−1), has no counterpart in any other region of the world (Vaughan et al.,
2003; Turner et al., 2005, 2009; Steig et al., 2009). The strongest trends were de-tected at coastal ground stations (e.g. Vernadsky Station (formerly Faraday): 0.56◦C
decade−11951–2000), and especially during winter seasons in the 1990s. Since then
the temperature trend seems to be at least stabilized or decreased (Turner et al., 2005;
5
Chapman and Walsh, 2007). Until now the consequences of the present elevated tem-perature conditions are not fully understood. The South Pacific and Atlantic ocean’s surface (0–300 m depth) have raised in temperatures by 0.13◦C and 0.23◦C,
respec-tively, for the period 1955–2003 in response to the elevated air temperatures (Levitus et al., 2005). Moreover, the sea surface temperature increase at the WAP reached
10
more than 1◦C for the period 1955–1998 during summer season (Meredith and King,
2005), and coincident retreat of the sea ice extent since 1958 (Abram et al., 2010). Warmer oceanic water triggers the melting of the base of ice shelves (Shepherd et al., 2004), leading to events like the disintegration of the Wordie ice shelf (Rignot et al., 2005). Thus, these events facilitate an accelerated discharge flow of inland glaciers to
15
the ocean (De Angelis and Skvarca, 2003). The retreat of the ice shelf and sea ice acts as a feed-back mechanism of atmospheric warming and a clear anti-correlation of the sea ice extent and surface air temperature at WAP exists (Weatherly et al., 1991; Turner et al., 2005; Bracegirdle et al., 2008). Up to 87% of 244 marine glacier fronts from the whole Antarctic Peninsula are presently retreating (Cook et al., 2005) and the
20
height line of permanent dry snow has clearly ascended over the last decades (Rau and Braun, 2002; Tedesco et al., 2007). The warming of both the atmosphere and the ocean has been producing an increase of humidity, leading to raised snow ac-cumulation rates in the southern WAP as shown by Thomas et al. (2008). However, the mass balance of the Antarctic Peninsula is negative with a loss of ∼38.1 Gt a−1,
25
mostly concentrated in the central and north regions (∼−28.6 Gt a−1) according to
TCD
5, 951–1001, 2011Stable water isotopes of precipitation and
firn cores
F. Fernandoy et al.
Title Page
Abstract Introduction
Conclusions References
Tables Figures
◭ ◮
◭ ◮
Back Close
Full Screen / Esc
Printer-friendly Version Interactive Discussion
Discussion
P
a
per
|
Dis
cussion
P
a
per
|
Discussion
P
a
per
|
Discussio
n
P
a
per
|
glacier advances at around 7 ka, 5 ka, 2 ka and 0.7 ka in the Holocene. According to Hall (2009) the present overall glacier retreat in the area of the Antarctic Peninsula is not unique in recent periods, but is now reaching warm conditions similar to those of the mid-Holocene within a short period of time (decades). Moreover, the ice shelf disintegration has not been detected even during the warm Holocene phases.
5
The rapid warming of the WAP most likely originated from the intensification of the westerly circumpolar trough and increasing transport of heat from the ocean at lower latitudes, which has been related to the positive shift of the Southern Annular Mode (SAM) index (Marshall, 2003) since the 1960’s (Thompson and Solomon, 2002; Gillett et al., 2006; Marshall et al., 2006). The intensification of SAM has recently been
re-10
lated to anthropogenic causes like increased concentration of greenhouse-gases in the atmosphere and ozone’s stratospheric depletion (Gillett et al., 2008). Little is known about when these processes started and their evolution through the industrial period. Additionally, the existing scarce meteorological data (∼50 yr) is often interrupted and
clearly geographically-biased, because most of the stations are located at coastal
re-15
gions. For these reasons, a better and deeper understanding of the climate variability of the last decades to centuries is still urgently needed for the region. The stable-isotope composition of Antarctic ice offers a unique proxy to extend the existing meteorological records well beyond the pre-instrumental times. The interpretation of this of proxy is not straight forward and requires a detailed study of the different parameters affecting the
20
isotope composition of precipitation stored in the glaciers. It has been demonstrated that precipitation reflects not only air temperature variations, but also conditions at the ocean surface, atmospheric teleconnections and circulation shifts, as well as other local effects (Ichiyanagi et al., 2002; Uemura et al., 2008; Thomas and Bracegirdle, 2009). In this paper we aim to construct a comprehensive isotope geochemical and
25
TCD
5, 951–1001, 2011Stable water isotopes of precipitation and
firn cores
F. Fernandoy et al.
Title Page
Abstract Introduction
Conclusions References
Tables Figures
◭ ◮
◭ ◮
Back Close
Full Screen / Esc
Printer-friendly Version Interactive Discussion
Discussion
P
a
per
|
Dis
cussion
P
a
per
|
Discussion
P
a
per
|
Discussio
n
P
a
per
|
2 Study area
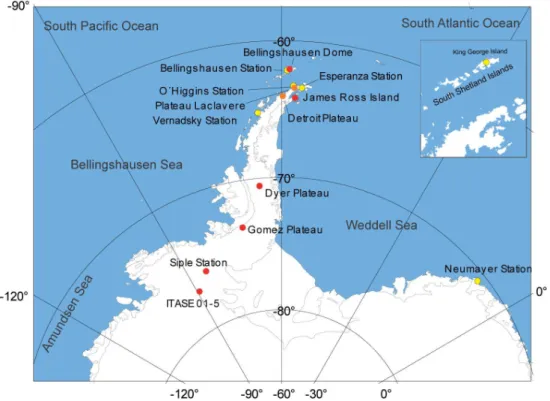
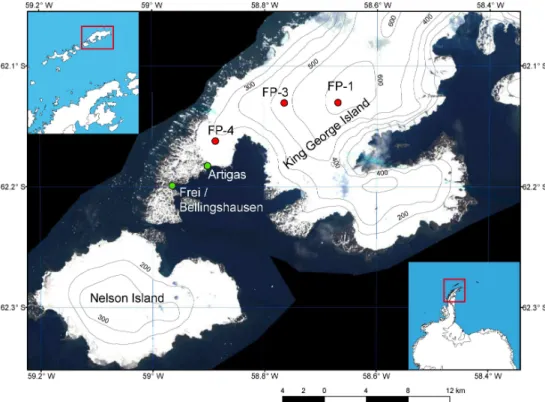
Our study focuses mainly on the northern Antarctic Peninsula and the South Shetland Islands. Two key regions were selected for our field work due to their glaciological potential, relatively easy access, adequate logistical facilities and previous work. These two areas are the ice cap covering King George Island (KGI), South Shetland Islands,
5
and the region south-east of the Chilean Antarctic Station “Bernardo O’Higgins” (later referred to as O’Higgins – OH) at the Antarctic Peninsula (API) (Fig. 1).
KGI is a 1250 km2 island covered by an ice cap with an extension of more than 1158 km2(>90% of KGI) (Sim ˜oes et al., 1999). The climate regime of the island is char-acterized by maritime conditions. The surface mean annual air temperature (MAAT)
10
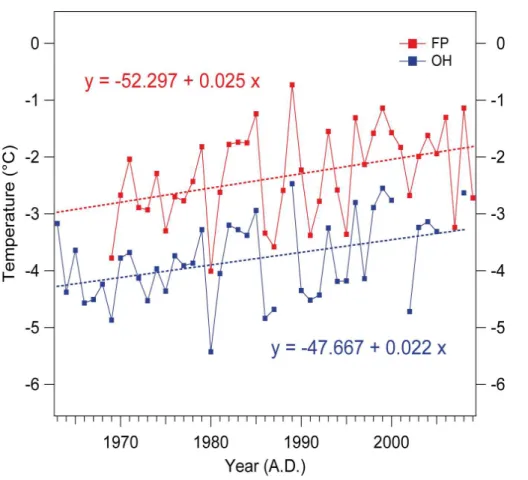
recorded at the Russian Station Bellingshausen is−2.3◦C for the period 1968–2009.
A clear positive temperature trend of 0.025◦C a−1 is observed since the beginning of
the meteorological record (Fig. 2). According to Blindow et al. (2010) and R ¨uckamp et al. (2010), the ice cap of KGI displays a polythermal regime, with a lower temperate part and a cold part above 400 m a.s.l. However, the exact line of transition between
15
temperate and cold regime is still a matter of discussion. The altitude of the ice cap reaches the 700 m a.s.l. in the central region of KGI (Blindow et al., 2010). R ¨uckamp et al. (2010) and Wen et al. (1998) estimate that the MAAT at the highest point of the ice cap should be around−6 to−6.6◦C. This implies that the KGI ice cap is very sensitive
to climate variability. The firn/ice transition was identified by radio echo sounding
pro-20
files at 35 m depth (Blindow et al., 2010) and by density profiles of ice cores retrieved at the main glacier dome (700 m a.s.l.) in this island (Sim ˜oes et al., 2004). Both studies detected a water table above the firn/ice transition. As a consequence of the climatic conditions of the region, strong melting, melt water percolation, and refreezing pro-cesses are evident, thus making the drilling process and interpretation of the isotope
25
signal in the temperate part of the ice cap complicated.
TCD
5, 951–1001, 2011Stable water isotopes of precipitation and
firn cores
F. Fernandoy et al.
Title Page
Abstract Introduction
Conclusions References
Tables Figures
◭ ◮
◭ ◮
Back Close
Full Screen / Esc
Printer-friendly Version Interactive Discussion
Discussion
P
a
per
|
Dis
cussion
P
a
per
|
Discussion
P
a
per
|
Discussio
n
P
a
per
|
for KGI, however, the MAAT at sea level is slightly lower (−3.8◦C) for the period 1963–
2008 at the O’Higgins Station, which is located 140 km to the south of KGI (Fig. 1). The trend of the air temperature registered at this station is similar to that from KGI, with an increase of 0.022◦C a−1(Fig. 2). The nearby Laclavere Plateau (1030 m a.s.l.),
around 19 km to the south-east of OH (Fig. 1), was reached and explored for the first
5
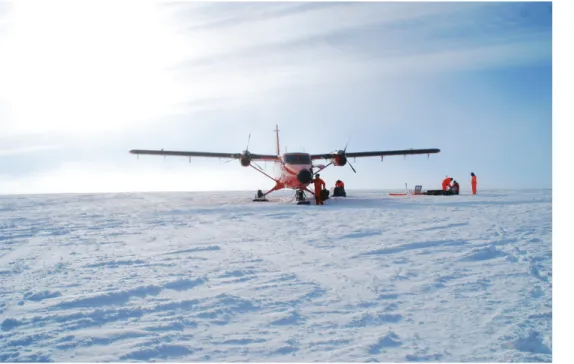
time during the austral summer 2010. The plateau has a flat surface of approximately 6 km long and 3 km wide (Fig. 3) and divides the warmer and moist west side from the colder and drier east side of API. Therefore, this plateau represents a key location to investigate the recent climate variation of the region. Using the same temperature gradients invoked by R ¨uckamp et al. (2010) and Wen et al. (1998), the MAAT at
Lacla-10
vere should be around−10◦C, since the temperature oscillation recorded at OH is in
the range of 3.6◦C, the air temperature should stay the whole year below the freezing
point, making this area ideal for glaciological investigations.
In addition to the ice-coring work a network for collecting precipitation samples was established in cooperation with the Chilean Meteorological Service (DMC) and the
15
Antarctic Department of the Chilean Army (DAE). Two stations collect precipitation samples and provide the meteorological record on a daily schedule since 2008 until present. These are located at the Antarctic Chilean Stations Eduardo Frei (FP) and Bernardo O’Higgins (OH), situated on Fildes Peninsula, KGI, and the API, respectively (Fig. 1).
20
3 Methods
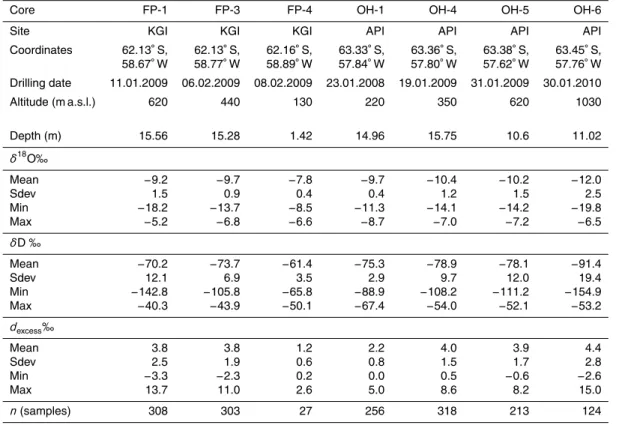
During three consecutive summer campaigns (2008–2010), several firn cores (more than 80 m in total) were retrieved from KGI and the northern part of API. At both locali-ties, an altitudinal profile was completed from sea level up-to 1030 m a.s.l. A total of 7 firn cores are included in this paper: FP-1, FP-3 and FP-4 from KGI (Fig. 4), and OH-1,
25
TCD
5, 951–1001, 2011Stable water isotopes of precipitation and
firn cores
F. Fernandoy et al.
Title Page
Abstract Introduction
Conclusions References
Tables Figures
◭ ◮
◭ ◮
Back Close
Full Screen / Esc
Printer-friendly Version Interactive Discussion
Discussion
P
a
per
|
Dis
cussion
P
a
per
|
Discussion
P
a
per
|
Discussio
n
P
a
per
|
300 samples were gathered (Table 2). The firn cores were retrieved using a mechan-ical drilling device (Rufli auger), stored frozen at O’Higgins and the Chilean scientific station Escudero (King George Island) and later transported to the ice core processing facilities of the Alfred Wegener Institute in Bremerhaven, Germany. There, the cores were sampled with a 5 cm resolution for stable-isotope analyses. A visual logging and
5
description of the cores was carried out to identify melt layers. Thereafter, firn and recent precipitation samples were analysed by Finnigan Delta-S mass spectrometers, following the gas equilibration technique as described by Meyer et al. (2000). Stable-isotope data are later compared to major meteorological and synoptic features of the region. For this purpose different data sets are incorporated to our analysis.
Meteo-10
rological data at daily and monthly resolutions are available from the Global Summary of the Day (GSOD) data sets of the National Climatic Data Center (NCDC, available at: www.ncdc.noaa.gov), and the SCAR Reference Antarctic Data for Environmental Research (READER, available at: www.antarctica.ac.uk/met/READER/) (Turner et al., 2004), respectively. Sea ice index and sea surface temperature (SST) time series
15
were extracted from the Hadley Centre Sea Ice and Sea Surface Temperature data set (HadISST, http://hadobs.metoffice.com/hadisst/).
The HadISST provides SST on a global 1◦ to 1◦ grid and sea ice coverage fields
were derived from in situ sea surface observations and satellite derived estimates. Sea ice coverage and SST fields are provided in monthly means from 1973 to the
20
present (Rayner et al., 2003). NCEP/NCAR reanalysis data (Kalnay et al., 1996) were used to estimate the relative humidity (h) of the region. This reanalysis uses a state-of-the-art analysis/forecast system to perform atmospheric data assimilation from 1948 to the present. Datasets are provided in a 2.5◦ to 2.5◦ latitude-longitude
regular grid. HadISST and NCEP/NCAR fields were resampled to a regional scale
25
in a Bellingshausen component (West Antarctic Peninsula), Weddell Sea component (East Antarctic Peninsula) and a whole region component (Bellingshausen and Wed-dell composite). The fields were resampled bordered by 85◦W to 40◦W longitude
TCD
5, 951–1001, 2011Stable water isotopes of precipitation and
firn cores
F. Fernandoy et al.
Title Page
Abstract Introduction
Conclusions References
Tables Figures
◭ ◮
◭ ◮
Back Close
Full Screen / Esc
Printer-friendly Version Interactive Discussion
Discussion
P
a
per
|
Dis
cussion
P
a
per
|
Discussion
P
a
per
|
Discussio
n
P
a
per
|
the time series used. Additionally, for each precipitation event registered at O’Higgins station, a 3-day air parcel backward trajectory was calculated to identify the mois-ture mass provenance. For this purpose, we used the free accessible Hybrid single-particle Lagrangian integrated trajectory (HYSPLIT) model (Draxler and Hess, 1998, available at http://ready.arl.noaa.gov/HYSPLIT.php). This 3-D model was fed with
5
the global data assimilation system (GDAS) archives from NOAA/NCEP (Kanamitsu, 1989). GDAS offers a global 1◦ to 1◦ latitude-longitude spatial coverage with a 6-h
temporal resolution and is available from 2004 to the present (for more details visit http://ready.arl.noaa.gov/gdas1.php). Single trajectories were later grouped in 4 ma-jor clusters for each station, following a statistical treatment that calculates the spatial
10
variance of the trajectories.
4 Results and discussion
4.1 δ18O andδD
Stable isotopes (oxygen and hydrogen) content of water molecules in precipitation are considered as an excellent proxy to trace seasonal changes in air temperatures,
es-15
pecially in Polar Regions (Dansgaard, 1964; van Ommen and Morgan, 1997). Ther-modynamic differences between the natural oxygen and hydrogen stable isotopes lead to the fractionation of water molecules (18O/16O and2H/H ratios) during water phase changes (such as evaporation). Moreover a continuous depletion of the heavy isotopes occurs relative to the temperature variation and trajectory of air masses during
con-20
densation (Dansgaard, 1964). Distillation of the heavy isotopes from an air mass will follow approximately a Rayleigh-type process (Dansgaard, 1964; Gat, 1996). In-cloud condensation of moisture occurs in an approximately closed system and therefore the isotopic composition at the moment of precipitation will depend mainly on the local air temperature (Rozanski et al., 1993; Gat, 1996; Clark and Fritz, 1997). This makes
25
TCD
5, 951–1001, 2011Stable water isotopes of precipitation and
firn cores
F. Fernandoy et al.
Title Page
Abstract Introduction
Conclusions References
Tables Figures
◭ ◮
◭ ◮
Back Close
Full Screen / Esc
Printer-friendly Version Interactive Discussion
Discussion
P
a
per
|
Dis
cussion
P
a
per
|
Discussion
P
a
per
|
Discussio
n
P
a
per
|
moisture sources. In the next section, oxygen and hydrogen stable water isotopes of precipitation and firn core samples are presented, compared and discussed. All results are referred to the Vienna Standard Mean Ocean Water Standard (VSMOW) in ‰ , as
δ18O andδD for oxygen and hydrogen isotopes, respectively.
4.1.1 Precipitation samples
5
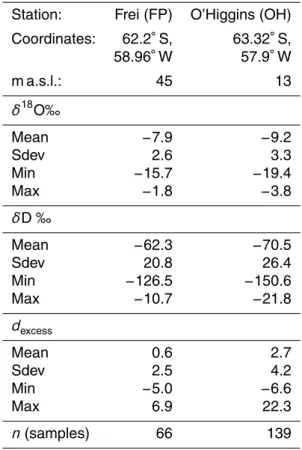
Table 2 shows the results and basic statistics for the precipitation samples collected at FP and OH stations. At both stations the collection period was 14 months (Febru-ary 2008 to March 2009). Unfortunately an extended gap in time during the collection in winter occurs at FP, as a consequence of logistic difficulties. Therefore, we base our analysis mainly on the samples collected at OH and transfer the conclusions to KGI,
10
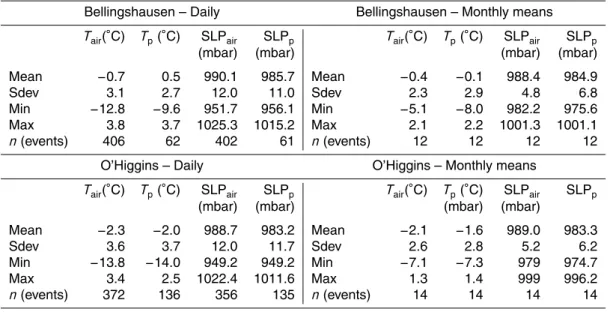
since meteorological conditions like mean air temperature (here referred to asTair) of both localities highly correlate on a daily to seasonal time scale (r=0.89, p <0.01; February 2008 to March 2010). From the OH meteorological record, the mean daily
Tair during the whole sampling period (−2.1◦C) is around 0.3◦C lower than the mean
daily air temperature calculated only for days with precipitation eventsTp. In parallel, a
15
lower mean air pressure at sea level is observed during days with precipitation events compared to the whole period (MSLPp=983.2 mbar is 5 mbar lower than MSLPair ) (Table 3). It should be noted that the year 2008 was around 0.8◦C warmer than the
average of the past 2 decades (1989–2009), but an anomaly in MSLP has not been detected. The collected precipitation samples show almost no seasonal difference in
20
the distribution of the precipitation events during 2008–2009. 33, 35, 36 and 35 pre-cipitation events were registered during summer (DJF), autumn (MAM), winter (JJA) and spring (SON), respectively. On a monthly scale, a semi-annual behaviour in the number of events is apparent with maxima at the end of summer and during spring, and an extreme peak in June 2008 (16 events). The semi-annual distribution at OH is
25
TCD
5, 951–1001, 2011Stable water isotopes of precipitation and
firn cores
F. Fernandoy et al.
Title Page
Abstract Introduction
Conclusions References
Tables Figures
◭ ◮
◭ ◮
Back Close
Full Screen / Esc
Printer-friendly Version Interactive Discussion
Discussion
P
a
per
|
Dis
cussion
P
a
per
|
Discussion
P
a
per
|
Discussio
n
P
a
per
|
The isotope analysis of the precipitation samples show that meanδ18O value of OH (−9.2‰) is more depleted than the mean value of FPδ18O (−7.9‰). It is likely that this
marked difference is not completely caused by a latitudinal effect (temperature diff er-ence) between both stations, but may rather be explained by a biased sampling due to the lack of winter samples at FP. As mentioned before, usually a correlation between
5
air (condensation) temperature andδ18O (δD) composition of precipitation exists, yet the observed relationship is not easy to understand (Fig. 6). The isotope composition of precipitation at daily resolution correlates relative poorly withTp(r=0.35,p <0.01). This is mostly related to the meteorological instability and low temperature oscillation (standard deviation,σair=3.5◦C), typical for the maritime influence and for the
com-10
plexity of the isotope fractionation process at coastal regions (Carrasco et al., 2003; Noone, 2008; Sime et al., 2009). On the other hand, monthly averages calculated from daily events, significantly improve theδ18O/T correlation coefficient (r=0.79,p <0.01) (Fig. 7): this improvement of the δ18O/T correlation is produced by the smoothing of (high) daily variability, and therefore enhance of the seasonal Tair oscillation. This
15
confirms thatδ18O composition of precipitation, at least on a seasonal scale, indeed captures theTair variations of the region, despite of the limited seasonal temperature fluctuations. The temperature difference between monthly Tair and Tp (Table 3) at a monthly scale is aroundTp=Tair +0.5◦C. For this reason a correction has to be
ap-plied for the δ18O/Tair relationship. From the monthly means a δ18O/T gradient of
20
0.41‰◦C−1 has been calculated, being quite similar to that determined for the station
Vernadsky (formerly Faraday). The Ukrainian Vernadsky Station has an extensive iso-topic data base of more than 40 yr, which started in 1964 and finished in 2005, while the meteorological record expands from 1947 to the present.
From theδD/δ18O relation (Craig, 1961; Rozanski et al., 1993), known as meteoric
25
TCD
5, 951–1001, 2011Stable water isotopes of precipitation and
firn cores
F. Fernandoy et al.
Title Page
Abstract Introduction
Conclusions References
Tables Figures
◭ ◮
◭ ◮
Back Close
Full Screen / Esc
Printer-friendly Version Interactive Discussion
Discussion
P
a
per
|
Dis
cussion
P
a
per
|
Discussion
P
a
per
|
Discussio
n
P
a
per
|
(Rozanski et al., 1993), indicating that condensation process occurs in equilibrium con-ditions. Additionally, no seasonal variations of the condensation conditions (seasonal effect) are interpreted from our data. The similar slopes of both lines but lower intercept of the LMWL (1.2‰) than that of the GMWL (Fig. 8a), indicates slightly differences of evaporation conditions in the moisture source with respect to the global average. This
5
point will be discussed in greater detail in the following sections.
4.1.2 Firn cores
Measurements of δ18O and δD were performed for all cores at 5 cm resolution. In Table 1, a detailed description of the results from all firn cores is displayed. The location of the 7 cores described here is shown in Figs. 4 and 5 for FP and OH, respectively.
10
The most negative meanδ18O value (−12‰) is found for core OH-6. The location of
core OH-6 corresponds with the highest altitude of the study area (1030 m a.s.l.). On the other hand, the cores OH-1, OH-4 and OH-5 show only a slight difference of their
δ18O mean, as well as compared to precipitation δ18O mean values, despite of the altitude differences between the coring locations. This implies that an isotopic altitude
15
effect is visible only above 600 m a.s.l. (i.e. between the location of OH-5 and OH-6). Unfortunately no direct comparison within the cores from FP is possible, since only 2 of the 3 cores are suitable but located too closely to each other, thus no altitude effect is visible. Co-isotope δD/δ18O diagrams of the cores allow comparing recent precipitation samples to samples from firn cores, similar to the LMWL explained in
20
Sect. 4.1.1. From Fig. 8b, it is observed that all firn cores have a slope close to 8 and intercepts between 0.4 and 4, and are therefore quite similar to the precipitation LMWL (below the GMWL). From these observations, it can be derived that (1) the fractionation during the condensation process is common for the whole region, and (2) that post-depositional effects (e.g. diffusion and/or sublimation) do not play an important role for
25
TCD
5, 951–1001, 2011Stable water isotopes of precipitation and
firn cores
F. Fernandoy et al.
Title Page
Abstract Introduction
Conclusions References
Tables Figures
◭ ◮
◭ ◮
Back Close
Full Screen / Esc
Printer-friendly Version Interactive Discussion
Discussion
P
a
per
|
Dis
cussion
P
a
per
|
Discussion
P
a
per
|
Discussio
n
P
a
per
|
It is widely accepted that annual δ18O and δD maxima (minima) occur in summer (winter) coincident with highest (lowest) air temperature in the southern high latitudes. The counting of alternation of these peaks is the most common method used for dating of firn and ice in regions with high accumulation (Legrand and Mayewski, 1997). How-ever, this is not an easy task in our study area. As seen in Table 1, all firn cores below
5
600 m a.s.l. show a strong smoothing of the isotopic signal that can be visualized from theδ18O andδD standard deviation values (σcores), caused by the summer melt of the surface snow and firn. Theσcores for both FP and OH locations are clearly dependent on the altitude, with constrainedσcores for the cores in lower altitudes and increasing
σcores in high locations. Moreover, the deviation of the isotope composition of OH-6
10
(σ=2.5) is almost identical to that of OH precipitation (σ=3.3), pointing out that at this location, melt is absent or strongly reduced. These observations are also confirmed by the visual inspection of the firn cores OH-1, OH-4, FP-3 and FP-4, which displays several ice layers caused by melt and refreezing up to several centimetres thick. In the case of these cores retrieved closer to the coast, the infiltration and refreezing is
espe-15
cially strong with up to 0.5 m thick melt/refreeze sections. In contrast, the core OH-6 does not show any major ice layers. The few ice layers in this core are all less than 1 cm thick and rather representing wind-glazed crusts. An exception was observed at around 0.5 m depth (snow) where a clear melt-refreeze ice layer is visible with a thick-ness of around 2 cm. This layer has a clearly defined upper surface, and was then
20
covered by snow. Despite of the fact that the cores above 600 m a.s.l. (FP-1, OH-5 and especially OH-6) are most likely not (or only rarely) affected by melt-percolation processes, no clear seasonality in theδ18O (δD) record can be seen (Fig. 9). Thus, the dating and estimation of accumulation rate is not a straight forward procedure. The explanation for this feature is linked to the meteorology of the region, with restricted
25
TCD
5, 951–1001, 2011Stable water isotopes of precipitation and
firn cores
F. Fernandoy et al.
Title Page
Abstract Introduction
Conclusions References
Tables Figures
◭ ◮
◭ ◮
Back Close
Full Screen / Esc
Printer-friendly Version Interactive Discussion
Discussion
P
a
per
|
Dis
cussion
P
a
per
|
Discussion
P
a
per
|
Discussio
n
P
a
per
|
local MAAT variation), depending on local daily, synoptic and seasonal atmospheric and meteorological characteristics. The isotope seasonality signal of our study region is further discussed in the following deuterium excess section.
4.2 Deuterium excess
The secondary isotopic parameter deuterium excess (dexcess), was defined by
Dans-5
gaard (1964) in the following relationship:d=δD–8δ18O. This parameter refers to the fractionation rate difference (or excess) of HD16O and H182 O during the evaporation of water vapour from the ocean (kinetic evaporation process). Since the posterior in-cloud condensation is considered to occur in equilibrium conditions (Dansgaard, 1964; Gat, 1996), thedexcessgenerally does not undergo further modifications during the rain-out
10
process. Therefore, dexcess will depend mainly on the conditions at the evaporation moment, i.e. relative humidity (h), sea surface temperature (SST) and wind speed at the moisture source. Because of these characteristics,dexcess is useful to identify the moisture source conditions and to reconstruct variations of these conditions in time, a tool broadly accepted and well-suited for glacio-geochemical investigations (e.g. Stenni
15
et al., 2010). Uemura et al. (2008) made direct measurements of water vapour above the sea level at southern high latitudes, as one of the first empirical validations of the dexcess variability in response to sea surface conditions. They found that dexcess
negatively correlates withhand positively correlates with SST, however, a strong and random variability is observed close to the Antarctic coast region. Here, we present
20
and discuss the results of the high-resolution measurements ofdexcesscalculated from
δ18O andδD values.
4.2.1 d excess of precipitation
From all 139 samples collected at OH between February 2008 and March 2009 sin-gledexcess values have been calculated (Fig. 10). A meandexcess value of 2.7‰
(Ta-25
TCD
5, 951–1001, 2011Stable water isotopes of precipitation and
firn cores
F. Fernandoy et al.
Title Page
Abstract Introduction
Conclusions References
Tables Figures
◭ ◮
◭ ◮
Back Close
Full Screen / Esc
Printer-friendly Version Interactive Discussion
Discussion
P
a
per
|
Dis
cussion
P
a
per
|
Discussion
P
a
per
|
Discussio
n
P
a
per
|
conditions of relatively high h, most probably with origin in the adjacent Southern Ocean. According to the relationship defined by Uemura et al. (2008): d=−0.61h
+ 55.7, the evaporation of moisture that arrives at OH should occur under condi-tions of ∼87% relative humidity, close to the global mean of 85% (Clark and Fritz,
1997) calculated for the GMWL of Craig (1961) and the GNIP data base (available at:
5
http://www-naweb.iaea.org/napc/ih/index.html) (Rozanski et al., 1993). The disagree-ment between global mean values and precipitation at OH (contrastingdexcessbut sim-ilarh), indicates that the use of the GMWL for Antarctic coastal regions is not precise, since evaporation and condensation occurs under different conditions than those from tropical and sub-tropical regions. Therefore, we introduce a local MWL, which should
10
better fit for these purposes.
Dailydexcess values are shown in Fig. 10, displaying a large variability, especially in winter. A very similar, but inverse pattern is seen for theTair (Fig. 10, light grey line), therefore suggesting that local Tair controls the dexcess variability. This is a substan-tial observation of this investigation, because: (1) this gives the possibility to use the
15
dexcessvariability as geochemical proxy for localTair and (2) the synchronous (inverse) variation ofTairanddexcessimplies that the moisture source should be located relatively near, since a longer path of moisture masses arriving at OH, will cause a lag onTair−d
excess oscillations. Furthermore, the single events reveal thatdexcessis a good indica-tor of extreme meteorological conditions, as observed in fast drops ofTair, e.g. on 4 July
20
(Tp=−14◦C), 5 August (T
p=−9◦C) and 23 August (Tp=−12◦C) reflected in a strong increase ofdexcess(22.3‰, 13.8‰ and 14.6‰), respectively (Fig. 10), which is charac-teristic for input of Antarctic continentally originated moisture. The increase ofdexcess
has been related to changes in the fractionation rates at extreme low temperatures and to the kinetic fractionation produced by the ice-crystal formation from super-cooled air
25
masses. This effect is mainly visible above 2000 m a.s.l. (Jouzel and Merlivat, 1984; Masson-Delmotte et al., 2008). Nonetheless, the general negative correlation of daily
TCD
5, 951–1001, 2011Stable water isotopes of precipitation and
firn cores
F. Fernandoy et al.
Title Page
Abstract Introduction
Conclusions References
Tables Figures
◭ ◮
◭ ◮
Back Close
Full Screen / Esc
Printer-friendly Version Interactive Discussion
Discussion
P
a
per
|
Dis
cussion
P
a
per
|
Discussion
P
a
per
|
Discussio
n
P
a
per
|
scale, as forδ18O, mostly because the extreme and fast changes in temperature are smoothened, and by this revealing a more realistic relationship between dexcess and
Tair (and Tp). The winter temperature drop of the precipitation site is then linked with an increase ofdexcess. The physical explanation is most likely the decrease ofhand/or SST at the moisture source. Figure 11 shows a summary of the monthly mean values
5
ofdexcess,Tair andTp. Linear regressions demonstrate that the correlation coefficients (r) are high between both,Tair andTprelative todexcess values. Regressions andr are given for monthly mean values by the expressions:
1. d=1.54 – 0.54Tair (r=−0.61,p <0.01) and
2. d=1.73 – 0.59Tp(r=−0.72,p <0.01)
10
The linear regression equations demonstrate that the isotopic composition of precip-itation from this region reflects most of the meteorological variability at seasonal and even sub-seasonal scales. Therefore, we conclude that the isotope composition of precipitation represent a suitable proxy forTair and climate parameters reconstruction.
4.2.2 Deuterium excess of firn cores
15
The dexcess of most of the firn cores show mean values close to 4‰ (Table 1), with values around 1.3‰ above the mean dexcess value for precipitation (OH=2.7‰), an exception are the cores OH-1 and FP-4 (dexcess of 1.2‰ and 2.2‰, respectively). De-spite the slight difference of dexcess values between OH station and firn core values, are clearly under the GMWL (dexcess=10‰). At this step, some influence of moisture
20
of continental provenance cannot be discarded for high altitude locations of KGI and API. As demonstrated above, both high-altitudes cores (OH-5, OH-6 and FP-1) do not indicate major signs of melting and/or percolation. Furthermore OH-6 show the high-estdexcess value of all cores (4.4‰). Thus, thedexcessvalues in high altitude locations could reflect a slightly different moisture composition as compared to the coastal area.
25
TCD
5, 951–1001, 2011Stable water isotopes of precipitation and
firn cores
F. Fernandoy et al.
Title Page
Abstract Introduction
Conclusions References
Tables Figures
◭ ◮
◭ ◮
Back Close
Full Screen / Esc
Printer-friendly Version Interactive Discussion
Discussion
P
a
per
|
Dis
cussion
P
a
per
|
Discussion
P
a
per
|
Discussio
n
P
a
per
|
towards low altitudes. Therefore, thedexcessdifference between firn cores and precip-itation values is likely not to be related to post-depositional effect. Additionally, melt and/or infiltration of lowerdexcess (summer) precipitation can be discarded as the main cause of the lower values with decreasing altitude, sincedexcessof OH-1 (220 m a.s.l.) is similar to that of precipitation at OH station. As previously mentioned, at this station
5
year-round well distributed precipitation events were sampled and a seasonal bias of isotope composition can for this reason be rejected. Other local effects like diffusion within the snow cover or preferential removal of lowdexcess layers cannot be ruled out without direct observations (e.g. wind drift or sublimation), but these have been con-sidered to be not significant for the API region, due to the high precipitation rates, and
10
therefore not having a great impact on the isotope composition (van Lipzig et al., 2004). The comparison of thedexcess standard deviation (σexcess) of firn cores and precipita-tion demonstrate that closer to the coast firn displays a strong homogenizaprecipita-tion of the isotope composition, where σexcess for OH station (σexcess=2.7) is clearly larger than coastal cores OH-1 (σexcess=0.8) and FP-4 (σexcess=0.6). Larger values ofσexcessare
15
found only at the high altitudes regions (>600 m a.s.l.) of OH and FP (see Table 1). Lowerdexcessvalues, as mentioned above, are associated with more humid conditions at the moisture source. This supports the assumption that the coastal regions are in-fluenced by a stronger maritime regime, which slightly decreases towards the higher altitudes.
20
Similar to the observed seasonal variations of the OH data, thedexcessof firn cores presents a marked seasonality (Fig. 12), hence allowing the use of thedexcessseasonal variability as an instrument for dating of the accumulated snow and firn. In Fig. 13, the smootheddexcessof cores OH-6, OH-1 and FP-1 are compared to theTairfrom FP. The smoothing of thedexcesssignal was done using a special moving average function (box
25
function), considering a similar number of points before and after the smoothed value (21 points, ∼1 m firn depth). In this case the FP record has been used because of
TCD
5, 951–1001, 2011Stable water isotopes of precipitation and
firn cores
F. Fernandoy et al.
Title Page
Abstract Introduction
Conclusions References
Tables Figures
◭ ◮
◭ ◮
Back Close
Full Screen / Esc
Printer-friendly Version Interactive Discussion
Discussion
P
a
per
|
Dis
cussion
P
a
per
|
Discussion
P
a
per
|
Discussio
n
P
a
per
|
anddexcess. Moreover, assuming that accumulation is approximately constant through all seasons, resampling to monthly means of the isotope data of firn cores can be per-formed. This allows a direct comparison of monthly Tair and dexcess values (monthly re-sampled). Correlation coefficients for monthly means are given in Table 4. Addi-tionally, theδ18O resampled value is presented for comparison, reaffirming the
com-5
plexity to directly inferTair from oxygen and deuterium data. From the generated age model, it can be preliminarily concluded that both locations have high accumulation rates. Wen et al. (1998) and Sim ˜oes et al. (2004) retrieved ice cores from the main plateau area at KGI during different field seasons. Density of snow/firn of these cores show a compaction with an approximately linear tendency in the first 20 m and an
in-10
crease step of 4.5 kg m−3per meter, the surface snow density is estimated to be around
490 kg m−3. Using these density profiles combined with our age model of FP-1,
accu-mulation rates of 2542, 2296 and 1935 kg m−2a−1 are estimated for 2008, 2007 and
2006, respectively for this location. These rates are similar to the mean accumulation of 2480 kg m−2a−1 described by Wen et al. (1998), but much higher than
accumula-15
tion rates calculated by Sim ˜oes et al. (2004) of about 590 kg m−2a−1. However, the
snow/firn cover of KGI includes several ice layers, which are the product of percolation and refreezing. These may lead to overestimated density values, which would therefore correspond to higher accumulation rates. In general, the Antarctic coast exhibits ele-vated accumulation rates (van den Broeke et al., 2006; Masson-Delmotte et al., 2008).
20
Hence, we conclude that Sim ˜oes et al. (2004) underestimated the accumulation rates of this location.
4.3 Mainδ andd excess forcing
In the preceding sections the relationship of stable water isotopes and Tair has been largely discussed. Nonetheless, correlation coefficients for this relationship are in some
25
TCD
5, 951–1001, 2011Stable water isotopes of precipitation and
firn cores
F. Fernandoy et al.
Title Page
Abstract Introduction
Conclusions References
Tables Figures
◭ ◮
◭ ◮
Back Close
Full Screen / Esc
Printer-friendly Version Interactive Discussion
Discussion
P
a
per
|
Dis
cussion
P
a
per
|
Discussion
P
a
per
|
Discussio
n
P
a
per
|
may reproduce well theTair variability. On the other handdexcess (from cores and pre-cipitation) turns out to be significantly suitable to study the regional climatic variability, because it does not directly depend on local conditions. The synchronicity ofTair and
dexcess variation, with lowdexcess values, suggest a (humid) nearby oceanic source of the moisture precipitating at the study region. Thedexcess depends primarily on theh
5
and SST of the moisture source, moreoverhand SST seasonal oscillation are linked and influenced by the sea ice cover. During winter, the sea ice cover can obstruct the contact between the water surface and atmosphere, therefore influencing Tair,h and SST. Weatherly (1991) proved the interdependency ofTairand sea ice cover, acting as inverse feed-back mechanisms of each other, i.e. an extended sea ice cover in winter
10
will cause a decrease ofTair, and on the other handTair in summer will predispose the following season’s sea ice genesis. This mechanism is strong at the API region, since most of the local oceanic moisture is transported by the westerlies and then trapped by the natural barrier of the API range; therefore directly influencing the isotope composi-tion of coastal precipitacomposi-tions. Similar conclusion on the effect of sea ice over the isotope
15
composition of moisture were drawn by Noone and Simmonds (2004), recognizing the potential of water isotope (particularly thedexcess) for paleo-climate reconstruction.
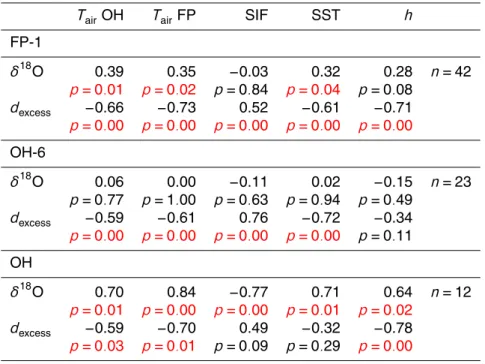
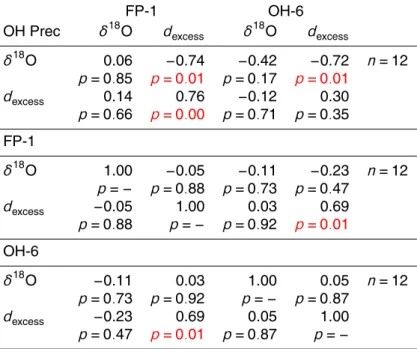
In our study, the local isotope variability is evaluated for Tair, SST, h and sea ice cover (expressed as sea ice fraction – SIF) as the main drivers of the seasonal to sub-seasonal isotope composition of moisture masses (Fig. 14). Table 5 displays a
20
correlation matrix forδ18O anddexcessvalues of two firn cores (OH-6 and FP-1) monthly resample and of monthly mean precipitation, compared with the meteorological time series. High correlation coefficients are found fordexcessof both firn cores withTair from FP and OH stations (note that the OH station shows slighter lower coefficients probably related to the data gaps of the time series). As expected from our previous observations
25
TCD
5, 951–1001, 2011Stable water isotopes of precipitation and
firn cores
F. Fernandoy et al.
Title Page
Abstract Introduction
Conclusions References
Tables Figures
◭ ◮
◭ ◮
Back Close
Full Screen / Esc
Printer-friendly Version Interactive Discussion
Discussion
P
a
per
|
Dis
cussion
P
a
per
|
Discussion
P
a
per
|
Discussio
n
P
a
per
|
not significant. Nevertheless, this is forced by two highdexcessvalues, because of the low number of observations (n=23). High dexcess values most likely do not represent oceanic moisture and are linked to more continental influenced moisture. If these two peaks are removed, the correlation improves tor=−0.46 and become significant at p-level<0.05. OH monthly meanδ18O anddexcess of precipitation correlate very well to
5
Tair from both stations with a very high correlation coefficient with respect to FP station. The relationship between isotope composition and SIF, SST andhis more complicated to interpret since the number of valid observation is very restricted. In any case again the correlation between h and dexcess remains strong. On the other hand, several studies show that NCEP/NCAR reanalysis overestimate some of the meteorological
10
parameters (Hines et al., 2000; Smith et al., 2001). From our observation a relative humidity for the moisture source of about 84% (cores OH-6 and FP-1) to 87% (OH precipitation) was estimated. NCEP/NCAR reanalysis for the corresponding locations and time periods estimates a slightly higherh=89% for all cases.
The inter-comparison between the two different locations with respect to the
precip-15
itation samples in a common time-span (Table 5), i.e. the period of common overlap of the two firn cores and precipitation collection (12 months in total, March 2008 to March 2009), allows to test the strength of the regional isotope signal. Theδ18O corre-lation for the firn cores and precipitation shows no coherent pattern, reflecting the high spatial variability of local meteorological (e.g.Tair) conditions. On the other hand, from
20
this matrix is again confirmed that the dexcess signal correlates for all data sets, with coefficients close or higher than 0.7, reaffirming the robustness of the monthlydexcess
signal.
5 Backward trajectory model
With the objective to further investigate the (physical) source of moisture masses
25
TCD
5, 951–1001, 2011Stable water isotopes of precipitation and
firn cores
F. Fernandoy et al.
Title Page
Abstract Introduction
Conclusions References
Tables Figures
◭ ◮
◭ ◮
Back Close
Full Screen / Esc
Printer-friendly Version Interactive Discussion
Discussion
P
a
per
|
Dis
cussion
P
a
per
|
Discussion
P
a
per
|
Discussio
n
P
a
per
|
to reconstruct a 3-day backward circulation path of every single precipitation event registered at OH station arriving at 1500 m a.s.l. (850 mb approximately). Figure 15 presents a frequency chart of all paths that arrived during daily precipitation events between February 2008 and March 2009 (139 events). This figure shows a wide dis-tribution of the trajectories varying in their origin from South Pacific in the north to the
5
Bellingshausen Sea in the south, from the east (Weddell Sea and South Atlantic) some sporadic events are seen as well. Most of the trajectories follow a clear pattern following a restricted pathway between latitudes 60◦and 65◦S. Following a statistical treatment,
all trajectories were clustered in 4 main paths to identify the regions, from where the events preferentially originated (Fig. 16). The statistical treatment consists of clustering
10
the trajectories with the lower spatial variance. Initially all trajectories are considered independent clusters (as many clusters as trajectories), consecutive passes will group the two clusters with the absolute lowest spatial variance, repeating this iteration as many times as trajectories to finally calculate only one cluster and calculating a total spatial variance (TSV) at each step. The optimal number of clusters is finally chosen
15
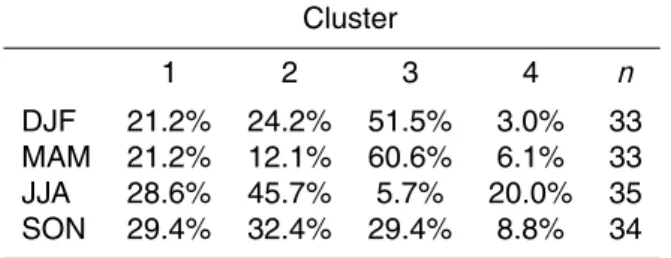
arbitrarily observing when the TSV approached a flat maximum. For further details visit the Hysplit website (http://ready.arl.noaa.gov/HYSPLIT.php). After running the cluster analysis an optimal number of 4 clusters was recognized (Fig. 16). The most common direction (cluster 3) is found at around 55◦S (47%), followed by two southern clusters
(1 and 2) that together gather almost 40% of all events originating south of latitude
20
60◦S (Bellingshausen Sea). The seasonal distribution (Table 6) of the clusters reveals
a migration pattern with a preferential South Pacific origin (cluster 3) in summer (DJF) and autumn (MAM), and preferential Bellingshausen Sea direction (cluster 2) in winter (JJA) and spring (SON). Later the clusters were combined with the stable water iso-tope information to identify difference in the composition of precipitation events under
25
the influence of different sources. As seen in Table 7, both northern clusters (3 and 4) are composed by events with less negativeδ18O (δD) and tending to lowerdexcess
TCD
5, 951–1001, 2011Stable water isotopes of precipitation and
firn cores
F. Fernandoy et al.
Title Page
Abstract Introduction
Conclusions References
Tables Figures
◭ ◮
◭ ◮
Back Close
Full Screen / Esc
Printer-friendly Version Interactive Discussion
Discussion
P
a
per
|
Dis
cussion
P
a
per
|
Discussion
P
a
per
|
Discussio
n
P
a
per
|
pressures. In contrast, the cluster 3 is associated with higher temperatures and pres-sure. Cluster 4, the less common, represents especially high pressures containing all trajectories with an east component occurring most frequently in winter. This could reflect some influence of continental moisture or katabatic winds; however this is not reflected in the isotopic composition. Finally two main origins of the air parcels arriving
5
at O’Higgins can be concluded: one between latitudes 50◦S and 60◦S (South Pacific),
representing the most common one; and a second origin south of the latitude 60◦S
(Bellingshausen-Amundsen Sea).
6 Conclusions
Our results demontrate that the combination of stable water isotope analyses with
dif-10
ferent meteorological data sets offer a valuable proxy for paleo-climate reconstruction in the north Antarctic Peninsula region. Undoubtedly, this task has been correctly rec-ognized by previous studies as a complicated one (King and Comiso, 2003; Sime et al., 2009). Nonetheless, isotope analysis (δ18O andδD) of precipitation samples collected in a daily schedule during 14 months (2008 to 2009) from Frei and O’Higgins stations
15
at the northern Antarctic Peninsula, highly reflect the meteorological variability of the region. The second order parameterdexcesscalculated for all samples, shows to be a good indicator of air temperature variability and single extreme meteorological events (elevateddexcessvalues). Moreover, mean monthlyδ18O anddexcessvalues highly cor-relate with the air temperature oscillations. We calculated temperature gradients of
20
0.41‰◦C−1 (r
=0.8) and 0.59‰◦C−1 (r
=−0.74) for δ18O and dexcess, respectively. Several firn cores extracted from the ice caps adjacent to both stations were examined in order to study the implication of the precipitation data for the firn/ice core interpreta-tion. From visual inspection and isotope analyses it is evident that all cores retrieved below 600 m a.s.l. show evidence for percolation and refreezing due to summer melt.
25
TCD
5, 951–1001, 2011Stable water isotopes of precipitation and
firn cores
F. Fernandoy et al.
Title Page
Abstract Introduction
Conclusions References
Tables Figures
◭ ◮
◭ ◮
Back Close
Full Screen / Esc
Printer-friendly Version Interactive Discussion
Discussion
P
a
per
|
Dis
cussion
P
a
per
|
Discussion
P
a
per
|
Discussio
n
P
a
per
|
stronger influence of maritime conditions at coastal zones. Theδ18O from firn cores does not capture well the local seasonal temperature fluctuation, as a consequence of the low seasonal temperature oscillation (σair=3.6◦C) and local post depositional
effects. On the other hand the dexcess, since it does not depend on the local condi-tions exhibit a much better seasonality, thus allowing the dating of firn accumulated at
5
this region. The synchronicity ofdexcess and air temperature implies a local moisture source for the precipitation arriving at this region. Low absolutedexcessvalues indicate a moisture source with typical oceanic characteristics with an estimated mean relative humidity of 87%, according to the relationship calculated by Uemura et al. (2008). A backward trajectory analysis (3 days backward) of all registered precipitation events
10
show that the air masses follow two main paths before snow and/or rain falls: one from the South Pacific (50◦S–60◦S) and a second one from the Bellingshausen-Amundsen
Sea (south of 60◦S); the first occurring preferentially in summer-autumn and the
sec-ond in winter-spring. Correspsec-ondingly the northern path shows more positiveδ18O and lowerdexcess values, confirming that both parameters are sensitive to changes in the
15
moisture source region. Hence, stable isotope time series of the firn cores were com-pared to different meteorological variables such as: SST,h,Tair, and SIF. The dexcess
show a strong correlation to humidity and sea surface temperature of the surrounding ocean (r=−0.7 to−0.8 for both parameters); as well as a correlation to the sea ice
cover is observed (r=0.5 to 0.7), explained by the influence of sea ice directly on the
20
air temperature and ocean-atmosphere interaction. Finally, the core retrieved at the Laclavere Plateau (1030 m a.s.l.), which was explored for the first time in 2010, repre-sents very promising conditions for future glaciological investigations: restricted melt evidence of firn and snow, a high accumulation rate which ensures that a high resolu-tion archive is stored in the ice cover, as well as low MAAT of this area estimated to be
25
around−10◦C. In this paper we show the potential of the stable water isotope for the
TCD
5, 951–1001, 2011Stable water isotopes of precipitation and
firn cores
F. Fernandoy et al.
Title Page
Abstract Introduction
Conclusions References
Tables Figures
◭ ◮
◭ ◮
Back Close
Full Screen / Esc
Printer-friendly Version Interactive Discussion
Discussion
P
a
per
|
Dis
cussion
P
a
per
|
Discussion
P
a
per
|
Discussio
n
P
a
per
|
Acknowledgements. We thank the generous scientific and logistic support of several institu-tions to this investigation. The Instituto Ant ´artico Chileno (INACH) is specially acknowledged for their support in the field, the Chilean Air Force, Chilean Army, and the Chilean Meteoro-logical Service (DMC) are thanked for their logistical organization and effort, as well as the Uruguayan station Artigas and the Instituto Ant ´artico Uruguayo (IAU). We would like to express
5
our gratitude to M. R ¨uckamp, S. Suckro, T. Kleiner and J. Sobiech, as well as the crew of the stations for their collaboration in the field work. Cindy Springer and Lutz Sch ¨onicke are thanked for the measurements carried out in the laboratory, as well as Mar Cartr ´o for helping to process the data. Financial support was obtained from the DFG Project 444CHL-113/40/0-1, and the University of Concepci ´on (Chile) DIUC internal scholarship. The PhD fellowship awarded to
10
F. Fernandoy by the German Academic Exchange Service (DAAD) is gratefully acknowledged. We thank finally H. Oerter, T. Opel and G. Casassa for their constructive comments to this manuscript.
References
Abram, N. J., Thomas, E. R., McConnell, J. R., Mulvaney, R., Bracegirdle, T. J., Sime, L. C., and
15
Aristarain, A. J.: Ice core evidence for a 20th century decline of sea ice in the Bellingshausen Sea, Antarctica, J. Geophys. Res., 115, D23101, doi:10.1029/2010jd014644, 2010.
Blindow, N., Suckro, S., R ¨uckamp, M., Braun, M., Schindler, M., Breuer, B., Saurer, H., Simoes, J., and Lange, M.: Geometry and thermal regime of the King George Island ice cap, Antarc-tica, from GPR and GPS, Ann. Glaciol., 51, 103–109, 2010.
20
Bracegirdle, T. J., Connolley, W. M., and Turner, J.: Antarctic climate change over the twenty first century, J. Geophys. Res., 113, 1–13, doi:10.1029/2007JD008933, 2008.
Carrasco, J. and Gonz ´alez, M. (Eds.): Climatolog´ıa de la Pen´ınsula Ant ´artica y de la Base Presidente Eduardo Frei Montalva, Direcci ´on Meteorol ´ogica de Chile, 2007.
Carrasco, J. F., Bromwich, D. H., and Monaghan, A. J.: Distribution and characteristics of
25
mesoscale cyclones in the Antarctic: Ross Sea eastward to the Weddell Sea, Mon. Weather Rev., 131, 289–301, 2003.
TCD
5, 951–1001, 2011Stable water isotopes of precipitation and
firn cores
F. Fernandoy et al.
Title Page
Abstract Introduction
Conclusions References
Tables Figures
◭ ◮
◭ ◮
Back Close
Full Screen / Esc
Printer-friendly Version Interactive Discussion
Discussion
P
a
per
|
Dis
cussion
P
a
per
|
Discussion
P
a
per
|
Discussio
n
P
a
per
|
Chen, J. L., Wilson, C. R., Blankenship, D., and Tapley, B. D.: Accelerated Antarctic ice loss from satellite gravity measurements, Nat. Geosci., 2, 859–862, 2009.
Clark, I., Fritz, P., Stein, J., and Starkweather, A. (Eds): Environmental Isotopes in Hydrogeol-ogy, Lewis, Boca Raton, New York, 311 pp., 1997.
Cook, A. J., Fox, A. J., Vaughan, D. G., and Ferrigno, J. G.: Retreating Glacier
5
Fronts on the Antarctic Peninsula over the Past Half-Century, Science, 308, 541–544, doi:10.1126/science.1104235, 2005.
Craig, H.: Isotopic variations in meteoric waters, Science, 133, 1702–1703,
doi:10.1126/science.133.3465.1702, 1961.
Dansgaard, W.: Stable isotopes in precipitation, Tellus, 16, 436–468,
doi:10.1111/j.2153-10
3490.1964.tb00181.x, 1964.
De Angelis, H. and Skvarca, P.: Glacier Surge After Ice Shelf Collapse, Science, 299, 1560– 1562, doi:10.1126/science.1077987, 2003.
Draxler, R. R. and Hess, G. D.: An Overview of the HYSPLIT-4 modelling system for trajectories, dispersion and deposition, Aust. Meterol. Mag., 47, 295–308, 1998.
15
HYSPLIT (HYbrid Single-Particle Lagrangian Integrated Trajectory): Model access via NOAA ARL READY, NOAA Air Resources Laboratory, Silver Spring, MD, http://www.arl.noaa.gov/ ready/hysplit4.html, last access: 2010.
Gat, J. R.: Oxygen and hydrogen isotopes in the hydrological cycle, Annu. Rev. Earth Pl. Sci., 24, 225–262, doi:10.1146/annurev.earth.24.1.225, 1996.
20
Gillett, N., Kell, T. D., and Jones, P. D.: Regional climate impacts of the Southern Annular Mode, Geophys. Res. Lett., 33, 1–4, 2006.
Gillett, N. P., Stone, D. A., Stott, P. A., Nozawa, T., Karpechko, A. Y., Hegerl, G. C., Wehner, M. F., and Jones, P. D.: Attribution of polar warming to human influence, Nat. Geosci., 1, 750–754, 2008.
25
Hall, B.: Holocene glacial history of Antarctica and the sub-Antarctic islands, Quat. Sci. Rev., 28, 2213–2230, 2009.
Hines, K. M., Bromwich, D. H., and Marshall, G. J.: Artificial surface pressure trends in the NCEP-NCAR reanalysis over the southern ocean and Antarctica, J. Climate, 13, 3940–3952, 2000.
30
GNIP Database.: http://www-naweb.iaea.org/napc/ih/index.html, last access: 2010.
TCD
5, 951–1001, 2011Stable water isotopes of precipitation and
firn cores
F. Fernandoy et al.
Title Page
Abstract Introduction
Conclusions References
Tables Figures
◭ ◮
◭ ◮
Back Close
Full Screen / Esc
Printer-friendly Version Interactive Discussion
Discussion
P
a
per
|
Dis
cussion
P
a
per
|
Discussion
P
a
per
|
Discussio
n
P
a
per
|
doi:10.1029/2000gl012815, 2002.
IPCC, Solomon, S., Qin, D., Manning, M., Chen, Z., Marquis, M., Averyt, K. B., Tignor, M., and Miller, H. (Eds.): Climate Change 2007: The Physical Science Basis. Contribution of Working Group I to the Fourth Assessment Report of the Intergovernmental Panel on Climate Change, Cambridge University Press, Cambridge, United Kingdom and New York, USA,
5
2007.
Isaksson, E., Landais, A., Helsen, M. M., Hoffmann, G., Lopez, J., Morgan, V., Motoyama, H., Noone, D., Oerter, H., Petit, J. R., Royer, A., Uemura, R., Schmidt, G. A., Schlosser, E., Simoes, J. C., Steig, E. J., Stenni, B., Stievenard, M., van den Broeke, M. R., van de Wal, R. S. W., van de Berg, W. J., Vimeux, F., and White, J. W. C.: A Review of Antarctic Surface
10
Snow Isotopic Composition: Observations, Atmospheric Circulation, and Isotopic Modeling, J. Climate, 21, 3359–3387, 2008.
Jouzel, J. and Merlivat, L.: Deuterium and Oxygen 18 in Precipitation: Modeling of the Isotopic Effects during Snow Formation, J. Geophys. Res.-Atmos., 89, 1749–1757, 1984.
Kalnay, E., Kanamitsu, M., Kistler, R., Collins, W., Deaven, D., Gandin, L., Iredell, M., Saha,
15
S., White, G., Woollen, J., Zhu, Y., Leetmaa, A., Reynolds, R., Chelliah, M., Ebisuzaki, W., Higgins, W., Janowiak, J., Mo, K. C., Ropelewski, C., Wang, J., Jenne, R., and Joseph, D.: The NCEP/NCAR 40-Year Reanalysis Project, B. Am. Meteorol. Soc., 77, 437–471, doi:10.1175/1520-0477(1996)077<0437:TNYRP>2.0.CO;2, 1996.
Kanamitsu, M.: Description of the NMC Global Data Assimilation and Forecast System, Weath.
20
Forecast., 4, 335–342, doi:10.1175/1520-0434(1989)004<0335:DOTNGD>2.0.CO;2, 1989. King, J. C. and Comiso, J. C.: The spatial coherence of interannual temperature variations in
the Antarctic Peninsula, Geophys. Res. Lett., 30, 1040, doi:10.1029/2002gl015580, 2003. Legrand, M. and Mayewski, P.: Glaciochemistry of polar ice cores: A review, Rev. Geophys.,
35, 219–243, 1997.
25
Levitus, S., Antonov, J., and Boyer, T.: Warming of the world ocean, 1955–2003, Geophys. Res. Lett., 32, L02604, doi:10.1029/2004gl021592, 2005.
Marshall, G. J.: Trends in the Southern Annular Mode from observations and Reanalyses, J. Climate, 16, 4134–4143, 2003.
Marshall, G. J., Orr, A., van Lipzig, N. P. M., and King, J. C.: The Impact of a Changing Southern
30
Hemisphere Annular Mode on Antarctic Peninsula Summer Temperatures, J. Climate, 19, 5388–5404, 2006.