Gene Flow within and between Catchments in the
Threatened Riparian Plant
Myricaria germanica
Silke Werth1,2*, Christoph Scheidegger1
1Swiss Federal Research Institute WSL, Birmensdorf, Switzerland,2University of Iceland, Dept. Life- and Environmental Sciences, Reykjavik, Iceland
Abstract
One of the major distinctions of riparian habitats is their linearity. In linear habitats, gene flow is predicted to follow a one-dimensional stepping stone model, characterized by bidirectional gene flow between neighboring populations. Here, we studied the genetic structure ofMyricaria germanica, a threatened riparian shrub which is capable of both wind and water dispersal. Our data led us to reject the ‘one catchment – one gene pool’ hypothesis as we found support for two gene pools, rather than four as expected in a study area including four catchments. This result also implies that in the history of the studied populations, dispersal across catchments has occurred. Two contemporary catchment-crossing migration events were detected, albeit between spatially proximate catchments. Allelic richness and inbreeding coefficients differed substantially between gene pools. There was significant isolation by distance, and our data confirmed the one-dimensional stepping-stone model of gene flow. Contemporary migration was bidirectional within the studied catchments, implying that dispersal vectors other than water are important forM. germanica.
Citation:Werth S, Scheidegger C (2014) Gene Flow within and between Catchments in the Threatened Riparian PlantMyricaria germanica. PLoS ONE 9(6): e99400. doi:10.1371/journal.pone.0099400
Editor:Giovanni G. Vendramin, CNR, Italy
ReceivedJanuary 1, 2012;AcceptedMay 14, 2014;PublishedJune 16, 2014
Copyright:ß2014 Werth, Scheidegger. This is an open-access article distributed under the terms of the Creative Commons Attribution License, which permits unrestricted use, distribution, and reproduction in any medium, provided the original author and source are credited.
Funding:This study was funded by the Federal Office of the Environment, FOEN as part of the project ‘‘Integrated Rivermanagement’’ (07.0071.PJ/G473-0382). SW received funding in form of a Marie Curie IEF (‘Lichenomics’, grant number 302589), a program funded under the Seventh Framework Programme (FP7) of the European Commission. The funders had no role in study design, data collection and analysis, decision to publish, or preparation of the manuscript.
Competing Interests:The authors have declared that no competing interests exist.
* E-mail: [email protected]
Introduction
Riparian habitats host a rich assemblage of specialist plant species confined to floodplains [1]. Due to the degradation, loss and fragmentation of their natural habitats, many of the species specialized on riparian habitats have declined severely during the last centuries, leading to drastic reductions in population size or to local extinctions [2–4].
One of the important characteristics distinguishing riparian from other habitats is their linearity. Linear habitats may function as corridors, facilitating rapid movement of individuals and genes across a landscape [5]. Gene flow is an important process in riparian plant populations because the movement of genes through propagules and gametes ensures connectivity of upstream and downstream populations [6,7]. In plants, gene flow is mediated by seeds, vegetative propagules such as shoots, as well as pollen [8]. Hydrochory, the dispersal of propagules with the water flow of a river, is an important process promoting species richness of riparian habitats [1,9,10]. Water-dispersed propagules are exclu-sively distributed downstream, and within a given catchment. Alternatively, transport of propagules is possible via animal vectors (zoochory) or wind (anemochory) [11]; these vectors can transport propagules upstream and downstream. In insect and wind pollinated species, gene flow via pollen can occur both in upstream and in downstream direction along a river, and across catchments. In plants, quantifying migration is a notoriously difficult task, because it is often not possible to observe the dispersal of propagules directly [8,12,13]. However, contemporary migration can be assessed using assignment tests that rely on population genetic data [14,15]. These tests identify which individuals are
migrants, and from which population they derive or, alternatively, if they originate from outside of the sampled populations. Knowing the source population of a migrant allows assessing the directionality of gene flow – e.g. if it is mainly directed downstream or if there is some upstream migration.
The various ways for migration to occur in plant populations allow us to test an explicit hypothesis on gene flow. Our first hypothesis states that gene flow is mainly directed downstream, as expected if hydrochory is the most important dispersal mode. Our alternative hypothesis is that gene flow should be bidirectional as predicted in a riparian species dispersed mainly by a combination of vectors including water, wind, and animals. We approached testing the null hypothesis by making use of migrate-n, a powerful software that allows the quantification of bidirectional migration rates and population sizes in a coalescent framework using Markov Chain Monte Carlo computing, and by quantifying contemporary migration with assignment tests using the software GeneClass2, which can be used to identify and assign first-generation migrants to source populations. In migrate-n, apart from testing upstream vs. downstream stepping-stone migration models, we tested whether populations in a catchment were consistent with a single panmictic population. Last but not least, we tested whether there was statistical support for an island model (gene flow bidirectional and occurring between all populations).
Our second hypothesis relates to the spatial distribution of gene pools in multiple catchments. We hypothesize that in a plant species dispersed via water, there should be genetic divergence between populations from different catchments because the crossing of catchments would not be feasible with this dispersal
vector. Hence, if the populations of a riparian plant in multiple catchments have remained isolated over many generations, each catchment should be populated by its unique gene pool (‘one catchment – one gene pool’ hypothesis). Alternatively, gene flow by other vectors than water would lead to the spatial distribution of gene pools across multiple catchments.
Our third objective was to explore patterns of genetic diversity across space and between genetic clusters. We hypothesized that genetic diversity should be related to elevation, with highest diversity in downstream sites as a consequence of seed dispersal with water. Moreover, in agreement with population genetic theory, larger populations should harbor more genetic diversity than smaller populations and downstream populations could be larger owing to the immigration of individuals from upstream sites. Finally, we analyzed the mating system using population-specific inbreeding coefficients [16]. Mating system is an important factor influencing population subdivision and genetic diversity of plant populations [8]. The inbreeding coefficient of an individual relative to that of its subpopulation (FIS) provides important insight into the mating system. Genetic diversity of populations may be influenced by mating system. If local population size has remained small over several generations, selfing leads to an increased frequency of homozygous individuals and may lead to a loss of rare alleles over time due to random sampling effects. Here, we tested specifically whether there wasi) a relationship between
FISand affiliation to gene pool, andii) whether high-elevation sites
exhibited a different level of inbreeding than low-elevation sites. Our fourth hypothesis concerned isolation by distance [17]. Stream habitats are linear environments and the movement of propagules should occur in a linear fashion, i.e. along one dimension in space [18]. A one-dimensional stepping-stone model does accurately describe gene flow in such systems. The stepping-stone model is characterized by gene flow upstream and downstream between neighboring populations. Based on simula-tions, Slatkin demonstrated that the slope of the regression of log10 ofMM^ (gene flow) over log10of geographic distance should be about 21.0, if gene flow occurs mainly in one dimension in space, as expected in linear habitats [19]. In contrast, in the case of two-dimensional gene flow, the slope of the regression is expected to be circa 20.3. The intercept of the regression can be utilized to estimate the effective number of migrants Nm, which can be interpreted as neighborhood size [19].
Myricaria germanica(Tamaricaceae) is a threatened riparian shrub growing on gravel banks along rivers. In Central Europe, this character plant of riparian vegetation [20,21] has declined severely owing to habitat loss associated with river channelization and gravel extraction during the past century [22]. The species requires habitats which are flooded not more frequently than every seven years [23], and it is a habitat specialist requiring dynamic, braided rivers. Details of the mating system in this insect-pollinated, hermaphroditic plant are not known, but another species of the genusMyricariais able to self [24].
Here, we used population genetic analyses of a large dataset of microsatellite genotypes to understand regional patterns of gene flow and genetic diversity inM. germanica, and to determine which model of migration fits this species best in catchments of major rivers in Switzerland.
Results
Directionality of gene flow
Analysis of contemporary migration based on first-generation migrants using the software GeneClass2 revealed a number of first-generation migrants within the Inn and Rhine catchments,
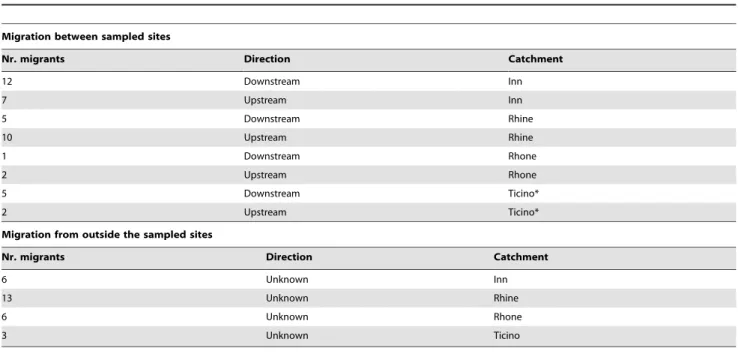
with migration being directed both upstream and downstream (Table 1). The number of migration events did not differ significantly between upstream and downstream direction, as assessed with a one-sided, paired Student’st-test assuming unequal variance among groups (t= 0.2255, df = 3, p= 0.42; mean upstream: 5.25; mean downstream: 5.75).
Model selection based on natural logarithmic Bayes Factors in analysis of recent migration with Migrate-n gave support for migration being directed downstream in a stepping-stone fashion in the Rhine catchment (Table 2). For the Maggia and Rhone catchments, downstream models of gene flow did not converge, even if they were run tenfold longer (data not shown), indicating poor model fit. Hence, downstream models were not considered for calculating Bayes Factors. For the the Inn, Maggia, and Rhone catchments, panmixia was inferred based on Bayes factors.
Population subdivision and spatial distribution of gene pools
Our data exhibited a high amount of genetic differentiation between populations. Analysis of molecular variance revealed significant genetic structure due to the grouping of sites by river (31.9% of total variance, Table 3). There was also significant variance due to populations within groups, and individuals within populations. Bayesian analysis of population structure revealed two distinct gene pools (‘clusters’) in the four catchments of our study area (Fig. 1B). Cluster 1 was frequent in Rhine, Rhone, and Ticino catchments, but rare in the Inn catchment. Cluster 2 occurred mainly in the Inn catchment, with single occurrences in the Ticino (MA¨ I1) and Rhine (SEN1) catchments.
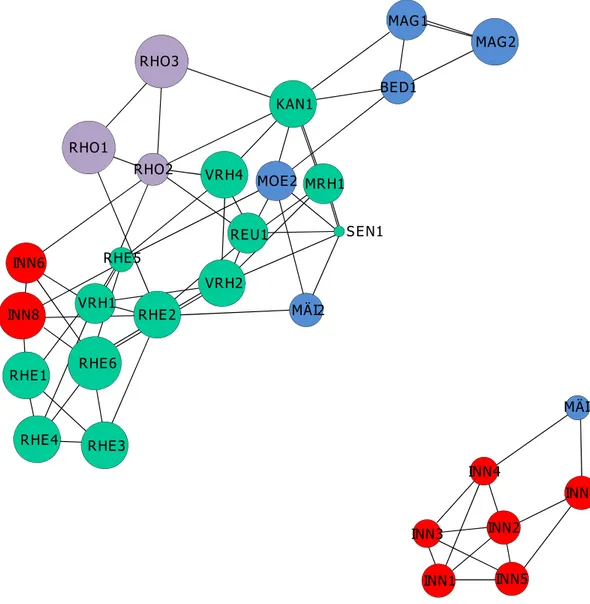
The population graph approach revealed two disconnected subnetworks which represented the same groups of individuals detected with Bayesian analysis of population structure (Fig. 2), thus refuting the ‘one catchment, one gene pool’ hypothesis. The first subnetwork comprised seven sites within the Inn catchment and one spatially proximate site (MA¨ I1) situated in the Ticino catchment. However, two of the sites belonging to the Inn catchment at the border to Austria belonged to the second subnetwork, same as in Bayesian analysis of population structure. Sites situated within the Rhine catchment were well connected to other sites, whereas most sites from the Rhone and Ticino catchments exhibited rather few links to other sites (Fig. 2).
In agreement with the results from Bayesian analysis of population structure and population graphs, analysis of pairwise
FST values showed that the average FST was higher between (average = 0.72; minimum = 0.55, maximum = 0.97) than within clusters (Cluster1, average = 0.51; Cluster 2, average = 0.24). Within Cluster 1, FST values ranged from 0.01 to 0.98; within Cluster 2, they ranged from 0 to 0.44.
Geographic patterns of genetic diversity and inbreeding
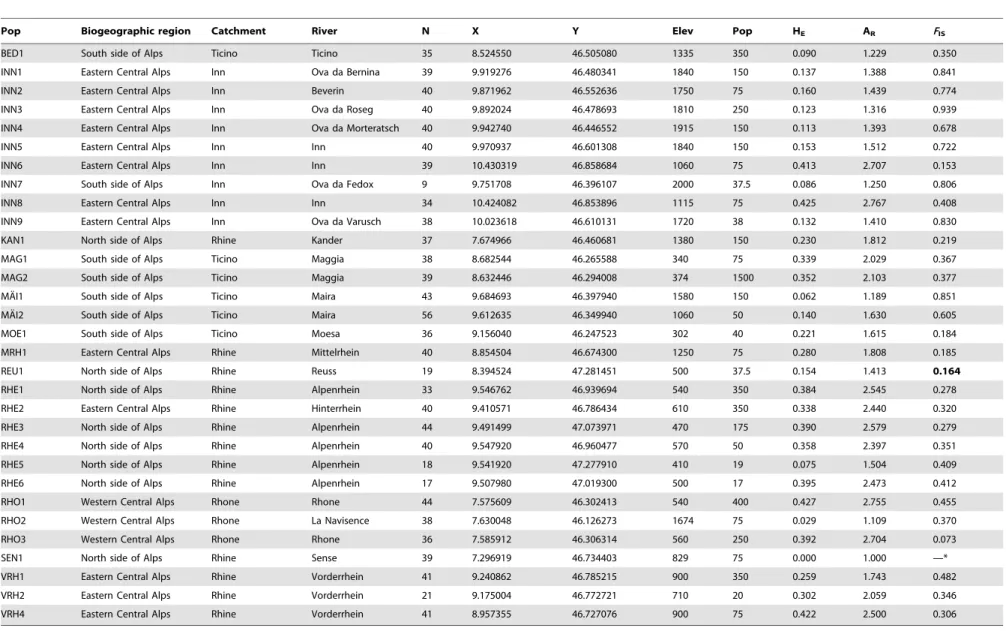
Properties of the collecting sites including their allelic richness and inbreeding coefficients are given in Table 4. In the 31 populations analyzed across an elevation gradient of 1660 m, Nei’s gene diversity ranged from 0 to 0.427, and mean allelic richness from 1 to 2.767.
A clear geographic trend in allelic richness was visible in our data: Populations located in the Engadine, the valley of the river Inn in southeastern Switzerland had lower allelic richness than populations from other regions (Fig. 3). These sites formed a separate gene pool (Cluster 2), as determined from Bayesian analysis of population structure.
significant relationship between elevation and allelic richness: high-altitude populations of M. germanica had lower genetic diversity than low or middle altitude populations (Fig. 3A,
Table 3). However, this relationship was most likely the effect of confounding, i.e. the low-diversity Cluster 2 populations occurring at high elevations, which showed a higher level of inbreeding Table 1.Analysis of contemporary migration within and among catchments (software GeneClass2).
Migration between sampled sites
Nr. migrants Direction Catchment
12 Downstream Inn
7 Upstream Inn
5 Downstream Rhine
10 Upstream Rhine
1 Downstream Rhone
2 Upstream Rhone
5 Downstream Ticino*
2 Upstream Ticino*
Migration from outside the sampled sites
Nr. migrants Direction Catchment
6 Unknown Inn
13 Unknown Rhine
6 Unknown Rhone
3 Unknown Ticino
*In addition, one event between catchments (from Inn to Ticino).
The table gives the number of migrants and the direction of migration in each catchment, assessing migration between the sampling sites and listing migrants that had a high likelihood to originate from outside of the sampled sites.
doi:10.1371/journal.pone.0099400.t001
Table 2.Log Bayes factors and model parameters from analysis of migration (software Migrate-n) in the riparian shrubMyricaria germanicacollected from four catchments in Switzerland.
Bayes Factors (LBF)
Catchment Full Step bidir Downstream Step downst Panmixia
Inn 25,788,873 23,493,117 2688,498 2786,023 0***
Maggia 2314,121 — NC — 0***
Rhine 26,003,175 2735,991 211,927 0*** 2182,051
Rhone 2412,522 — NC — 0***
Model parameters
Catchment Migration rate Population size
Inn — 1625.3
Maggia — 566.9
Rhine M1R2 8.2 Pop1 550.2
M2R3 36.1 Pop2 150.3
M3R4 30.4 Pop3 416.9
Pop4 250.3
Rhone — 991.9
Bayes Factors were constructed in comparison with the model with the largest log likelihood (Bayes Factor zero). Model probability was calculated by dividing the marginal likelihood of a given model by the sum of the marginal likelihoods of all models. Model probabilities:
*0.01,si,0.05; **0.05,si,0.10; ***0.95,si,1.00.
NC, no convergence of model, thus excluded for calculation of Bayes Factors. Migration rate estimates and population sizes of transformed data are shown in the lower panel. Populations were sorted in downstream order with increasing number, i.e. Pop1 was the most upstream. M1R2denotes the migration rate from population 1 to population 2.
doi:10.1371/journal.pone.0099400.t002
Gene Flow in Riparian Plant Populations
(Fig. 3C, Fig. 3G). As expected in a selfing plant, allelic richness decreased with increasing levels of inbreeding (Fig. 3D). There was no significant relationship between allelic richness and log-transformed population size (Fig. 3B).
The values of the inbreeding coefficientFISranged from low to high (0.072 to 0.939), indicating variation in mating system across sites (Table 4) and catchments (Fig. 3H). Sites belonging to Cluster 1 were consistent with a mixed (FIS= 0.15 to 0.48) or outcrossing mating system (FIS= 0.07). Sites belonging to Cluster 2 exhibited high inbreeding coefficients (FIS= 0.68 to 0.94, Table 4; Fig. 3G). There was no relationship betweenFISand census population size (Fig. 3F). We found a significant positive relationship of the population-specific inbreeding coefficient, FIS, with elevation, indicating that FIS and allelic richness covaried along the elevational gradient, but allelic richness decreased with elevation.
Isolation by distance
The Mantel test indicated that there was a significant relation between genetic, i.e. FST/(1-FST) and geographic distance (rM= 0.22, p = 0.001). Gene flow as estimated by the log10ofMM^ decreased with the log10of geographic distance d according to the equation log10(MM^) = 0.9320.74*log10(d) (Fig. 4). The slope of the relationship was consistent with the expectation under a one-dimensional stepping stone model (range of expected values:20.5 to21.5 versus20.5 to20.15 in a two-dimensional model [19]). Based on the intercept of the regression line, Nm (neighborhood size) was estimated to be 8.5 for our study species [19].
Discussion
Our data showed that contemporary gene flow inM. germanica
was bidirectional, whereas historic gene flow was directed downstream in the Rhine catchment. Our data rejected the ‘one catchment-one gene pool’ hypothesis, as a single genetic cluster was distributed across four catchments and another one across two. Population graph analysis showed that there were no connections between the two clusters found, highlighting their genetic isolation. Sites situated in the southeast of Switzerland were characterized by low diversity, high inbreeding coefficients,
and were differentiated from all remaining sites, belonging to a separate genetic cluster. Last but not least, our data showed significant isolation by distance, supporting a one-dimensional stepping-stone model.
Directionality of contemporary and historic gene flow
Contemporary gene flow, as estimated from analysis of first generation migrants based on assignment tests, took place mainly within catchments, with two exceptions where gene movement was detected between catchments in sites that were spatially proximate (from the Engadine to Bergell valley). Hence, dispersal between catchments is possible inM. germanica. Few other studies have found evidence for contemporary dispersal between catch-ments in riparian plant populations.
Moreover, contemporary gene flow occurred both in upstream and downstream direction in M. germanica. Also isolation by distance analysis supported bidirectional migration (see below). While migration events directed downstream are most likely to have arisen from hydrochory of seeds in combination with wind dispersal, upstream migration must have taken place either by wind or animals. It is unlikely that long-distance pollen dispersal events would have been reported as migrants, as the method only allowed detecting individuals with both gene copies in the source population.
Several studies have found support for either bidirectional gene flow or a source/sink scenario [7,25,26]. In the riparian shrub
Myricaria laxiflora, unidirectional gene flow downstream and considerable genetic differentiation between populations has been reported [24], suggesting that gene flow followed a source-sink model. In the aquatic macrophyte Sparganium emersum, an accumulation of genetic diversity in downstream populations was found, together with high differentiation between populations pointing towards source-sink population dynamics [27]. One study investigated the directionality of gene flow in three plant species along one river, and performed a meta-analysis of published studies [28]. No evidence for unidirectional gene flow was found, neither in any of the study species, nor in the metaanalysis. Our data show a different pattern than those of M. laxiflora, which Table 3.Analysis of molecular variance in populations of the threatened riparian shrubMyricaria germanica, grouping sites by river.
Source Df SS Varcomp Perc
Grouping by river
Between rivers 11 5484.4 2.041 31.9
Between sites within rivers 19 2668.8 1.947 30.4
Between individuals within sites 1083 3605.5 0.918 14.4
Between individuals 1114 1663.5 1.493 23.3
Total 2227 13422.2 6.399 100.0
F-statistic Value
FCT 0.319*
FSC 0.447*
FIS 0.381*
FIT 0.767*
The table gives the source of variability, the degrees of freedom, the sum of squares, the variance component, the percentage of variation, and the value of theF -statistic.
*, p,0.001.
showed evidence for linear, unidirectional migration via hydro-chory [24].
Contemporary migration was bidirectional. In contrast,historic gene flow was directed downstream in the largest catchment, Rhine. Contemporary and historic directionalities of gene flow may differ for several reasons. Historic gene flow reflects the main directionality of gene flow over a long time, and support for the directionality downstream does not mean that there have never been any events in the other direction. Individuals dispersed by the vectors wind/animals could have lower reproductive success in the
populations they are dispersed to, and then their genes may not be traced in historic signal. Moreover, we can not rule out that the importance of individual dispersal vectors may have changed over time. For example, it could well be that some dispersal events represent recent human-aided dispersal in the framework of conservation translocations, which would lead to a discrepancy among contemporary and historic directionalities.
Along three catchments, model selection in Migrate-n based on Bayes Factors provided evidence of panmixia. For the Inn catchment, this result seems plausible as genetic differentiation
Figure 1. Allelic richness and cluster affiliations of the studied sites ofMyricaria germanica(Tamaricaceae) in Switzerland.A. Allelic richness. The shading of the map shows biogeographic regions of Switzerland, as used in analysis of molecular variance. B. Results from Bayesian analysis of population structure. Map data: modified from Vector25ß2011 swisstopo (contract number 5704000000); biogeographic regions:
modified following data from BAFU, CH-3003 Bern, Switzerland. doi:10.1371/journal.pone.0099400.g001
Gene Flow in Riparian Plant Populations
between sites was generally low. For Rhone and Maggia, however, the result of panmixia is in conflict with the strong population subdivision evident fromFST values and AMOVA that is typical for selfing plant populations. Since the downstream models of gene flow did not converge in these two cases, we can not fully exclude the possibility that model selection in Migrate-n based on Bayes Factors inferred an erroneous model.
Our historic gene flow analysis highlights the importance of water and wind in seed dispersal for the Rhine catchment. Several other studies have emphasized the importance of seed dispersal via hydrochory in riparian and aquatic plants [1,10,27,29–34]. Wind may occasionally transport seeds over large distances, but long-distance dispersal events are not frequent [35–37]. A study of three riparian plants showed that in none of the species, gene flow was unidirectional [28]. In the sites we studied in Switzerland, contemporarily, wind or animal-mediated dispersal appears to be equally important as hydrochory.
Population subdivision and spatial distribution of gene pools
It is obvious from Bayesian analysis of population structure, analysis of molecular variance, population graphs, and from the contemporary pattern of migration that the sites sampled forM. germanicado not form a single continuous population. We found substantial population subdivision between and within rivers; this result is similar to what was found in other studies of riparian and aquatic shrubs or herbs [7,24,27,38–40]. Our study species exhibited far more population subdivision than two wind-pollinated riparian tree species [34,41]. We attribute this difference partly to efficient pollen dispersal by wind in these trees, increasing gene flow between populations. Moreover, trees have a larger release height of seeds than shrubs such as M. germanica, hence their capability for long-distance seed dispersal by wind should be greater [42–44]. The strong population structure
in M. germanica can likely be explained by frequent selfing. In selfing plant species, pollen dispersal is low, leading to population structure unless seed dispersal is highly efficient. Moreover, selfing reduces effective population size, thus increasing drift and leading to higher degrees of population subdivision [45].
Our data rejected the one-catchment, one gene pool hypothesis, under which we would have expected four genetic clusters to occur, each in one catchment. Instead, there were only two clusters, and the same cluster occurred in multiple catchments. None of the studies we examined for riparian and aquatic plant populations found support for the one-catchment, one gene pool hypothesis. Several studies reported multiple gene pools of riparian and aquatic plants in a single catchment [7,24,27,34]. A few studies have analyzed the spatial distribution of gene pools of riparian plants in multiple catchments. In two studies, gene pools of riparian plants were distributed across multiple catchments [39,40]. One of these studies reported that the spatial distribution of two gene pools of the riparian shrub Rhododendron ripense
corresponded to Pleistocene river systems [39], thus highlighting the importance of population history.
The spatial distribution of a single gene pool across multiple catchments in M. germanica implies that there must have been catchment-crossing dispersal events at some time in the history of Cluster 1, founding populations in different catchments. More-over, there must have been at least one historic dispersal event among catchments for Cluster 2 which also spans across two catchments in southeastern Switzerland.
Geographic patterns of genetic diversity
The arguably most striking pattern with respect to genetic diversity found in the data was the vast discrepancy in genetic diversity between Clusters 1 and 2. Cluster 2 sites located in the Engadine valley in southeastern Switzerland exhibited a far lower diversity than all remaining sites, with the notable exception of two (SEN1, RHO2).
Figure 2. Population graphs showing the genetic relationships between Myricaria germanica sites, with catchments shown in different colors (Inn: blue; Rhine, orange; Rhone, red; Ticino, yellow); the size of circles is proportional to effective population size.
Table 4.Summary statistics of the sites included in the analysis ofMyricaria germanica.
Pop Biogeographic region Catchment River N X Y Elev Pop HE AR FIS
BED1 South side of Alps Ticino Ticino 35 8.524550 46.505080 1335 350 0.090 1.229 0.350
INN1 Eastern Central Alps Inn Ova da Bernina 39 9.919276 46.480341 1840 150 0.137 1.388 0.841
INN2 Eastern Central Alps Inn Beverin 40 9.871962 46.552636 1750 75 0.160 1.439 0.774
INN3 Eastern Central Alps Inn Ova da Roseg 40 9.892024 46.478693 1810 250 0.123 1.316 0.939
INN4 Eastern Central Alps Inn Ova da Morteratsch 40 9.942740 46.446552 1915 150 0.113 1.393 0.678
INN5 Eastern Central Alps Inn Inn 40 9.970937 46.601308 1840 150 0.153 1.512 0.722
INN6 Eastern Central Alps Inn Inn 39 10.430319 46.858684 1060 75 0.413 2.707 0.153
INN7 South side of Alps Inn Ova da Fedox 9 9.751708 46.396107 2000 37.5 0.086 1.250 0.806
INN8 Eastern Central Alps Inn Inn 34 10.424082 46.853896 1115 75 0.425 2.767 0.408
INN9 Eastern Central Alps Inn Ova da Varusch 38 10.023618 46.610131 1720 38 0.132 1.410 0.830
KAN1 North side of Alps Rhine Kander 37 7.674966 46.460681 1380 150 0.230 1.812 0.219
MAG1 South side of Alps Ticino Maggia 38 8.682544 46.265588 340 75 0.339 2.029 0.367
MAG2 South side of Alps Ticino Maggia 39 8.632446 46.294008 374 1500 0.352 2.103 0.377
MA¨I1 South side of Alps Ticino Maira 43 9.684693 46.397940 1580 150 0.062 1.189 0.851
MA¨I2 South side of Alps Ticino Maira 56 9.612635 46.349940 1060 50 0.140 1.630 0.605
MOE1 South side of Alps Ticino Moesa 36 9.156040 46.247523 302 40 0.221 1.615 0.184
MRH1 Eastern Central Alps Rhine Mittelrhein 40 8.854504 46.674300 1250 75 0.280 1.808 0.185
REU1 North side of Alps Rhine Reuss 19 8.394524 47.281451 500 37.5 0.154 1.413 0.164
RHE1 North side of Alps Rhine Alpenrhein 33 9.546762 46.939694 540 350 0.384 2.545 0.278
RHE2 Eastern Central Alps Rhine Hinterrhein 40 9.410571 46.786434 610 350 0.338 2.440 0.320
RHE3 North side of Alps Rhine Alpenrhein 44 9.491499 47.073971 470 175 0.390 2.579 0.279
RHE4 North side of Alps Rhine Alpenrhein 40 9.547920 46.960477 570 50 0.358 2.397 0.351
RHE5 North side of Alps Rhine Alpenrhein 18 9.541920 47.277910 410 19 0.075 1.504 0.409
RHE6 North side of Alps Rhine Alpenrhein 17 9.507980 47.019300 500 17 0.395 2.473 0.412
RHO1 Western Central Alps Rhone Rhone 44 7.575609 46.302413 540 400 0.427 2.755 0.455
RHO2 Western Central Alps Rhone La Navisence 38 7.630048 46.126273 1674 75 0.029 1.109 0.370
RHO3 Western Central Alps Rhone Rhone 36 7.585912 46.306314 560 250 0.392 2.704 0.073
SEN1 North side of Alps Rhine Sense 39 7.296919 46.734403 829 75 0.000 1.000 —*
VRH1 Eastern Central Alps Rhine Vorderrhein 41 9.240862 46.785215 900 350 0.259 1.743 0.482
VRH2 Eastern Central Alps Rhine Vorderrhein 21 9.175004 46.772721 710 20 0.302 2.059 0.346
VRH4 Eastern Central Alps Rhine Vorderrhein 41 8.957355 46.727076 900 75 0.422 2.500 0.306
*Population monomorphic.
The table gives the population name, the number of samples analyzed, the GPS coordinates (map datum WGS84), elevation [m], the midpoint of the estimated interval of population size (Pop), gene diversity HE, allelic richness AR,
and the inbreeding coefficientFIS(non-significant value in bold).
doi:10.1371/journal.pone.0099400.t004
Gene
Flow
in
Riparian
Plant
Populati
ons
PLOS
ONE
|
www.ploson
e.org
7
June
2014
|
Volume
9
|
Issue
6
|
One result of interest is the vast discrepancy of inbreeding coefficients across sites, indicating geographic variation in mating system. A high level of inbreeding was inferred for sites belonging to Cluster 2 (Engadine). The only other species of Myricaria
investigated with population genetic approaches to date, M. laxiflora, was determined to be predominantly selfing in a study that used amplified fragment-length polymorphisms (AFLPs) to investigate genetic variability in populations of the Yangtze River in China [24]. Based on our data, we conclude thatM. germanica
has a mixed mating system, with frequent selfing. When doing hand-pollinations to make crosses of plants from different catchments (Inn vs. Rhine), a number of the progeny turned out to be selfed, rather than out-crossed (Werth & Scheidegger, unpublished data).
Contrary to the theoretical expectation [46], we found no evidence for a relationship between population census size and genetic diversity. Several other studies of riparian plants have
found the same pattern for riparian plants [7,24] and for riparian populations of a grassland plant [47]; some of these authors have interpreted this result as evidence for lack of regional equilibrium, as expected in a metapopulation. The genetic diversity of sites may reflect the mating system of a plant population: Low genetic diversity is expected for frequently inbreeding populations [48] such as those of selfing plants. Indeed, confirming this expectation, we found a significant negative relationship between allelic richness and FIS. Low genetic diversity could also result from recent changes in population size, e.g. bottlenecks or founder events after the colonization of new habitat patches [7,49].
We found significant relationships with elevation in allelic richness and FIS. Our linear models indicated that this effect is likely due to the confounding effect of the highly inbred, low-diversity Engadine sites being located at high elevations.
Figure 3. Allelic richness and population-specific inbreeding coefficients (FIS) of 20 nuclear SSR inMyricaria germanica. A and E.
Relationship with elevation. B and F. Relationship with log10-transformed census population size. D. Relationship between allelic richness andFIS. C and G. Boxplots of allelic richness, grouped by affiliation to genetic clusters (see Fig. 1B). H. Boxplots of FIS, grouped by affiliation to catchment. The values plotted for census population size are midpoints of the estimated intervals of population size. Lines represent linear regressions. Cluster 1: Rhine, Rhone, Ticino. Cluster 2: Inn.
Isolation by distance
We found statistical support for isolation by distance in the studied sites; genetic differentiation (pairwise standardized FST) followed a linear relationship with geographic distance as determined by a Mantel test. Most of the prior studies of riparian and aquatic plants did not find isolation by distance [7,27,33,34,50], a meta-analysis is presented in [28]. Only few studies found a significant relationship between genetic and geographic distance in riparian and aquatic plants [6,24,39]. For
the riparian herbAinsliaea faurieana, isolation by distance was only found when several catchments were analyzed in combination, but not within a single river [40]. In other studies, isolation by distance was found in only one of three studied species [28], or in one of three catchments [18].
Based on the regression of log10(MM^) on log10 of geographic distance, our data are consistent with a one-dimensional stepping-stone model, in which gene flow is bidirectional and occurs only Table 5.Linear regression models of allelic richness AR(response), inbreeding coefficientFIS(response), cluster affiliation,
elevation, and log10-transformed population size (log10.Pop.size).
Model Parameters df SS MS F p-value AIC
Model : AR,Cluster
Cluster 1 3.742 3.742 17.9 0.00021 43.3
Residuals 29 6.052 0.209
Model : AR,Elevation
Elevation 1 3.361 3.361 15.2 0.00054 45.2
Residuals 29 6.433 0.222
Model: AR,log10.Pop.size
Pop.size 1 0.269 0.268 0.8 0.37330 57.4
Residuals 29 9.525 0.328
Model : AR,Cluster+Elevation
Cluster 1 3.742 3.742 18.3 0.00020 43.6
Elevation 1 0.330 0.330 1.6 0.21410
Residuals 28 5.722 0.204
Model : AR,Elevation+Cluster
Elevation 1 3.361 3.361 16.4 0.00036 43.6
Cluster 1 0.711 0.711 3.5 0.07261
Residuals 28 5.722 0.204
Model: AR,log10.Pop.size+FIS
log10.Pop.size 1 0.220 0.220 1.0 0.32200 44.0
FIS 1 2.971 2.971 13.8 0.00095
Residuals 27 5.830 0.216
Model:FIS,Cluster
Cluster 1 1.369 1.369 103.7 6.44E-11 240.8
Residuals 28 0.370 0.013
Model:FIS,Elevation
Elevation 1 0.914 0.914 31.0 0.00584 216.7
Residuals 28 0.824 0.029
Model:FIS,log10.Pop.size
Pop.size 1 0.000 0.000 0.000 0.98740 5.7
Residuals 28 1.738 0.062
Model:FIS,Elevation+Cluster
Elevation 1 0.914 0.914 66.8 8,85E-09 238.8
Cluster 1 0.455 0.455 33.3 3,89E-06
Residuals 27 0.369 0.014
Model:FIS,Cluster+Elevation
Cluster 1 1.369 1.369 100.1 1,41E-10 238.8
Elevation 1 0.000 0.000 0.0 0.87200
Residuals 27 0.369 0.014
The table gives the degrees of freedom (df), the sum of squares (SS), mean square (MS), theF-value (F), the significance of the respective parameter (p-value) and Akaike’s information criterion (AIC).
doi:10.1371/journal.pone.0099400.t005
Gene Flow in Riparian Plant Populations
among neighboring populations [19]. The directionality of migration is consistent with the bidirectional contemporary migration revealed by assignment tests. However, the assignment tests revealed migration events that extended beyond neighboring populations.
Materials and Methods Study species
Myricaria germanicais a riparian shrub which occurs along natural and near-natural rivers in Europe and Asia. Maximum ages of 21 years [51] and 70 years [52] have been reported. The species’ natural world-wide distribution is restricted to mountainous regions of Europe and Asia, i.e. the Alps, Pyrenees, Scandes, Apennine, Carpathians, Caucasus, and Himalaya [53]. The Himalaya region is the centre of origin of the genus Myricaria, and harbours multiple species of the genus [54]. As the only species of its family naturally occurring in Switzerland (Tamarix
spp. are sometimes used as ornamental plants),M. germanicagrows on gravel banks along rivers from the colline to the subalpine altitudinal zone (500–2100 m). Being a pioneer species on gravel bars, M. germanica forms patchy populations, with frequent colonizations of new patches and extinction of existing populations after disturbance by flooding. When rivers are channelized in a way that suitable habitat, in particular sites with intermediate disturbance frequencies are lacking, the species can go locally extinct. Thus,M. germanicahas faced a severe decline in many of the major rivers of Europe in the past decades. Once a rather common species on the Swiss Plateau, the species is now restricted to a few sites in this region. In Switzerland,M. germanicais most common in the Southeast, i.e. the Cantons of Grison and Ticino (Fig. 1).
Study area, sampling design, and molecular analysis
Our sampling included 1114 samples collected from 31 sites situated in all geographic regions whereM. germanicais known to occur in Switzerland (Table 1, Fig. 1). The local density of sampling sites reflects the number of populations of the species in a particular catchment. Tissue samples were collected from the apical tips of branches without flowers, carefully avoiding to include seeds deposited on the plant, and stored on silica gel at room temperature until DNA extraction. In large populations, we sampled tissue from 40 adult plants along a transect through the population following the flow direction of the river, at a minimum distance of 2 m between subsequent plants. In small populations, tissue from all individuals was collected. In each population, we recorded GPS coordinates and estimated population size either by counting in small populations, or by counting individuals in a part of the area and extrapolating to the approximate total area; the latter estimates were given as intervals. Interval midpoints were used for regression analyses (see below).
No specific permits were required for the described field studies. The species we are working with, Myricaria germanica, is not protected in Switzerland, and therefore, no collecting permit was required. Moreover, we did not collect in the Swiss National Park, other protected areas, or on private land; hence, no permits were required for our field sampling.
DNA was extracted using the DNeasy 96 plant kit (Qiagen). PCR, fragment analyses, and genotyping of 20 nuclear microsat-ellites were performed as described in [55], excluding Mg461 and Mg482 from the set of 22 loci.
Data analysis
Gene diversity and allelic richness were calculated using FSTAT version 2.93; to map the values, allelic richness was averaged over the 20 nuclear microsatellites. Population-specific inbreeding
Figure 4. Log10(MM^) plotted against log10(geographic distance in km) for the threatened riparian shrubMyricaria germanicabased on samples from 31 sites in Switzerland.The linear regression equation used to plot the line was log10(MM^) = 0.9320.746log10(geographic
coefficients FIS and pairwise FST values were calculated with Arlequin version 3.5 [56].
We performed analysis of molecular variance in Arlequin. The
F-statistics in the AMOVA were based on the number of different alleles, and significance of variance components was tested with 1000 permutations [57]. For the hierarchical AMOVA model, populations were grouped according to the rivers they were collected at. We performed Bayesian analysis of population structure using an admixture model and correlated allele frequencies in Structure version 2.3.3 to define panmictic groups of individuals and to visualize the overall genetic structure in the data [58,59]. For each value of K M [1,5], we performed ten
replicate simulations using 100,000 iterations as burn-in, followed by 1 million iterations to sample the posterior distributions of parameters. Structure Harvester v. 0.6.8 [60] was utilized to calculate ‘DK’, the rate of change in the log probability of the data between successive K values. The K value at whichDK reaches its
maximum is the correct number of clusters [61]. For this value of K, we report the results from the run with highest log likelihood. In order to depict the genetic relationships between sites, we calculated population graphs in R using the package ‘gstudio’ [62], function ‘population.graph’. Based on graph theory, population graphs can be used to analyze how genetic variability is distributed across space by creating a network of the connections between sites. Nodes are created with size varying based on genetic variability within sites, and a network of connections is identified according to the genetic covariance between sites [63]. Population graphs allow evaluating hypotheses on gene flow between sites by an examination of graph topology. Groups of sites with restricted gene flow can be identified in population graphs from the specific connectivity among edges between groups of sites (e.g. discon-nected subnetworks or groups of sites with few connections to other groups of sites). Here, we used the population graph approach to test the hypothesis that groups of sites representing the four main catchments exhibited restricted gene flow. If this were true, we would expect to see four subnetworks representing catchments, each with no or few connections to other subnet-works.
To estimate contemporary migration patterns, we used an assignment method allowing to detect first-generation migrants implemented in the software GeneClass2 version 2.0 [15]. The test identified individuals that had a high probability of originating from another site (e.g. due to gene flow through seed dispersal). Since we had not sampled all potential source populations in the Inn and Rhine catchments, we assessed statistical significance based on the test statistic Lhome, the likelihood of drawing an individual’s genotype from the site where it was sampled, given the observed allele frequencies of all sites [14]. The test statistic was computed using Bayesian algorithm [64]. Assignment probabilities were calculated with Monte-Carlo resampling with 1000 permu-tations according to [14] using a threshold probability of 0.001.
To test specific models about the directionality of gene flow and to obtain Bayesian estimates of effective population sizes and bidirectional rates of migration in M. germanica, we used the coalescent-based software Migrate-n version 3.26 [65,66]. Mi-grate-n makes the following assumptions: i) constant population size through time or random fluctuation around an average size;ii) individuals are randomly mating within populations; iii) the mutation rate is constant through time and is the same in all parts of the genealogy;iv) the immigration rate is constant through time; and v) the studied populations exhibit a recent divergence and not an old split, so they exchange material through gene flow [67]. We ran Migrate-n to estimate migration rates among populations (all parameters free to vary) with one long MCMC
chain, sampling every 1000th step for a total of 200,000,000 genealogies after a burn-in of 200,000 steps in the chain. A Brownian motion model was used which approximates the stepwise mutation model commonly used for microsatellite data, but converges faster than the standard stepwise mutation model. Populations were randomly resampled to 100 individuals to speed up convergence. Starting parameters for population size h and
migration rates were inferred from FST values; mutation rate modifiers were deduced from the data using Watterson’sh. We
performed a series of preliminary runs to explore run conditions and prior distributions for the data from each catchment. Bayesian estimation of migration rate and population sizes were run with one long chain and static heating (temperatures of four Markov chains: 1, 1.5, 3, 10,000,000). The models compared were a full model with all migration rates and population sizes, a stepping-stone model with bidirectional gene flow between neighboring populations, a model where gene flow was directed downstream (but not restricted to neighboring populations), a stepping-stone model where migration occurred only downstream, and a panmictic model. Model selection was performed based on model probabilities and natural log Bayes factors, calculated as LBF = 2(lnmLm1-lnmLm2), with lnmLm1and lnmLm2being the log marginal likelihoods of model 1 and 2, respectively [68]. We used the marginal likelihoods computed by the Be´zier method for all calculations, as these provide precise estimates of marginal likelihoods [68]. LBF.2 suggests preference of model 1 over 2, LBF,22 suggests preference of model 2 [69]. Model probability was calculated by dividing the marginal likelihood of a given model by the sum of marginal likelihoods of all models [68,70]. We were only interested in the general direction of migration, i.e. whether upstream and downstream migration rates were substan-tially different, and thus, we pooled several upstream and downstream populations unless we had sampled few populations in a given catchment. The migration scenarios we could test depended on how many populations a catchment was grouped into. For example, catchments with only two populations allowed only the full, panmictic, and downstream models. As upstream migration (alone) appeared biologically not meaningful, we omitted this type of model. To speed up computation, we ran the parallel version of Migrate-n on a computer cluster using multiple (12–51) cores connected through message passing interface (OpenMPI) [67]. For the purpose of the Migrate-n analyses, the Inn catchment was subdivided into three populations representing upper, middle and lower Inn. The Maggia catchment included two populations. From the Rhone catchment, we omitted a population situated far away on a side river to simplify the models, leaving two populations in the catchment – one large population upstream, and one small population downstream. The Rhine catchment was subdivided into four populations, upper, upper middle, lower middle, and lower Rhine, numbered sequentially from upstream to downstream. Population sizes were transformed to real values by division by the inheritance scalar
6mutation rate, assuming an inheritance scalar of 4 for diploid nuclear data. The mutation rate of nuclear microsatellites is not known forM. germanica. We assumed a rate of 1023[71]; mutation rates for nuclear microsatellite loci range typically from 1022 to 1025 [72]. Migration rates were transformed by multiplication with the transformed population size of the receiving population. To identify the factors explaining genetic diversity in M. germanica, we calculated linear regression models of allelic richness and FIS (response variables), affiliation of population to clusters resulting from Bayesian analysis of population structure with software Structure, log10-transformed population size, and eleva-Gene Flow in Riparian Plant Populations
tion in R using the function ‘lm’ [73]. Nine models were compared according to Akaike’s information criterion, AIC [74].
Isolation by distance. Pairwise estimates of genetic distance are not statistically independent; thus, in this case, significance testing of genetic vs. geographic distance through linear regression is not reliable [18]. Hence, to test the significance of the relationship between genetic and geographic distance, we performed a Mantel test. The Mantel test [75] was performed in R using the function ‘mantel’ implemented in the ‘vegan’ package [76], using pairwise standardized FST values (FST/(12FST) and Euclidean geographic distance and Kendall’s rank correlation with 999 permutations.
If the genetic data follow a stepping stone model, gene flow should decrease with distance. More specifically, the log10 of the gene flow estimateMM^ should show a linear decrease with log10 -transformed geographic distance [19]. Simulation results indicate that in the case of gene flow in one dimension, the slope of the relationship should approximate 21.0, whereas in the two-dimensional case, the slope should approximate20.3 [19].
Acknowledgments
Logistic support was received from Genetic Diversity Centre (GDC) of ETH Zu¨rich, from WSL, and from University of Iceland. We thank A. Minder and T. Torrossi (GDC) for running fragment analyses on an automated sequencer. We are very grateful to B. Krummenacher who collected tissue samples from many populations included in this study. S. Cheenacharoen and Y. Kophimai helped with extracting DNA; C. Cornejo extracted DNA to establish the microsatellites; T. Karpati and C. Spinelli helped with field work. We acknowledge R. Dyer and P. Beerli who kindly supported us with performing the population graph and Migrate-n analyses, respectively. T. Wu¨st provided support for running analyses on the Hera computer cluster of WSL.
Author Contributions
Conceived and designed the experiments: SW CS. Performed the experiments: SW. Analyzed the data: SW. Contributed reagents/ materials/analysis tools: SW. Wrote the paper: SW CS.
References
1. Jansson R, Nilsson C, Renofalt B (2000) Fragmentation of riparian floras in rivers with multiple dams. Ecology 81: 899–903.
2. Busch DE, Smith SD (1995) Mechanisms associated with decline of woody species in riparian ecosystems of the Southwestern US. Ecological Monographs 65: 347–370.
3. Mu¨ller N, Scharm S (2001) The importance of seed rain and seed bank for the recolonisation of gravel bars in alpine rivers. Papers in commemoration of Prof Dr S Okuda’s retirement: Studies on the vegetation of alluvial plants. Yokohama. pp. 127–140.
4. Tockner K, Stanford JA (2002) Riverine flood plains: present state and future trends. Environmental Conservation 29: 308–330.
5. Tikka PM, Hogmander H, Koski PS (2001) Road and railway verges serve as dispersal corridors for grassland plants. Landscape Ecology 16: 659–666. 6. Imbert E, Lefe`vre F (2003) Dispersal and gene flow ofPopulus nigra(Salicaceae)
along a dynamic river system. Journal of Ecology 91: 447–456.
7. Tero N, Aspi J, Siikama¨ki P, Ja¨ka¨la¨niemi A, Tuomi J (2003) Genetic structure and gene flow in a metapopulation of an endangered plant species,Silene tatarica. Molecular Ecology 12: 2073–2085.
8. Silvertown JW, Charlesworth D (2001) Introduction to plant population biology. Oxford, UK: Blackwell Science. 210 p.
9. Jansson R, Nilsson C, Dynesius M, Andersson E (2000) Effects of river regulation on river-margin vegetation: A comparison of eight boreal rivers. Ecological Applications 10: 203–224.
10. Nilsson C, Brown RL, Jansson R, Merritt DM (2010) The role of hydrochory in structuring riparian and wetland vegetation. Biological Reviews 85: 837–858. 11. Clobert J, Danchin E, Dhondt AA, Nichols JD (2001) Dispersal. Oxford: Oxford
University Press. 452 p.
12. Bullock JM, Clarke RT (2000) Long distance seed dispersal by wind: measuring and modelling the tail of the curve. Oecologia 124: 506–521.
13. Ronce O (2001) Understanding plant dispersal and migration. Trends in Ecology and Evolution 16: 663–664.
14. Paetkau D, Slade R, Burden M, Estoup A (2004) Genetic assignment methods for the direct, real-time estimation of migration rate: a simulation-based exploration of accuracy and power Molecular Ecology13: 55–65.
15. Piry S, Alapetite A, Cornuet JM, Paetkau D, Baudouin L, et al. (2004) GENECLASS2: A software for genetic assignment and first-generation migrant detection. Journal of Heredity 95: 536–539.
16. Wright S (1950) Genetical structure of populations. Nature 166: 247–249. 17. Wright S (1943) Isolation by distance. Genetics 28: 114–138.
18. Markwith SH, Scanlon MJ (2007) Multiscale analysis ofHymenocallis coronaria (Amaryllidaceae) genetic diversity, genetic structure, and gene movement under the influence of unidirectional stream flow. American Journal of Botany 94: 151–160.
19. Slatkin M (1993) Isolation by distance in equilibrium and nonequilibrium populations. Evolution 47: 264–279.
20. Ellenberg H (1963) Vegetation Mitteleuropas mit den Alpen. Stuttgart: Eugen Ulmer.
21. Moor M (1958) Pflanzengesellschaften schweizerischer Flussauen. Mitteilungen/ Eidgeno¨ssische Anstalt fu¨r das Forstliche Versuchswesen 34: 221–360. 22. Endress PK (1975) Verbreitungsru¨ckgang vonMyricaria germanica Desv. und
Typha minimaHoppe auf der Alpennordseite Graubu¨ndens. Vierteljahrsschrift der Naturforschenden Gesellschaft in Zu¨rich 120: 1–14.
23. Alp M, Karpati T, Werth S, Gostner W, Scheidegger C, et al. (2011) Erhaltung und Fo¨rderung der Biodiversita¨t von Fliessgewa¨ssern. Wasser Energie Luft 103: 216–223.
24. Liu Y, Wang Y, Huang H (2006) High interpopulation genetic differentiation and unidirectional linear migration patterns inMyricaria laxiflora(Tamaricaceae), an endemic riparian plant in the Three Gorges valley of the Yangtze River. American Journal of Botany 93: 206–215.
25. Ja¨ka¨la¨niemi A, Tuomi J, Siikama¨ki P (2006) Conservation of species in dynamic landscapes: Divergent fates of Silene tataricapopulations in riparian habitats. Conservation Biology 20: 844–852.
26. Honnay O, Jacquemyn H, Van Looy K, Vandepitte K, Breyne P (2009) Temporal and spatial genetic variation in a metapopulation of the annual Erysimum cheiranthoideson stony river banks. Journal of Ecology 97: 131–141. 27. Pollux BJA, Luteijn A, Van Groenendael JM, Ouborg NJ (2009) Gene flow and
genetic structure of the aquatic macrophyte Sparganium emersum in a linear unidirectional river. Freshwater Biology 54: 64–76.
28. Honnay O, Jacquemyn H, Nackaerts K, Breyne P, Van Looy K (2010) Patterns of population genetic diversity in riparian and aquatic plant species along rivers. Journal of Biogeography 37: 1730–1739.
29. Jansson R, Zinko U, Merritt DM, Nilsson C (2005) Hydrochory increases riparian plant species richness: a comparison between a free-flowing and a regulated river. Journal of Ecology 93: 1094–1103.
30. Merritt DM, Nilsson C, Jansson R (2010) Consequences of propagule dispersal and river fragmentation for riparian plant community diversity and turnover. Ecological Monographs 80: 609–626.
31. Chen FQ, Xie ZQ (2007) Reproductive allocation, seed dispersal and germination ofMyricaria laxiflora, an endangered species in the Three Gorges Reservoir area. Plant Ecology 191: 67–75.
32. Pollux BJA, Verbruggen E, Van Groenendael JM, Ouborg NJ (2009) Intraspecific variation of seed floating ability inSparganium emersumsuggests a bimodal dispersal strategy. Aquatic Botany 90: 199–203.
33. Jacquemyn H, Van Looy K, Breyne P, Honnay O (2010) The Meuse river as a corridor for range expansion of the exotic plant speciesSisymbrium austriacum: evidence for long-distance seed dispersal. Biological Invasions 12: 553–561. 34. Hu LJ, Uchiyama K, Shen HL, Ide Y (2010) Multiple-scaled spatial genetic
structures of Fraxinus mandshurica over a riparian-mountain landscape in Northeast China. Conservation Genetics 11: 77–87.
35. Cain ML, Milligan BG, Strand AE (2000) Long-distance seed dispersal in plant populations. American Journal of Botany 87: 1217–1227.
36. Bullock JM, Shea K, Skarpaas O (2006) Measuring plant dispersal: an introduction to field methods and experimental design. Plant Ecology 186: 217–234.
37. He TH, Krauss SL, Lamont BB, Miller BP, Enright NJ (2004) Long-distance seed dispersal in a metapopulation of Banksia hookeriana inferred from a population allocation analysis of amplified fragment length polymorphism data. Molecular Ecology 13: 1099–1109.
38. Prentis PJ, Mather PB (2008) Fine-scale patterns of genetic variation indicate non-equilibrium gene frequency divergence in the stream lily, Helmholtzia glaberrima. Freshwater Biology 53: 973–980.
39. Kondo T, Nakagoshi N, Isagi Y (2009) Shaping of genetic structure along Pleistocene and modern river systems in the hydrochorous riparian azalea, Rhododendron ripense(Ericaceae). American Journal of Botany 96: 1532–1543. 40. Mitsui Y, Isagi Y, Setoguchi H (2010) Multiple spatial scale patterns of genetic
diversity in riparian populations ofAinsliaea faurieana(Asteraceae) on Yakushima Island, Japan. American Journal of Botany 97: 101–110.
across European river systems: Consequences for conservation and restoration. Forest Ecology and Management 255: 1388–1399.
42. Tackenberg O (2003) Modeling long-distance dispersal of plant diaspores by wind. Ecological Monographs 73: 173–189.
43. Andersen M (1991) Mechanistic models for the seed shadows of wind-dispersed plants. American Naturalist 137: 476–497.
44. Tackenberg O, Poschlod P, Bonn S (2003) Assessment of wind dispersal potential in plant species. Ecological Monographs 73: 191–205.
45. Pfenninger M, Salinger M, Haun T, Feldmeyer B (2011) Factors and processes shaping the population structure and distribution of genetic variation across the species range of the freshwater snailRadix balthica(Pulmonata, Basommato-phora). BMC Evolutionary Biology 11: 135.
46. Nei M (1987) Molecular evolutionary genetics. New York: Columbia University Press.
47. Van Looy K, Jacquemyn H, Breyne P, Honnay O (2009) Effects of flood events on the genetic structure of riparian populations of the grassland plantOriganum vulgare. Biological Conservation 142: 870–878.
48. Reed DH, Frankham R (2003) Correlation between fitness and genetic diversity. Conservation Biology 17: 230–237.
49. Schmidt K, Jensen K (2000) Genetic structure and AFLP variation of remnant populations in the rare plant Pedicularis palustris (Scrophulariaceae) and its relation to population size and reproductive components. American Journal of Botany 87: 678–689.
50. DeWoody J, Nason JD, Smith M (2004) Inferring demographic processes from the genetic structure of a metapopulation of Boltonia decurrens (Asteraceae). Conservation Genetics 5: 603–617.
51. Schweingruber FH, Mu¨nch A, Schwarz R (2007) Dendrochronologie von Kra¨utern und Stra¨uchern im Vorfeld des Morteratschgletschers. Bauhinia 20: 5– 17.
52. Frisendahl A (1921)Myricaria germanica(L.) Desv. Acta Florae Sueciae 1: 265– 304.
53. Hulte´n E, Fries M (1986) Atlas of North European vascular plants: north of the Tropic of Cancer I–III. Ko¨nigstein: Koeltz Scientific Books.
54. Liu Y, Wang Y, Huang H (2009) Species-level phylogeographical history of Myricariaplants in the mountain ranges of western China and the origin ofM. laxiflorain the Three Gorges mountain region. Molecular Ecology 18: 2700– 2712.
55. Werth S, Scheidegger C (2011) Isolation and characterization of 22 nuclear and 5 chloroplast microsatellite loci in the threatened riparian plant Myricaria germanica(Tamaricaceae, Caryophyllales). Conservation Genetics Resources 3: 445–448.
56. Excoffier L, Laval G, Schneider S (2005) Arlequin (version 3.0): An integrated software package for population genetics data analysis. Evolutionary Bioinfor-matics Online 1: 47–50
57. Excoffier L, Smouse PE, Quattro JM (1992) Analysis of molecular variance inferred from metric distances among DNA haplotypes: application to human mitochondrial DNA restriction data. Genetics 131: 479–491.
58. Pritchard J, Stephens M, Donnelly P (2000) Inference of population structure using multilocus genotype data. Genetics 155: 945–959.
59. Falush D, Stephens M, Pritchard J (2003) Inference of population structure using multilocus genotype data: linked loci and correlated allele frequencies. Genetics 164: 1567–1587.
60. Earl DA, von Holdt BM (2012) STRUCTURE HARVESTER: a website and program for visualizing STRUCTURE output and implementing the Evanno method. Conservation Genetics Resources 4: 359–361.
61. Evanno G, Regnaut S, Goudet J (2005) Detecting the number of clusters of individuals using the software STRUCTURE: a simulation study. Molecular Ecology 14: 2611–2620.
62. Dyer RJ, Nason JD (2004) Population Graphs: the graph theoretic shape of genetic structure. Molecular Ecology Notes 13: 1713–1727.
63. Sork VL, Davis FW, Westfall R, Flint A, Ikegami M, et al. (2010) Gene movement and genetic association with regional climate gradients in California valley oak (Quercus lobataNe´e) in the face of climate change. Molecular Ecology 19: 3806–3823.
64. Rannala B, Mountain JL (1997) Detecting immigration by using multilocus genotypes. Proceedings of the National Academy of Sciences of the United States of America 94: 9197–9201.
65. Beerli P, Felsenstein J (1999) Maximum-likelihood estimation of migration rates and effective population numbers in two populations using a coalescent approach. Genetics 152: 763–773.
66. Beerli P, Felsenstein J (2001) Maximum likelihood estimation of a migration matrix and effective population sizes in n subpopulations by using a coalescent approach. Proceedings of the National Academy of Sciences of the United States of America 98: 4563–4568.
67. Beerli P (2009) How to use MIGRATE or why are Markov chain Monte Carlo programs difficult to use? In: Bertorelle G, Bruford MW, Hauffe HC, Rizzoli A, Vernesi C, editors. Population Genetics for Animal Conservation. Cambridge UK: Cambridge University Press. pp. 42–79.
68. Beerli P, Palczewski M (2010) Unified framework to evaluate panmixia and migration direction among multiple sampling locations. Genetics 185: 313– U463.
69. Kass RE, Raftery AE (1995) Bayes factors. Journal of the American Statistical Association 90: 773–795.
70. Migrate-n tutorial: Comparison of gene flow models using Bayes Factors. Available: http://popgen.sc.fsu.edu/Migrate/Tutorials/Entries/2010/7/12_ Day_of_longboarding.html. Accessed 2013, July 5th
.
71. Goldstein DB, Pollock DD (1997) Launching microsatellites: A review of mutation processes and methods of phylogenetic inference. Journal of Heredity 88: 335–342.
72. Jarne P, Lagoda PJL (1996) Microsatellites, from molecules to populations and back. Trends in Ecology and Evolution 11: 424–429.
73. R Development Core Team (2013) R: A language and environment for statistical computing. Vienna, Austria: R Foundation for Statistical Computing. 74. Sakamoto Y, Ishiguro M, Kitagawa G (1986) Akaike Information Criterion
Statistics. Dordrecht: D. Reidel.
75. Mantel N (1967) The detection of disease clustering and a generalized regression approach. Cancer Research 27: 209–220.
76. Oksanen J, Blanchet FG, Kindt R, Legendre P, O’Hara RB, et al. (2010) The vegan package. URL: cran.r-project.org/web/packages/vegan/vegan.pdf.
Gene Flow in Riparian Plant Populations