NUMERICAL PREDICTION OF CAVITATING FLOW
AROUND A HYDROFOIL USING PANS AND IMPROVED
SHEAR STRESS TRANSPORT K-OMEGA MODEL
by
De-Sheng ZHANG *, Da-Zhi PAN, Hai-Yu WANG, and Wei-Dong SHI
Research Center of Fluid Machinery Engineering and Technology, Jiangsu University, Zhenjiang, China
Original scientific paper DOI: 10.2298/TSCI1504211Z
The prediction accuracies of partially-averaged Navier-Stokes model and im-proved shear stress transport k-ω turbulence model for simulating the unsteady cavitating flow around the hydrofoil were discussed in this paper. Numerical re-sults show that the two turbulence models can effectively reproduce the cavitation evolution process. The numerical prediction for the cycle time of cavitation in-ception, development, detachment, and collapse agrees well with the experi-mental data. It is found that the vortex pair induced by the interaction between the re-entrant jet and mainstream is responsible for the instability of the cavita-tion shedding flow.
Key words: cavitation, hydrofoil, partially-averaged Navie-Stokes, density correction method
Introduction
Cavitation is a kind of complex phenomenon involving phase transition, unsteadi-ness and multi-scale turbulence. It is well known that the strong instability of cloud cavitation often leads to serious problems in hydraulic machinery, such as noise, vibration, and erosion. A lot of numerical studies have been conducted to understand the mechanisms of unsteady cavitation shedding [1, 2]. The shear stress transport (SST) k-ω turbulence model is widely used in the industry, but a large number of validation studies [3-5] show two-equations turbu-lence models tend to overpredict the kinematic eddy viscosity in the region of cavity closure, which result in overprediction of the turbulent stresses, causing the re-entrant jet to lose mo-mentum and not be able to cut across the cavity sheet. Coutier-Delgashe et al. [5] proposed an eddy viscosity correction for re-normalisation group k-ε model to solve the problem and ob-tained a good result. Besides, Girimaji [6] proposed a partially-averaged Navier-Stokes (PANS) model to achieve a transition from Reynolds averaged Navier-Stokes model (RANS) to direct numerical simulation, which fully releases the details of the unsteady cavitating flows. Recently, Ji et al. [7] used the PANS model to simulate the cloud cavitation around the hydrofoil and predicted the shedding phenomenon of the vortex cavity accurately.
In this paper, the PANS and density correction method (DCM) SST k-ω turbulence models were employed to investigate the cavitation shedding flow around the NACA66
hy-––––––––––––––
drofoil. The evolution process of the unsteady cloud cavity was analyzed, and the prediction error of the two turbulence models was discussed as well.
Numerical method and set-up
Turbulence model and correction
In the present study, the kinematic eddy viscosity in the SST k-ω was improved based on the DCM [5].
( ) ( )
n m v
m v l v
l v
f ρ ρ ρ ρ ρ ρ
ρ ρ
⎛ − ⎞
= +⎜ ⎟ −
−
⎝ ⎠ (1)
where n = 10.
Thus, the modified kinematic eddy viscosity in SST k-ω turbulence model is defined as:
2 2
* *
1 1
( )
( ) 1
1 1
max , max ,
n m v
v l v
l v m T k f k SF SF a a
c aµ c aµ
ρ ρ
ρ ρ ρ
ρ ρ ρ µ ω ω ω ω ⎡ ⎛ − ⎞ ⎤ ⎢ +⎜ ⎟ − ⎥ − ⎢ ⎝ ⎠ ⎥ ⎣ ⎦ = = ⎛ ⎞ ⎛ ⎞ ⎜ ⎟ ⎜ ⎟ ⎜ ⎟ ⎜ ⎟ ⎝ ⎠ ⎝ ⎠ (2)
The PANS model was put forward by Girimaji [6] based on standard k-ε model, governing equations of the PANS model are:
( )
( u) j u t u
ku u
j j ku j
u k
k k
P
t x x x
ρ ρ µ µ ρε σ ⎡ ⎤ ∂ ⎛ ⎞ ∂ + = ∂ + ∂ + − ⎢⎜ ⎟ ⎥
∂ ∂ ∂ ⎢⎣⎝ ⎠∂ ⎥⎦ (3)
2 *
1 2
( )
( u) j u t u u u
ku
j j u j u u
u
C P C
t x x ε x ε k ε k
ρ ε
ρε µ µ ε ε ρ ε
σ
⎡ ⎤
∂ ⎛ ⎞
∂ + = ∂ + ∂ + −
⎢⎜ ⎟ ⎥
∂ ∂ ∂ ⎢⎣⎝ ⎠ ∂ ⎥⎦ (4)
Compared to the standard k-ε model, PANS model modified some coefficients:
2 2
,
k k k
ku u f f f f ε ε ε ε σ σ
σ = σ = (5)
C*2 C 1 fk (C 2 C1)
f
ε ε ε ε
ε
= + − (6)
where σk=1.0,σε=1.3, and Cε1=1.44.
The values of the fk and fε determine the accuracy of the simulation results.
Accord-ing to [6, 7], in the flow field of the high Reynolds number, fε = 1, ,fk = 0.4.
Boundary conditions and mesh
Figure 1. Computational domain Figure 2. Mesh near the hydrofoil
According to the experimental set-up [3], the angle of attack and the cavitation number are 6° and 0.99, respectively. Velocity Uin = 5.33 m/s is fixed at the inlet, correspond-ing to Reynolds number 8·105. The outlet pressure is determined by the cavitation number. In the unsteady simulation, the time step ∆t was set to 10–3 s.
Results and discussion
Validation of PANS model and DCM SST k-ω
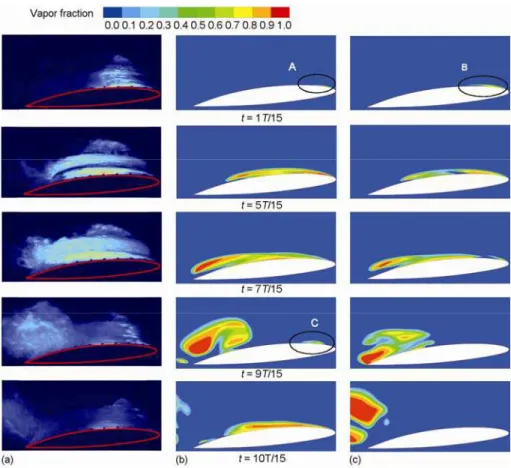
Figure 3 shows comparisons of the instant high-speed images of the cavitation evolu-tion in one cycle and the numerical results based on PANS model and DCM SST k-ωmodel.
According to the experiment results [1], the evolution of cloud cavitation is characterized by the unsteady behavior. As presented in fig. 3, the difference of the cavity development exists in the span-wise direction because of the viscous resistance of the side walls. Due to the limita-tion of the computalimita-tional resources and time, it is simplified to a 2-D problem in the assump-tion of the infinite hydrofoil span. The two turbulence models both have the ability to repro-duce the evolution of the cloud cavitation. Based on the improved SST k-ωturbulence model with density correction method, the over-estimated turbulence viscosity was corrected, and show a good agreement with the experimental visualizations for the unsteady cloud cavitation.
The evolution cycle of the cloud cavitation predicted by DCM SST k-ωand PANS model are 0.210 s and 0.291 s, respectively. Compared with the experimental value 0.300 s, the predicted cycle times of the cloud cavitation inception, development, detach, and collapse are all low than the actual value. However, the evolution cycle predicted by PANS shows the smaller error compared to the experimental value.
As shown in fig. 3, the regions marked with A and B at t = 1/15 T shows that the DCM SST k-ω model cannot well-capture the cavitation inception. However, the results simulated by the PANS model agree well with the experiment. Besides, there is a more obvi-ous different that the volume fraction calculated by PANS model is lower than that calculated by DCM SST model. However, the cavitation image calculated by PANS model reveals more details of the evolution process.
A vortex pair in one cycle
As shown in fig. 4(a), the re-entrant jet formed under the effect of the adverse pres-sure gradient. The liquid gradually accumulate under the cavity. At t = 5T/15, the liquid be-comes thicker at the bottom of the cavity, as shown in fig. 4(b). Meanwhile, the attached cavi-ty continues to expand toward the downstream, and the liquid group carried by the re-entrant jet gathered inside the attached cavity, and then moved to the leading edge. At t = 7T/15, the breakup of the cavity occurs due to the larger liquid group. The breakup and detachment can be called the primary separation. As shown in fig. 4(c), a little residual cavity still remains in the front part of the hydrofoil. In fig. 3, at t = 9T/15 and t = 10T/15, the residual cavity disap-peared, and PANS model well captured the trend which shows agreement with the Leroux’s observation [1]. However, the DCM SST k-ω model cannot capture this phenomenon, and the residual cavity still exists after the first detach, as shown in fig. 3(b) at regions with label C, which is inconsistent with the experiment data.
Figure 4. The velocity and vapor volume fraction contour during primary cavity break-up; (a) t = 3T/15, (b) t = 5T/15, and (c) t = 7T/15 (for color image see journal web-site)
shown in fig. 5, the interaction between the re-entrant jet and the mainstream of the upper and lower hydrofoil surfaces induces the vortex A and vortex B at t = t0 + 140 ms. The cavity thickness gradually increases under the effect of the vortex pair. At the same time, the re- -entrant jet continues to cut up the shear layer at the cavity bottom. Under the influence of the two factors, the shear layer near the surface of hydrofoil become unstable. Thus, the cloud cavity formed and detached from the surface of the hydrofoil. The figures from t0 + 153 ms to
t0 + 180 ms show the cavity interacted with the pair vortex and finally formed a pair of cloud cavity with the opposite rotation direction at t0 + 180 ms. The vortex cavity was entrained by the mainstream and the re-entrant jet, slowly sledded to the downstream and then collapsed in the high pressure region.
Conclusions
Both DCM SST and PANS turbulence model employed in the present simulations can well reproduce the evolution process of the cloud cavitation including cavitation incep-tion, growth, detachment, and breakup. Compared with the DCM SST model, PANS model can reveal more details of unsteady cavitation, and the predicted cycle time of cavitation shedding flow is near the experimental data. Numerical results show that the cavity evolution in one typical cycle includes the primary cavity detachment and the second vortex cavity shedding. It is found that the second cavity shedding flow is induced by the counter-rotating vortex pair under the interaction between the re-entrant jet and mainstream.
Figure 5. The second cloud cavitation shedding (for color image see journal web-site)
Acknowledgment
References
[1] Leroux, J. B., et al., A Joint Experimental and Numerical Study of Mechanisms Associated to Instability
of Partial Cavitation on Two-Dimensional Hydrofoil, Physics of Fluids 17 (2005), 5, pp. 1-19
[2] Wang, G. Y., et al., Dynamics of Attached Turbulent Cavitating Flows, Progress in Aerospace Sciences,
37 (2001), 6, pp. 551-581
[3] Leroux J. B., et al., An Experimental Study of Unsteady Partial Cavitation [J]. Journal of Fluids
Engi-neering, 126 (2004), 1, pp. 94-101
[4] Huang, B., et al., Evaluation of the Cavitation Models on the Numerical Simulation of Cloud Cavitating
Flows Around a Hydrofoil,Transactions of Beijing Institute of Technology, 29 (2009), 9, pp. 785-789
[5] Coutier-Delgosha, O., et al., Evaluation of the Turbulence Model Influence on the Numerical
Simula-tions of Unsteady Cavitation, Journal of Fluids Engineering, 125 (2003), 1, pp. 38-45
[6] Girimaji, S. S., Partially-Averaged Stokes Model for Turbulence: a Reynolds-Averaged
Navier-Stokes to Direct Numerical Simulation Bridging Method, Journal of Applied Mechanics, 73 (2006), 3,
pp. 413-421
[7] Ji, B., et al., Numerical Simulation of Three Dimensional Cavitation Shedding Dynamics with Special
Emphasis on Cavitation-Vortex Interaction, Ocean Engineering, 87 (2014), Sept., pp. 64-77