Profiling of MicroRNAs Involved in Retinal
Degeneration Caused by Selective Müller Cell
Ablation
Sook Hyun Chung1*, Mark Gillies1, Yuki Sugiyama2, Ling Zhu1, So-Ra Lee1, Weiyong Shen1
1Macular Research Group, Clinical Ophthalmology and Eye Health, Save Sight Institute, University of Sydney, Sydney, Australia,2Lens Research Group, Clinical Ophthalmology and Eye Health, Save Sight Institute, University of Sydney, Sydney, Australia
Abstract
Dysfunction of Müller cells has been implicated in the pathogenesis of several retinal dis-eases. In order to understand the potential contribution of Müller cells to retinal disease better, we have developed a transgenic model in which foci of Müller cell ablation can be selectively induced. MicroRNAs (miRNAs), small non-coding RNAs that are involved in post-transcrip-tional modulation, have critical functions in various biological processes. The aim of this study was to profile differential expression of miRNAs and to examine changes in their target genes 2 weeks after Müller cell ablation. We identified 20 miRNAs using the miScript HC PCR array. Data analysis using two target gene prediction databases (TargetScan and mirTarBase) re-vealed 78 overlapping target genes. DAVID and KEGG pathway analysis suggested that the target genes were generally involved in cell apoptosis, p53, neurotrophin, calcium, chemo-kine and Jak-STAT signalling pathways. Changes in seven target genes including Cyclin D2, Caspase 9, insulin-like growth factor 1, IL-1 receptor-associated kinase (IRAK), calmodulin (CALM) and Janus kinase 2 (Jak2), were validated with qRT-PCR and western blots. The cel-lular localisation of cleaved-caspase 9, Cyclin D2, Jak2 and CALM was examined by immu-nofluorescence studies. We found that the transcription of some miRNAs was positively, rather than negatively, correlated with their target genes. After confirming that overexpressed miR-133a-3p was localised to the outer nuclear layer in the damaged retina, we validated the correlation between miR-133a-3p and one of its predicted target genes, cyclin D2, with a lucif-erase assay in 661 photoreceptor cells. Results revealed by miRNA profiling, target gene analysis and validation were generally consistent with our previous findings that selective Müller cell ablation causes photoreceptor degeneration and neuroinflammation. Our data on alterations of miRNAs and their target gene expression after Müller cell ablation provide fur-ther insights into the potential role of Müller cell dysfunction in retinal disease.
a11111
OPEN ACCESS
Citation:Chung SH, Gillies M, Sugiyama Y, Zhu L, Lee S-R, Shen W (2015) Profiling of MicroRNAs Involved in Retinal Degeneration Caused by Selective Müller Cell Ablation. PLoS ONE 10(3): e0118949. doi:10.1371/journal.pone.0118949
Academic Editor:Junming Yue, The University of Tennessee Health Science Center, UNITED STATES
Received:February 10, 2014
Accepted:January 26, 2015
Published:March 5, 2015
Copyright:© 2015 Chung et al. This is an open access article distributed under the terms of the Creative Commons Attribution License, which permits unrestricted use, distribution, and reproduction in any medium, provided the original author and source are credited.
Funding:This study was supported by grants from Lowy Medical Research Institute, National Health and Medical Research Council (NHMRC, Australia; APP1028393) and Ophthalmic Research Institute of Australia. Mark Gillies is a fellow of Sydney Medical School Foundation and supported by a NHMRC Practitioner Fellowship. The funders had no role in study design, data collection and analysis, decision to publish, or preparation of the manuscript.
Introduction
Müller cells, the principal glial cells of the mammalian retina, are essential for retinal homeo-stasis. Spanning the entire thickness of the retina, they support the surrounding neurones, in-cluding photoreceptors [1,2], and are involved in forming and maintaining the blood retinal barrier (BRB)[3]. Dysfunction of Müller cells has been implicated in many retinal diseases such as diabetic retinopathy and macular telangiectasia [4,5]. To investigate the relationship be-tween Müller cell dysfunction and retinal diseases, we have created a transgenic mouse model in which Müller cells can be selectively and inducibly ablated [6]. These mice develop photore-ceptor degeneration, neuroinflammation, including activation of microglia and surviving Müll-er cells, and diffMüll-erential expression of mature and precursor forms of neurotrophic factors such as neurotrophin-3 within 2 weeks of Müller cell ablation [6,7]. We have previously reported differential expression of genes that was consistent with many of these pathological processes in this model [2].
MicroRNAs (miRNAs) are small, non-coding RNA molecules which are ~22 nucleotide (nt) long which are in transcribed in the nucleus [8,9]. They regulate post-transcriptional gene expression by binding to the complementary site of mRNA [10,11]. The short hairpin struc-ture of primary miRNAs are processed into pre-miRNA by RNase III-type enzyme, Drosha, in the nucleus and exported into the cytoplasm by exportin-5 [12]. Pre-miRNAs are catalyzed by Dicer, another kind of RNase III-type enzyme, in the cytoplasm to become ~22 nt mature miRNA [13]. Mature miRNAs are assembled into a ribonucleoprotein effector complex known as miRNA induced silencing complex and bind to proteins of the argonaute family and GW182 family [8,10]. It was previously thought that the main function of miRNAs was to re-press transcription and destabilize mRNA, however, recent studies have proposed that miR-NAs can also stimulate target mRNA expression [14–17].
The role of miRNAs in diseases of the vertebrate retina is an area of considerable potential significance [18,19]. Many studies have been focused on the pathophysiological role of miR-NAs in the pathogenesis of retinal diseases such as diabetic retinopathy and retinitis pigmen-tosa [8,20–23]. There are few studies, however, of differential expression of miRNAs in retinal diseases in which Müller cell dysfunction is suspected to play a role. The transgenic model de-scribed above, in which Müller cells can be selectively ablated, provides a unique opportunity to study alterations of retinal miRNAs after induced Müller cell ablation. The aims of this study were to profile the differential expression of miRNAs and their target genes, and to inves-tigate changes in target gene expression 2 weeks after selective Müller cell ablation, which is the peak time of photoreceptor apoptosis in this model [6].
Materials and Methods
Animals
miRNA Polymerase Chain Reaction (PCR) Array
Retinae were thawed then total RNA, including miRNAs, was extracted with a miRNeasy Mini Kit (Qiagen, 217004) according to manufacturer’s instructions. The quantity and quality were assessed by an Experion Automated Electrophoresis System (Biorad, 701–7001). Six retinae from each group were reverse-transcribed with miScript II RT kit (Qiagen, 218160) and diluted with RNase free water. miRNA PCR array was performed with 384 well-plate miScript miRNA High Content PCR array (Qiagen, MIMM-3001Z) which contains miScript primers for 372 of the most well characterised miRNAs and duplicates of 6 internal reference miRNAs. The iden-tities of 372 miRNAs are listed in Supporting Information (Table A inS1 File). The thermo-cycle of the PCR array consisted of denaturing at 94° for 15 seconds, annealing at 55° for 20 seconds and extension at 70° for 30 seconds. Relative quantification was performed by the
ΔΔCTmethod recommended by the manufacturer (http://pcrdataanalysis.sabiosciences.com/ mirna/arrayanalysis.php?target = analysis). A p-value<0.05 was considered statistically signif-icant and the fold change cut-off criteria was ± 2.
Functional Analysis of miRNAs
We started with functional analysis of each differentially expressed miRNAs by performing a PubMed literature search to identify recent publications, which would shed light on their relat-ed functions (http://www.ncbi.nlm.nih.gov/pubmed). In addition, we used 2 target gene pre-diction databases: TargetScan (http://www.targetscan.org) and miRTarbase (http://mirtarbase. mbc.nctu.edu.tw). Overlapping target genes from these 2 databases were identified for further analysis. Functional analysis of the target genes was performed by Database for Annotation, Vi-sualisation Integrated Discovery (DAVID,http://david.abcc.ncifcrf.gov) and associated path-ways were identified by KEGG pathway database (http://www.genome.jp/kegg/pathway.html). We also performedin silicostudy with mirTarBase to examine direct seed matching sequence alignments between the identified miRNAs and their target genes prior to further investiga-tions (Table 1).
Quantitative RT-PCR (qRT-PCR)
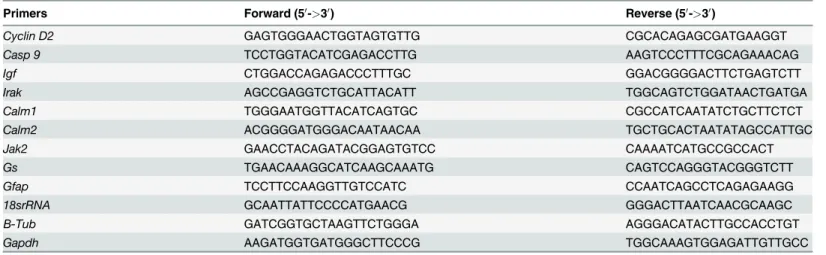
qRT-PCR was performed as previously described [2]. In brief, an equal amount of total RNA was reverse-transcribed with SuperScript VILO cDNA Synthesis kit (Life Technologies, 11754050) according to manufacturer’s instruction, and diluted with RNase free water and Ex-press SYBR GreenER qPCR Supermix (Life Technologies, 11784–200). Primers we used in this study are listed inTable 2. The relative quantitative analysis was performed by Relative Expres-sion Software Tool (REST) 2009 [24]. Expression values were normalised to the geometric mean of 3 reference genes including18SrRNA,GAPDH,β-Tubulin.
Western Blot
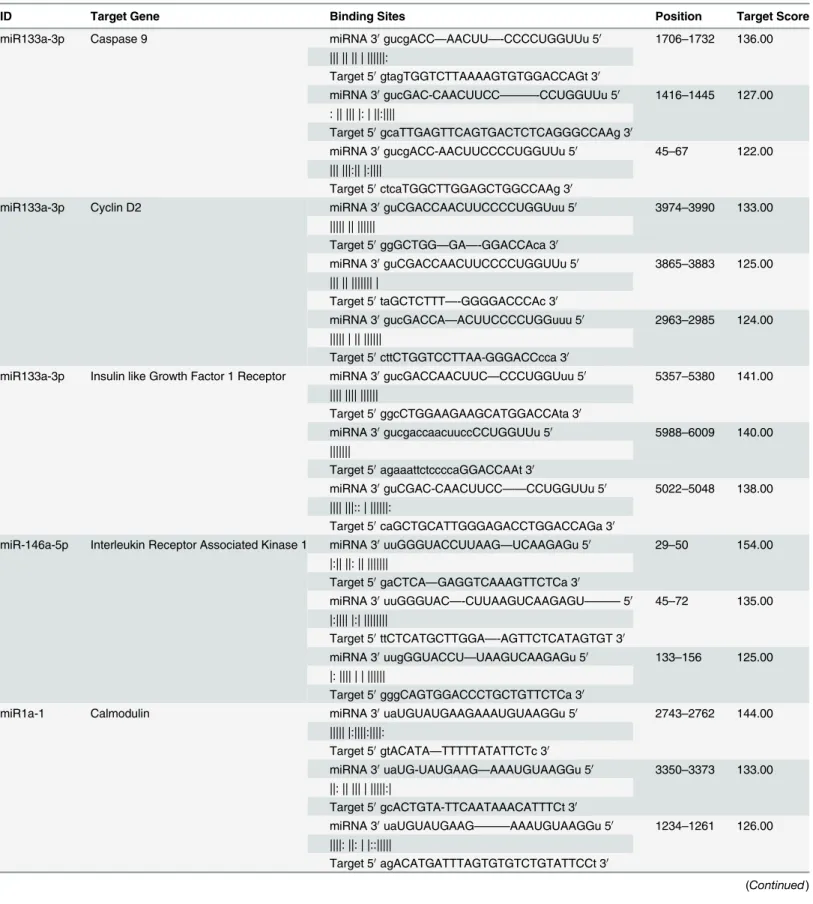
Table 1. Direct Sequence Alignment Between miRNAs and Their Target Genes 3’UTR.
ID Target Gene Binding Sites Position Target Score
miR133a-3p Caspase 9 miRNA 30gucgACC—AACUU—-CCCCUGGUUu 50 1706–1732 136.00
||| || || | ||||||:
Target 50gtagTGGTCTTAAAAGTGTGGACCAGt 30
miRNA 30gucGAC-CAACUUCC———-CCUGGUUu 50 1416–1445 127.00
: || ||| |: | ||:||||
Target 50gcaTTGAGTTCAGTGACTCTCAGGGCCAAg 30
miRNA 30gucgACC-AACUUCCCCUGGUUu 50 45–67 122.00
||| |||:|| |:||||
Target 50ctcaTGGCTTGGAGCTGGCCAAg 30
miR133a-3p Cyclin D2 miRNA 30guCGACCAACUUCCCCUGGUuu 50 3974–3990 133.00
||||| || ||||||
Target 50ggGCTGG—GA—-GGACCAca 30
miRNA 30guCGACCAACUUCCCCUGGUUu 50 3865–3883 125.00
||| || ||||||| |
Target 50taGCTCTTT—-GGGGACCCAc 30
miRNA 30gucGACCA—ACUUCCCCUGGuuu 50 2963–2985 124.00
||||| | || ||||||
Target 50cttCTGGTCCTTAA-GGGACCcca 30
miR133a-3p Insulin like Growth Factor 1 Receptor miRNA 30gucGACCAACUUC—CCCUGGUuu 50 5357–5380 141.00
|||| |||| ||||||
Target 50ggcCTGGAAGAAGCATGGACCAta 30
miRNA 30gucgaccaacuuccCCUGGUUu 50 5988–6009 140.00
|||||||
Target 50agaaattctccccaGGACCAAt 30
miRNA 30guCGAC-CAACUUCC——CCUGGUUu 50 5022–5048 138.00
|||| |||:: | ||||||:
Target 50caGCTGCATTGGGAGACCTGGACCAGa 30
miR-146a-5p Interleukin Receptor Associated Kinase 1 miRNA 30uuGGGUACCUUAAG—UCAAGAGu 50 29–50 154.00
|:|| ||: || |||||||
Target 50gaCTCA—GAGGTCAAAGTTCTCa 30
miRNA 30uuGGGUAC—-CUUAAGUCAAGAGU———50 45–72 135.00
|:|||| |:| ||||||||
Target 50ttCTCATGCTTGGA—-AGTTCTCATAGTGT 30
miRNA 30uugGGUACCU—UAAGUCAAGAGu 50 133–156 125.00
|: |||| | | ||||||
Target 50gggCAGTGGACCCTGCTGTTCTCa 30
miR1a-1 Calmodulin miRNA 30uaUGUAUGAAGAAAUGUAAGGu 50 2743–2762 144.00
||||| |:||||:||||:
Target 50gtACATA—TTTTTATATTCTc 30
miRNA 30uaUG-UAUGAAG—AAAUGUAAGGu 50 3350–3373 133.00
||: || ||| | |||||:|
Target 50gcACTGTA-TTCAATAAACATTTCt 30
miRNA 30uaUGUAUGAAG———AAAUGUAAGGu 50 1234–1261 126.00
||||: ||: | |::|||||
Target 50agACATGATTTAGTGTGTCTGTATTCCt 30
corresponding secondary antibodies conjugated withhorseradish peroxidase. GeneTool image scanning and analysis software package was used to perform protein bands densitometry and the results were normalised with loading controlα/βtubulin (Cell Signalling, #2148).
Immunofluorescence
Immunofluorescence labelling was performed as previously described [2]. Briefly, eyes were enucleated and anterior segments were dissected immediately. The remaining eye cups were fixed with 4% paraformaldehyde in PBS for an hour at room temperature and cryo-protected with 20% sucrose in PBS for overnight at 4°C. The eyecups were embedded with Optimum Cutting Medium and sectioned at 12μm on Superfrost glass slides. Sections were washed with PBS 3 times for 5 minutes and blocked with normal goat serum for 1 hour at room tempera-ture. After washing with PBS, sections were incubated with primary antibody for overnight at 4°C. The primary antibodies used in this study were cleaved caspase 9 (cell signalling, #9509S), cyclin D2 (cell signalling, #2924), JAK2 (abcam, ab39636) and calmodulin (abcam, ab45689). Secondary antibody incubation was followed on the next day for 2 hours at room temperature and nucleus staining was performed with Hoechst. Stained sections were examined by confocal microscopy as described previously [2,6].
Table 1. (Continued)
ID Target Gene Binding Sites Position Target Score
miR-375–3p Janus Kinase 2 miRNA 30agugcgcUCGGCUUGCUUGUUu 50 563–584 127.00
||| || ||||||
Target 50ttttcaaAGCAAAAGGAACAAa 30
miRNA 30agugcgcucggcuugCUUGUUu 50 33–54 120.00
||||||
Target 50agacttccagaaccaGAACAAa 30
miRNA 30agUGCGCUCGGCUUGCUUGUuu 50 1073–1092 104.00
| ||| |:: ||| |||
Target 50gcAGGCGTGT—GACGCACAtc 30
doi:10.1371/journal.pone.0118949.t001
Table 2. Information on primers used for qRT-PCR validation.
Primers Forward (50->30) Reverse (50->30)
Cyclin D2 GAGTGGGAACTGGTAGTGTTG CGCACAGAGCGATGAAGGT
Casp 9 TCCTGGTACATCGAGACCTTG AAGTCCCTTTCGCAGAAACAG
Igf CTGGACCAGAGACCCTTTGC GGACGGGGACTTCTGAGTCTT
Irak AGCCGAGGTCTGCATTACATT TGGCAGTCTGGATAACTGATGA
Calm1 TGGGAATGGTTACATCAGTGC CGCCATCAATATCTGCTTCTCT
Calm2 ACGGGGATGGGACAATAACAA TGCTGCACTAATATAGCCATTGC
Jak2 GAACCTACAGATACGGAGTGTCC CAAAATCATGCCGCCACT
Gs TGAACAAAGGCATCAAGCAAATG CAGTCCAGGGTACGGGTCTT
Gfap TCCTTCCAAGGTTGTCCATC CCAATCAGCCTCAGAGAAGG
18srRNA GCAATTATTCCCCATGAACG GGGACTTAATCAACGCAAGC
Β-Tub GATCGGTGCTAAGTTCTGGGA AGGGACATACTTGCCACCTGT
Gapdh AAGATGGTGATGGGCTTCCCG TGGCAAAGTGGAGATTGTTGCC
In Situ
Hybridisation
In situ hybridisation was performed to localise miRNA expression in the retina using Dig-la-belled miR-133a-3p miRCURY LNA probe (Exiqon, Cat#39270–01) according to the manu-facturer’s instruction with minor modifications. Briefly, cryosections were thawed, air-dried and washed with PBS for 3 times. Sections were treated with proteinase K (100ng in 200ml water) in a slide wash container for 5mins followed by acetylation treatment (2.3ml of trietha-nolamine and 500μl acetic anhydride in 200ml water) for 10mins. A hybridisation buffer con-taining 25nM of probe was pre-warmed for 5min at 65°C and then applied onto sections. Sections were cover-slipped and incubated in a chamber humidified with 50% formamide in saline sodium citrate (SSC) solution overnight at 53°C. On the next day, sections were washed, blocked with 10% normal goat serum and incubated with an anti-Dig antibody (Roche, 11093274910) overnight at 4°C. NBT/BCIP alkaline phosphatase colour reaction (Vector labo-ratories, SK-5400) was performed to visualise the cellular localisation of miR-133a expression according to the manufacturer’s instruction.
Luciferase Assay
Luciferase assay was performed to validate the direct correlation between miRNA and its pre-dicted target gene expression. We chose to validate miR-133a-3p and one of its target genes, cy-clin D2, since cycy-clin D2 was the most differentially expressed gene after Muller cell ablation. Briefly, 3’UTR of cyclin D2 was amplified by PCR, digested with XhoI and NotI restriction en-zymes (New England Biolabs, R0146S and R3189S) and cloned into a multiple cloning site lo-cated downstream of the renilla translational stop codon within the psiCHECKTM-2 vector (Promega, C8021). 661w photoreceptor cells were seeded in 12-well plates (50,000 cells per well) and cultured for 2 days. Once they reached 70% confluence, the cells were transfected with the vector alone, or co-transfected with a miRNA-133a-3p mimic (Ambion, 4464067) or a control miRNA (Ambion; 4464058) using Lipofectamin 3000 (Life Technologies, L3000001) for 48 hrs. Luciferase assay was performed using the Dual-Glo Luciferase Assay System (Pro-mega, E2920) and the luciferase activity was measured by Safire2TM Tecan plate reader (Tecan Austria, Safire-BASIC). Firefly luciferase activity was normalised to the renilla luciferase activity.
Statistic Analysis
Results are expressed as mean ± SEM. Data were analysed using unpaired Student t-test. A p value<0.05 was regarded as statistically significant.
Results
miRNA PCR Array
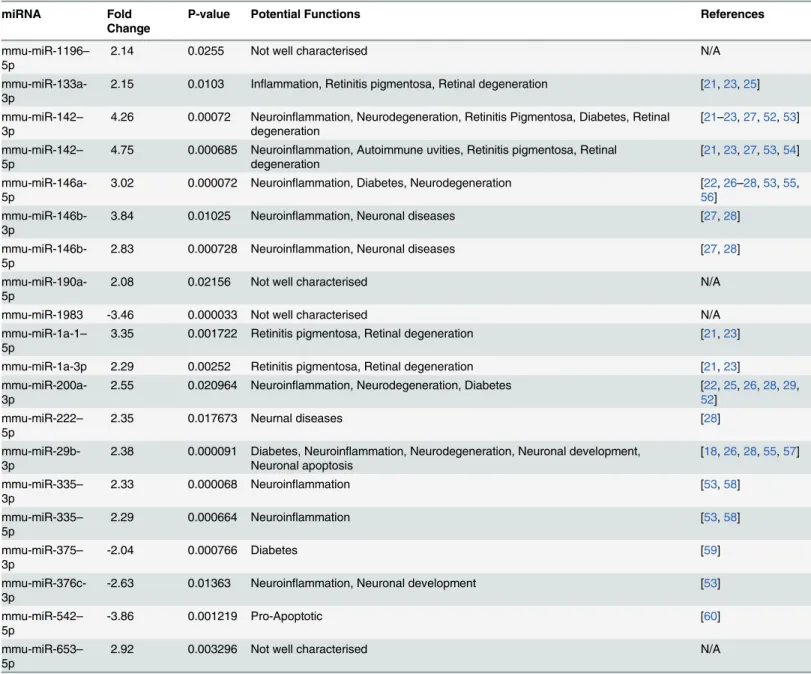
miRNA PCR array analysis revealed 20 differentially expressed miRNAs with greater than 2 fold change (P<0.05) 2 weeks after Müller cell ablation. Of these, 16 were upregulated (miR-1196–5p, miR-133a-3p, miR-142–3p, miR-142–5p, 146a-5p, 146b-3p, miR-146b-5p, miR-190a-5p, miR-1a-1–5p, miR-1a-3p, miR-200a-3p, miR-222–5p, miR-29b-3p, miR-335–3p, miR-335–5p, and miR-653–5p) and 4 were downregulated (miR-1983, miR-375–
retinopathy and retinitis pigmentosa (Table 3). In general, the results we obtained from this miRNA PCR array were consistent with our previous studies which identified retinal morpho-logical changes, microarray profiling, neuroinflammation and differential expression of neuro-trophins after selective Müller cell ablation [2,6,7].
Target Gene Analysis and qRT-PCR Validation
We used 2 different databases, TargetScan and mirTarBase, to analyse genes which could be potentially targeted by the differentially expressed miRNAs. We identified 78 overlapping genes that could be potentially targeted by the 20 differentially expressed miRNAs. Of these, 72 corresponded to upregulated miRNAs and 6 to downregulated miRNAs (Table B and Table C Table 3. List of Differentially Expressed miRNAs 2 weeks after induced Müller Cell Ablation.
miRNA Fold
Change
P-value Potential Functions References
mmu-miR-1196– 5p
2.14 0.0255 Not well characterised N/A
mmu-miR-133a-3p
2.15 0.0103 Inflammation, Retinitis pigmentosa, Retinal degeneration [21,23,25]
mmu-miR-142– 3p
4.26 0.00072 Neuroinflammation, Neurodegeneration, Retinitis Pigmentosa, Diabetes, Retinal degeneration
[21–23,27,52,53]
mmu-miR-142– 5p
4.75 0.000685 Neuroinflammation, Autoimmune uvities, Retinitis pigmentosa, Retinal degeneration
[21,23,27,53,54]
mmu-miR-146a-5p
3.02 0.000072 Neuroinflammation, Diabetes, Neurodegeneration [22,26–28,53,55, 56]
mmu-miR-146b-3p
3.84 0.01025 Neuroinflammation, Neuronal diseases [27,28]
mmu-miR-146b-5p
2.83 0.000728 Neuroinflammation, Neuronal diseases [27,28]
mmu-miR-190a-5p
2.08 0.02156 Not well characterised N/A
mmu-miR-1983 -3.46 0.000033 Not well characterised N/A
mmu-miR-1a-1– 5p
3.35 0.001722 Retinitis pigmentosa, Retinal degeneration [21,23]
mmu-miR-1a-3p 2.29 0.00252 Retinitis pigmentosa, Retinal degeneration [21,23]
mmu-miR-200a-3p
2.55 0.020964 Neuroinflammation, Neurodegeneration, Diabetes [22,25,26,28,29, 52]
mmu-miR-222– 5p
2.35 0.017673 Neurnal diseases [28]
mmu-miR-29b-3p
2.38 0.000091 Diabetes, Neuroinflammation, Neurodegeneration, Neuronal development, Neuronal apoptosis
[18,26,28,55,57]
mmu-miR-335– 3p
2.33 0.000068 Neuroinflammation [53,58]
mmu-miR-335– 5p
2.29 0.000664 Neuroinflammation [53,58]
mmu-miR-375– 3p
-2.04 0.000766 Diabetes [59]
mmu-miR-376c-3p
-2.63 0.01363 Neuroinflammation, Neuronal development [53]
mmu-miR-542– 5p
-3.86 0.001219 Pro-Apoptotic [60]
mmu-miR-653– 5p
2.92 0.003296 Not well characterised N/A
inS1 File). DAVID and KEGG pathway analysis revealed that 41 target genes had significant biological functions (Table D inS1 File). Based on their potential roles in retinal pathology as previously reported [2,6], we chose 7 genes for qRT-PCR validation, includingCyclin D2, Cas-pase 9,IGF1,IRAK,CALM1,CALM2, andJak2(Table 3). Prior to further validation with qRT-PCR, we performed in silico study with mirTarBAse which revealed seed sequence alignments between miRNAs and their target genes (Table 1). Glutamine synthetase (GS) andGFAPwere used as Müller cell markers to correlate changes in these 7 genes with Müller cell disruption. Consistent with our previous studies [6,7], Müller cell ablation resulted in downregulation of
GSand upregulation ofGFAP(Table 3). qRT-PCR analysis revealed thatCyclin D2,IGF1,
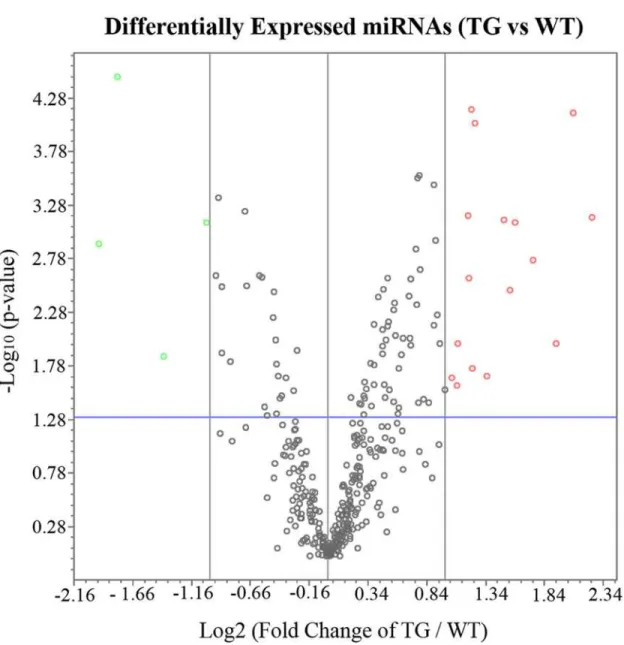
CALM2andJak2were significantly upregulated 2 weeks after Müller cell ablation (p<0.05) (Table 4andFig. 2). The KEGG pathway analysis suggested that these genes were involved in Fig 1. Volcano Plot of Differentially Expressed miRNA in after Selective Müller cell ablation.The red circles represent upregulated miRNAs and the green circles indicate downregulated miRNAs (2 fold-change). The blue line indicates p-value of 0.05.
Table 4. Summary of some miRNA target genes and signalling pathways that might be involved in the retinal pathology caused by selective Müller cell ablation.
Gene Name KEGG Pathways/Markers qRT-PCR Expression P-value qRT-PCR Result
CyclinD2 p53 Signalling pathway, 5.047 0.001 UP
Casp9 Apoptosis, p53 Signalling pathway, 1.081 0.101
-Igf1 p53 Signalling pathway 1.220 0.003 UP
Irak Apoptosis, Neurotrophin pathway 0.950 0.426
-Calm1 Calcium signalling pathway, Neurotrophin pathway 0.932 0.110
-Calm2 Calcium signalling pathway, Neurotrophin pathway 1.109 0.012 UP
Jak2 Chemokine Signalling pathway, Jak-STAT Signalling Pathway 1.222 0.001 UP
GS Müller Cell Marker 0.561 0.000 DOWN
Gfap Gliosis Marker 5.277 0.001 UP
doi:10.1371/journal.pone.0118949.t004
Fig 2. qRT-PCR validation of target gene expression.The boxes represent the interquartile range, and the dotted line represents the median gene expression. Whiskers indicate the maximum and minimum values.*indicates p<0.001,†represents p<0.01 and‡shows p<0.05.
cell apoptosis, p53, neurotrophin, calcium, chemokine and Jak-STAT signalling pathways (Table 4).
Western Blot Analysis
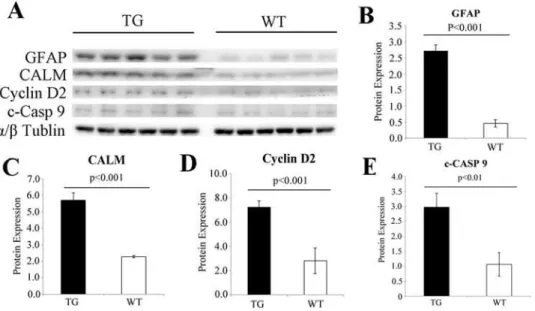
Western blot analysis after Müller cell ablation found changes that were consistent with target gene analysis revealed by qRT-PCR. Genes involved in the p53 signalling pathway, cell apopto-sis including cleaved-caspase 9 and cyclin D2 and calmodulin which plays a role in calcium sig-nalling and the neurotrophin pathway, were all significantly upregulated after Müller cell ablation (Fig. 3). Jak2 tended to be upregulated but the change was not statistical significant (P = 0.2).
Immunofluorescence
We performed immunofluorescence with antibodies against four proteins encoded by target genes including cleaved-caspase 9, cyclin D2, Jak2 and calmodulin to examine their cellular specific expression (Fig. 4). We found that cleaved-caspase9 (Fig. 4A) and Jak2 (Fig. 4C) were mainly expressed in the outer nuclear layer (ONL) in areas corresponding with patches of Müller cell ablation. Upregulation of cyclin D2 was observed in not only the inner nuclear layer (INL) and the ONL but also in some cell bodies of photoreceptors near the outer limiting membrane after Müller cell ablation compared with controls (Fig. 4B). Calmodulin was mainly expressed in the INL and weakly expressed in photoreceptor inner segments in the normal reti-nae. It was markedly upregulated in the outer plexiform layer, ONL and photoreceptor inner segments in areas of Müller cell ablation (Fig. 4D).
Validation of the Correlation of miR-133a-3p with Its Target Gene Cyclin
D2 Expression Using Luciferase Assay
miRNA PCR array showed 2.15-fold increase in miR-133a-3p expression (Table 3) while qRT-PCR analysis showed 5-fold increase in cyclin D2 expression after Muller cell ablation
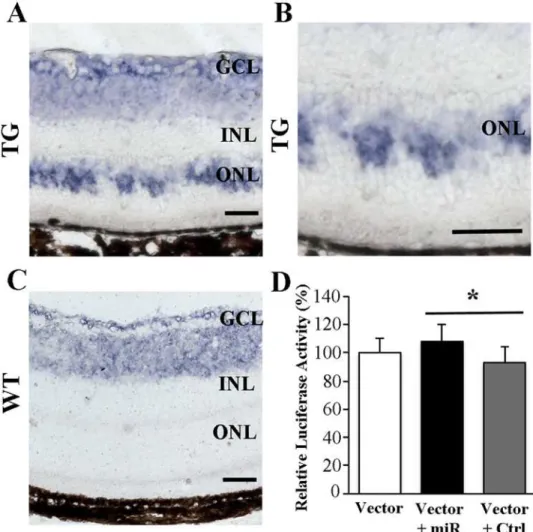
(Table 4). As cyclin D2 is one of the genes targeted by miR-133a-3p, our data indicate a positive correlation between miR-133a-3p and cyclin D2 expression. We performedin situ hybridisa-tion and found that the increased miR-133a-3p expression was mainly localised to the outer nuclear layer in the retina after Muller cell ablation (Fig. 5A-C). In order to validate the func-tional correlation between miR-133a-3p and cyclin D2 expression, we cloned the 3’UTR region of cyclin D2 gene into a vector and conducted luciferase assay in 661w photoreceptor cells. We found that co-transfection of 661w cells with a miR-133a-3p mimic along with the vector re-sulted in significant increase in the normalised luciferase activity compared with cells co-transfected with a control miRNA and the vector (P<0.05,Fig. 5D), thus confirming the posi-tive correlation between miR-133a-3p and cyclin D2 expression.
Discussion
Immunofluorescence studies revealed that the upregulation of these miRNA-target genes were mainly observed in the ONL where photoreceptor degeneration occurred after selective Müller cell ablation. We conducted in situ hybridisation for miR-133a-3p and found that the increased expression of miR-133a-3p was mainly localised in the ONL. Furthermore, we performed lucif-erase assay to validate the positive correlation between miR133a-3p and one of its predicted targets genes, cyclin D2 in 661 photoreceptor cells. The results were generally consistent with our previous findings that selective Müller cell ablation causes photoreceptor degeneration [2,6].
Neuronal damage in this transgenic model is characterized by photoreceptor degeneration caused by selective Müller cell ablation [6]. MiRNA profiling conducted 2 weeks after Müller cell ablation identified a number of differentially expressed miRNAs whose target genes were associated with cell apoptosis and neurodegeneration in the central nervous system including retinal degeneration [21,23,25–29]. For instance, one of the genes targeted by miR-133a-3p is caspase-9, which can form an apoptosome with cytochrome-c released from mitochondria and lead to activation of other caspases and cell death [30]. Calmodulin, which is targeted by mir-1a-3, has been reported that calmodulin plays a role in neurotransmitter release and trafficking in synapsis [31,32]. However, overexpression of calmodulin has been reported to be involved in neuronal apoptosis by activating calcium/calmodulin-dependent protein kinase II [33,34]. Inhibition of calmodulin activity has been reported to prevent retinal neuronal apoptosis [35–38].
Our previous studies found that the microarray profiling in which we performed 1 week after Müller cell ablation, also revealed upregulation of genes involved in apoptosis [2], and the characterization study showed photoreceptor apoptosis was peaked at 2 weeks after Müller cell ablation [6]. We did not observe any significant differences in the number of TUNNEL positive cells the retina between 1 week and 2 weeks after Müller cell ablation, thus we believe the cur-rent study is generally supported by our previously observations.
Fig 3. Western blot validation of target gene expression.(A-E) Western blot analysis revealed significant upregulation of proteins related to gliosis, calcium signalling pathway and p53 signalling pathways. The results were consistent with the qRT-PCR analysis. GFAP; glia fibrillary acidic protein, CALM; calmodulin, c-CASP 9; cleaved caspase 9.
Interestingly, miR-133a-3p also targets an anti-apoptotic gene. Cyclin D2, which has been reported to play a role in anti-apoptosis by phosphorylating retinoblastoma protein, cell cycle arrest and neurogenesis[39–42], was significantly upregulated after Müller cell ablation. After confirmation that the increased miR-133a-3p expression was mainly localised to the outer Fig 4. Immunofluorescent staining for proteins encoded by genes targeted by differentially expressed miRNAs after Müller cell ablation.The genes encoding C-caspase 9 and CyclinD2 are targeted by miR133a-3p.“Merged”includes Hoechst stain. Jak2 is encoded by a gene that is targeted by miR-375– 3p. Calmodulin is a gene targeted by miR1a-1. Cleaved-caspase 9 (A, arrows) and Jak2 (C, arrows) were only observed after Müller cell ablation (A and C). Increased immunoreactivity for CyclinD2 was observed in the ganglion cell layer (GCL), inner nuclear layer (INL) and outer nuclear layer (ONL) after Müller cell ablation compared with controls (B). Calmodulin was mainly expressed in the GCL and retinal neurons in the INL in the normal retina but increased expression (arrows) was observed in the outer plexiform layer, ONL and photoreceptor segments (arrow heads) in areas of Müller cell ablation, which are marked by focal areas of degeneration in the ONL (D). Scale bars represent 50μm. Scale bars in figures with high magnification (x40 in B and D) represent
25μm.
nuclear layer after Muller cell ablation, we conducted luciferase assay in 661w photoreceptors to validate the positive correlation between miR-133a-3p and cyclin D2 expression. We found that co-transfection of 661w cells using the vector with a miR-133a mimic induced significant increase in luciferase activity compared with cells co-transfected using the vector with a control miRNA (Fig. 5D). A previous study reported a negative correlation between miR-133a and cy-clin D2 expression in cardiac muscle cells and cos-1 cells [41]. The discrepancy between that study and the results we present here could be due to the diverse roles of miR-133a and cyclin D2 in different tissues and biological models. Cyclin D family has been reported to play a neu-roprotective role in brain injury and retinal degeneration [41,43]. Moreover, cyclin D2 is in-volved in neurogenesis [40]. It is unclear whether the overexpressed miR-133a and cyclin D2 are due to a defensive response to the retinal stress caused by Muller cell ablation. Future stud-ies are warranted to investigate the effects of intervention of miR-133a and cyclin D2 overex-pression on photoreceptor degeneration in our transgenic mice.
Fig 5. (A-C), in situ hybridisation for miR-133a-3p expression in normal (C) and diseased (A and B) retinas. (D), luciferase assay to study the correlation of miR-133a-3p with cyclin D2 expression in 661 photoreceptor cells.The expression of miR-133a-3p in the outer nuclear layer (ONL) was increased after induced Müller cell ablation. Co-transfection of 661w cells using a vector containing 3’UTR region of the cyclin D2 gene along with a miR-133a-3p mimic (Vector + miR) induced a significant increase in the normalised firefly luciferase activity compared with cells co-transfected using the vector with a control miRNA (Vector + Ctrl) (*P<0.05, n = 6/group). Data is presented as Mean + SEM. Scale bars in A-C: 50μm. GCL =
ganglion cell layer. INL = inner nuclear layer. ONL = outer nuclear layer.
Neuroinflammation was also shown in the transgenic model of selective Müller cell ablation [2,6,7]. Mir-146a-5p, which has been reported to play a role in neuroinflammation and neuro-degeneration [22,27], was upregulated after induced Müller cell ablation. It has been reported that its target genes, such as IRAK1, IRAK2, and TRAF6, are involved in cell survival and neu-roprotection. IRAK recruits the p75 neurotrophin receptor and activates nuclear factor keppa B (NF-kB) [44,45]. We recently showed that the p75 neurotrophin receptor was profoundly upregulated in activated surviving Müller cells and that photoreceptor degeneration occurred concurrently with activation of microglial cells in this model. Linking the result of upregulation of mir-146a-5p with features of photoreceptor degeneration and neuroinflammation caused by Müller cell ablation indicates a potential positive correlation between mir-146a-5p expression and IRAK expression, although our qRT-PCR analysis of the change in IRAK transcription was not statistically significant between transgenic and control mice. Further analysis on the re-lationship between miR-146a-5p upregulation of changes in different isoforms of IRAKs and their downstream effectors is warranted to provide a better understanding of the role of miRNA-146 in photoreceptor degeneration and neuroinflammation caused by Müller cell dysfunction.
Interestingly, miR-375–3p was downregulated after Müller cell ablation, and Jak2, one of its target genes, was upregulated. The negative correlation between miR-375 and Jak2 is consistent with a recent report in which target mutation of a predicted miR-375-binding site abolished the activity of a luciferase reporter carrying the 3’untranslated region of Jak2 [46]. Jak2 has been reported to be involved in activation of immune response/chemokine signalling and the Jak/STAT pathways. Inflammation induced by lipopolysachrides in the rat retina caused acti-vation of the Jak2/STAT3 pathway and neuronal gliosis [47]. Our recent studies found that se-lective Müller cell ablation resulted in profound activation of surviving Müller cells and microglia and overexpression of TNFα. It is plausible that the downregulation of miR-375–3p may trigger activation of the Jak2/STAT3 pathway and chemokine signalling, both of which can damage photoreceptors.
We conducted immunostaining to study the cellular localization of a number of target genes in normal and degenerating retinae. Cleaved-caspase 9, cyclin D2 and JAK2, were mainly expressed in the ONL in areas corresponding to Müller cell ablation, whereas upregulation of calmodulin was observed in the outer plexiform layer, ONL and photoreceptor segments after Müller cell ablation. Calmodulin is a highly conserved regulatory protein found in all eukaryot-ic organisms wheukaryot-ich mediates a variety of calcium ion-dependent signaling pathways [31]. A re-cent study showed that over-activation of calcium/calmodulin-activated protein kinase II is involved in photoreceptor degeneration in the rd1 mouse [48]. Our observation that calmodu-lin was upregulated after Müller cell ablation suggests that activation of the calcium/calmodu-lin signalcalcium/calmodu-ling may contribute to photoreceptor degeneration. Interestingly, cyccalcium/calmodu-lin D2 was highly upregulated in the INL of retinae with Müller cell ablation compared with the normal retina in controls. As cyclin D2 is anti-apoptosis [39], this observation may partially explain the phenomenon that neuronal damage is not obvious in the INL following Müller cell ablation in this transgenic model [6].
We acknowledge that this profiling study only covered 372 miRNAs rather than an unbi-ased genome-wide screen. We cannot rule out the possibility that the screening of a limited number of miRNAs might have missed some miRNAs which make important contributions towards photoreceptor degeneration and neuroinflammation in retinal disease.
We report here that miRNAs and their target genes that are differentially expressed soon after selective Müller ablation are mainly involved in neuronal apoptosis, inflammation and neurodegenration. Müller cell dysfunction has been implicated in the pathogenesis of many retinal diseases but its precise contribution to the photoreceptor degeneration, which ultimate-ly results in loss of vision, remains poorultimate-ly understood. The results of miRNA profiling after Müller cell ablation that we present here provide further insights into the pathogenesis of pho-toreceptor degeneration associated with Müller cell dysfunction.
Supporting Information
S1 File. Supporting tables.Table A. The list of 372 miRNA IDs used in Qiagen HC PCR array. Table B. Target gene analysis from the upregulated miRNAs. The list shows the overlapping target genes from TargetScan and miTarBase. Table C. Target gene analysis from the dwonre-gulated miRNAs. The list is the overlapping target genes from TargetScan and miTarBase. Table D. Functional analysis of the target genes performed by DAVID and KEGG. (DOCX)
Acknowledgments
The authors thank Drs. Natalie Castrechini, Teresa Lyons and Fanfan Zhu for their technical advice.
Author Contributions
Conceived and designed the experiments: SHC WS MG. Performed the experiments: SHC YS LZ SRL. Analyzed the data: SHC WS. Contributed reagents/materials/analysis tools: SHC YS LZ SRL. Wrote the paper: SHC WS MG.
References
1. Jablonski MM, Iannaccone A (2000) Targeted disruption of Muller cell metabolism induces photorecep-tor dysmorphogenesis. Glia 32: 192–204. PMID:11008218
2. Chung SH, Shen W, Gillies MC (2013) Laser capture microdissection-directed profiling of glycolytic and mTOR pathways in areas of selectively ablated Muller cells in the murine retina. Investigative ophthal-mology & visual science 54: 6578–6585.
3. Tout S, Chan-Ling T, Hollander H, Stone J (1993) The role of Muller cells in the formation of the blood-retinal barrier. Neuroscience 55: 291–301. PMID:8350991
4. Powner MB, Gillies MC, Tretiach M, Scott A, Guymer RH, Hageman GS, et al. (2010) Perifoveal muller cell depletion in a case of macular telangiectasia type 2. Ophthalmology 117: 2407–2416. doi:10. 1016/j.ophtha.2010.04.001PMID:20678804
5. Rungger-Brandle E, Dosso AA PM (2000) Glial reactivity, an early feature of diabetic retinopathy. Inves-tigative ophthalmology & visual science 41: 1971–1980.
6. Shen W, Fruttiger M, Zhu L, Chung SH, Barnett NL, Kirk JK, et al. (2012) Conditional Muller Cell Abla-tion Causes Independent Neuronal and Vascular Pathologies in a Novel Transgenic Model. The Jour-nal of neuroscience: the official jourJour-nal of the Society for Neuroscience 32: 15715–15727.
7. Shen W, Zhu L, Lee SR, Chung SH, Gillies MC (2013) Involvement of NT3 and P75NTR in photorecep-tor degeneration following selective Muller cell ablation. Journal of neuroinflammation 10: 137. doi:10. 1186/1742-2094-10-137PMID:24224958
9. Ambros V (2004) The functions of animal microRNAs. Nature 431: 350–355. PMID:15372042
10. Huntzinger E E (2011) Gene silencing by microRNAs: contributions of translational repression and mRNA decay. Nature reviews Genetics 12: 99–110. doi:10.1038/nrg2936PMID:21245828
11. Fabian MR, Sonenberg N, Filipowicz W (2010) Regulation of mRNA translation and stability by micro-RNAs. Annual review of biochemistry 79: 351–379. doi:10.1146/annurev-biochem-060308-103103 PMID:20533884
12. Fabian MR, Sundermeier TR, Sonenberg N (2010) Understanding how miRNAs post-transcriptionally regulate gene expression. Progress in molecular and subcellular biology 50: 1–20. doi: 10.1007/978-3-642-03103-8_1PMID:19841878
13. Siomi H, Siomi MC (2010) Posttranscriptional regulation of microRNA biogenesis in animals. Molecular cell 38: 323–332. doi:10.1016/j.molcel.2010.03.013PMID:20471939
14. Vasudevan S, Tong Y, Steitz JA (2007) Switching from repression to activation: microRNAs can up-reg-ulate translation. Science 318: 1931–1934. PMID:18048652
15. Vasudevan S (2012) Posttranscriptional upregulation by microRNAs. Wiley interdisciplinary reviews RNA 3: 311–330. doi:10.1002/wrna.121PMID:22072587
16. Lee S, Vasudevan S (2013) Post-transcriptional stimulation of gene expression by microRNAs. Ad-vances in experimental medicine and biology 768: 97–126. doi:10.1007/978-1-4614-5107-5_7PMID: 23224967
17. Place RF, Li LC, Pookot D, Noonan EJ, Dahiya R (2008) MicroRNA-373 induces expression of genes with complementary promoter sequences. Proceedings of the National Academy of Sciences of the United States of America 105: 1608–1613. doi:10.1073/pnas.0707594105PMID:18227514
18. Hackler L Jr, Wan J, Swaroop A, Qian J, Zack DJ (2010) MicroRNA profile of the developing mouse reti-na. Investigative ophthalmology & visual science 51: 1823–1831.
19. Karali M, Peluso I, Gennarino VA, Bilio M, Verde R, Lago G, et al. (2010) miRNeye: a microRNA ex-pression atlas of the mouse eye. BMC genomics 11: 715. doi:10.1186/1471-2164-11-715PMID: 21171988
20. Krol J, Busskamp V, Markiewicz I, Stadler MB, Ribi S, Richter J, et al. (2010) Characterizing light-regu-lated retinal microRNAs reveals rapid turnover as a common property of neuronal microRNAs. Cell 141: 618–631. doi:10.1016/j.cell.2010.03.039PMID:20478254
21. Loscher CJ, Hokamp K, Wilson JH, Li T, Humphries P, Farrar GJ, et al. (2008) A common microRNA signature in mouse models of retinal degeneration. Experimental eye research 87: 529–534. doi:10. 1016/j.exer.2008.08.016PMID:18834879
22. Kovacs B, Lumayag S, Cowan C, Xu S (2011) MicroRNAs in early diabetic retinopathy in streptozoto-cin-induced diabetic rats. Investigative ophthalmology & visual science 52: 4402–4409.
23. Loscher CJ, Hokamp K, Kenna PF, Ivens AC, Humphries P, Palfi A, et al. (2007) Altered retinal micro-RNA expression profile in a mouse model of retinitis pigmentosa. Genome biology 8: R248. PMID: 18034880
24. Pfaffl MW, Horgan GW L (2002) Relative expression software tool (REST) for group-wise comparison and statistical analysis of relative expression results in real-time PCR. Nucleic Acids Res 30: e36. PMID:11972351
25. Freilich RW, Woodbury ME, Ikezu T (2013) Integrated Expression Profiles of mRNA and miRNA in Po-larized Primary Murine Microglia. PloS one 8: e79416. doi:10.1371/journal.pone.0079416PMID: 24244499
26. Goodall EF, Heath PR, Bandmann O, Kirby J, Shaw PJ (2013) Neuronal dark matter: the emerging role of microRNAs in neurodegeneration. Frontiers in cellular neuroscience 7: 178. doi:10.3389/fncel. 2013.00178PMID:24133413
27. Ksiazek-Winiarek DJ, Kacperska MJ, Glabinski A (2013) MicroRNAs as novel regulators of neuroin-flammation. Mediators of inflammation 2013: 172351. doi:10.1155/2013/172351PMID:23983402
28. Maes OC, Chertkow HM, Wang E, Schipper HM (2009) MicroRNA: Implications for Alzheimer Disease and other Human CNS Disorders. Current genomics 10: 154–168. doi:10.2174/
138920209788185252PMID:19881909
29. McArthur K, Feng B, Wu Y, Chen S, Chakrabarti S (2011) MicroRNA-200b regulates vascular endothe-lial growth factor-mediated alterations in diabetic retinopathy. Diabetes 60: 1314–1323. doi:10.2337/ db10-1557PMID:21357793
30. Fridman J, SLowe SW (2003) Control of apoptosis by p53. Oncogene 22: 9030–9040. PMID: 14663481
32. Hinds HL, Goussakov I, Nakazawa K, Tonegawa S, Bolshakov VY (2003) Essential function of alpha-calcium/calmodulin-dependent protein kinase II in neurotransmitter release at a glutamatergic central synapse. Proceedings of the National Academy of Sciences of the United States of America 100: 4275–4280. PMID:12629219
33. Ui-Tei K, Nagano M, Sato S, Miyata Y (2000) Calmodulin-dependent and-independent apoptosis in cell of a Drosophila neuronal cell line. Apoptosis: an international journal on programmed cell death 5: 133–140. PMID:11232241
34. Yu W, Niwa T, Miura Y, Horio F, Teradaira S, Ribar TJ, et al. (2002) Calmodulin overexpression causes Ca(2+)-dependent apoptosis of pancreatic beta cells, which can be prevented by inhibition of nitric oxide synthase. Laboratory investigation; a journal of technical methods and pathology 82: 1229–1239. PMID:12218084
35. Goebel DJ (2009) Selective blockade of CaMKII-alpha inhibits NMDA-induced caspase-3-dependent cell death but does not arrest PARP-1 activation or loss of plasma membrane selectivity in rat retinal neurons. Brain research 1256: 190–204. doi:10.1016/j.brainres.2008.12.051PMID:19135986
36. Fan W, Agarwal N, Kumar MD, Cooper NG (2005) Retinal ganglion cell death and neuroprotection: In-volvement of the CaMKIIalpha gene. Brain research Molecular brain research 139: 306–316. PMID: 16023257
37. Fan W, Agarwal N, Cooper NG (2006) The role of CaMKII in BDNF-mediated neuroprotection of retinal ganglion cells (RGC-5). Brain research 1067: 48–57. PMID:16337157
38. Fan W, Cooper NG (2009) Glutamate-induced NFkappaB activation in the retina. Investigative ophthal-mology & visual science 50: 917–925.
39. Bai M, Tsanou E, Skyrlas A, Sainis I, Agnantis N, Kanavaros P (2007) Alterations of the p53, Rb and p27 tumor suppressor pathways in diffuse large B-cell lymphomas. Anticancer research 27: 2345–2352. PMID:17695524
40. Kowalczyk A, Filipkowski RK, Rylski M, Wilczynski GM, Konopacki FA, Jaworski J, et al. (2004) The critical role of cyclin D2 in adult neurogenesis. The Journal of cell biology 167: 209–213. PMID: 15504908
41. Liu N, Bezprozvannaya S, Williams AH, Qi X, Richardson JA, Bassel-Duby R, et al. (2008) microRNA-133a regulates cardiomyocyte proliferation and suppresses smooth muscle gene expression in the heart. Genes & development 22: 3242–3254.
42. Urbach A, Robakiewicz I, Baum E, Kaczmarek L, Witte OW, Filipkowski RK (2013) Cyclin D2 knockout mice with depleted adult neurogenesis learn Barnes maze task. Behavioral neuroscience 127: 1–8. doi:10.1037/a0031222PMID:23244288
43. Ma C, Papermaster D, Cepko CL (1998) A unique pattern of photoreceptor degeneration in cyclin D1 mutant mice. Proceedings of the National Academy of Sciences of the United States of America 95: 9938–9943. PMID:9707579
44. Cao Z, Henzel W, JGao X (1996) IRAK: a kinase associated with the interleukin-1 receptor. Science 271: 1128–1131. PMID:8599092
45. Mamidipudi V, Li X, Wooten MW (2002) Identification of interleukin 1 receptor-associated kinase as a conserved component in the p75-neurotrophin receptor activation of nuclear factor-kappa B. The Jour-nal of biological chemistry 277: 28010–28018. PMID:12034707
46. Ding L, Xu Y, Zhang W, Deng Y, Si M, Du Y, et al. (2010) MiR-375 frequently downregulated in gastric cancer inhibits cell proliferation by targeting JAK2. Cell research 20: 784–793. doi:10.1038/cr.2010.79 PMID:20548334
47. Jang S, Lee JH, Choi KR, Kim D, Yoo H, SOh S (2007) Cytochemical alterations in the rat retina by LPS administration. Neurochemical research 32: 1–10. PMID:17160463
48. Hauck SM, Ekstrom PA, Ahuja-Jensen P, Suppmann S, Paquet-Durand F, van Veen T, et al. (2006) Differential modification of phosducin protein in degenerating rd1 retina is associated with constitutively active Ca2+/calmodulin kinase II in rod outer segments. Molecular & cellular proteomics: MCP 5: 324–336. PMID:16253986
49. Mortensen RD, Serra M, Steitz JA, Vasudevan S (2011) Posttranscriptional activation of gene expres-sion in Xenopus laevis oocytes by microRNA-protein complexes (microRNPs). Proceedings of the Na-tional Academy of Sciences of the United States of America 108: 8281–8286. doi:10.1073/pnas. 1105401108PMID:21536868
51. Nunez-Iglesias J, Liu CC, Morgan TE, Finch C, EZhou XJ (2010) Joint genome-wide profiling of miRNA and mRNA expression in Alzheimer’s disease cortex reveals altered miRNA regulation. PloS one 5: e8898. doi:10.1371/journal.pone.0008898PMID:20126538
52. Lau P, Bossers K, Janky R, Salta E, Frigerio CS, Barbash S, et al. (2013) Alteration of the microRNA network during the progression of Alzheimer’s disease. EMBO molecular medicine 5: 1613–1634. doi: 10.1002/emmm.201201974PMID:24014289
53. Jovicic A, Roshan R, Moisoi N, Pradervand S, Moser R, Pillai B, et al. (2013) Comprehensive expres-sion analyses of neural cell-type-specific miRNAs identify new determinants of the specification and maintenance of neuronal phenotypes. The Journal of neuroscience: the official journal of the Society for Neuroscience 33: 5127–5137. doi:10.1523/JNEUROSCI.0600-12.2013PMID:23516279
54. Ishida W, Fukuda K, Higuchi T, Kajisako M, Sakamoto S, Fukushima A (2011) Dynamic changes of microRNAs in the eye during the development of experimental autoimmune uveoretinitis. Investigative ophthalmology & visual science 52: 611–617.
55. Omran A, Elimam D, Yin F (2013) MicroRNAs: new insights into chronic childhood diseases. BioMed research international 2013: 291826. doi:10.1155/2013/291826PMID:23878802
56. Feng B, Chen S, McArthur K, Wu Y, Sen S, Ding Q, et al. (2011) miR-146a-Mediated extracellular ma-trix protein production in chronic diabetes complications. Diabetes 60: 2975–2984. doi: 10.2337/db11-0478PMID:21885871
57. Silva VA, Polesskaya A, Sousa TA, Correa VM, Andre ND, Reis RI, et al. (2011) Expression and cellu-lar localization of microRNA-29b and RAX, an activator of the RNA-dependent protein kinase (PKR), in the retina of streptozotocin-induced diabetic rats. Molecular vision 17: 2228–2240. PMID:21897745
58. Cossetti C, Smith JA, Iraci N, Leonardi T, Alfaro-Cervello C, Pluchino S (2012) Extracellular membrane vesicles and immune regulation in the brain. Frontiers in physiology 3: 117. doi:10.3389/fphys.2012. 00117PMID:22557978
59. Poy MN, Eliasson L, Krutzfeldt J, Kuwajima S, Ma X, Macdonald PE, et al. (2004) A pancreatic islet-specific microRNA regulates insulin secretion. Nature 432: 226–230. PMID:15538371