Chromosome 5A in Bread Wheat
Yusuf Genc1,2, Julian Taylor1, Jay Rongala2, Klaus Oldach1,2*
1School of Agriculture, Food and Wine, University of Adelaide, Waite Campus, Glen Osmond, South Australia, Australia,2South Australian Research and Development Institute, Plant Genomics Centre, Waite Campus, Glen Osmond, South Australia, Australia
Abstract
Chloride (Cl ) is an essential micronutrient for plant growth, but can be toxic at high concentrations resulting in reduced2 growth and yield. Although saline soils are generally dominated by both sodium (Na ) and Cl+ 2ions, compared to Na+
toxicity, very little is known about physiological and genetic control mechanisms of tolerance to Cl toxicity. In hydroponics2 and field studies, a bread wheat mapping population was tested to examine the relationships between physiological traits [Na , potassium (K ) and Cl concentration] involved in salinity tolerance (ST) and seedling growth or grain yield, and to+ + 2 elucidate the genetic control mechanism of plant Cl accumulation using a quantitative trait loci (QTL) analysis approach.2
+ 2
accordance with phenotypic responses, QTL controlling Cl accumulation differed entirely between hydroponics and field2 locations, and few were detected in two or more environments, demonstrating substantial QTL-by-environment interactions. The presence of several QTL for Cl2concentration indicated that uptake and accumulation was a polygenic trait. A major Cl2concentration QTL (5A;barc56/gwm186) was identified in three field environments, and accounted for 27– 32% of the total genetic variance. Alignment between the 5A QTL interval and its corresponding physical genome regions in wheat and other grasses has enabled the search for candidate genes involved in Cl2transport, which is discussed.
Citation:Genc Y, Taylor J, Rongala J, Oldach K (2014) A Major Locus for Chloride Accumulation on Chromosome 5A in Bread Wheat. PLoS ONE 9(6): e98845. doi:10.1371/journal.pone.0098845
Editor:Tai Wang, Institute of Botany, Chinese Academy of Sciences, China ReceivedSeptember 23, 2013;AcceptedMay 7, 2014;PublishedJune 3, 2014
Copyright:ß2014 Genc et al. This is an open-access article distributed under the terms of the Creative Commons Attribution License, which permits unrestricted use, distribution, and reproduction in any medium, provided the original author and source are credited.
Funding:This work was supported by the Molecular Plant Breeding Cooperative Research Centre, the South Australian Research and Development Institute, the Grains Research and Development Corporation and the University of Adelaide, Australia. The funders had no role in study design, data collection and analysis, decision to publish, or preparation of the manuscript.
Competing Interests:The authors have declared that no competing interests exist. * E-mail: [email protected]
Introduction
Worldwide, salinity poses a serious threat to agricultural production, with globally salt-affected soils (including saline and sodic soils) totalling around 830 million hectares [1]. Saline soils are generally dominated by sodium and chloride ions, and the ability of crop plants to exclude these ions is often equated to salinity tolerance-ST (i.e. improved growth or yield under salinity stress). Despite intensive research and numerous scientific reports over several decades, there is a lack of consensus on whether Na+
exclusion is always a useful trait to select for to improve ST, at least in the case of bread wheat. Few studies have shown good phenotypic correlation between Na+ exclusion and ST [2–5],
while others have reported weak [6,7] or no correlation [8–10]. In contrast to Na+exclusion, there has been very little research on the
role of Cl2exclusion and its contribution to ST [3,11–13]. Similar to Na+ exclusion, these few studies on Cl2 reported either significant phenotypic correlation or no correlation with ST. It is clear that future research needs to place equal emphasis on the impact of Cl2in ST as not only Na+but also Cl2is present at toxic concentrations in saline-affected growth media used in the assessment of ST [13,14].
In screening studies for ST, sodium chloride is the most commonly used salt. Despite both Na+and Cl2ions being present at toxic concentrations in growth media, there has been a lack of
interest in Cl2, which may be attributed to the earlier reports that Na+ was more toxic than Cl2 [15]. Although these authors cautioned about assumptions made from extrapolations of two lines of bread wheat, their findings were not verified with a large set of genotypes differing in ST. This was later questioned by Martin and Koebner [16] on the basis that while attempting to separate the toxic effects of Na+ and Cl2, the authors used phytotoxic concentrations of nitrate in their experiments. Martin and Koebner [16] concluded that Cl2was more toxic than Na+,
but the full toxic effect was apparent only when Na+and Cl2were present simultaneously. However, more recent studies in barley found that Na+and Cl2 had a similar effect upon plant growth [17]. While the issue of whether Na+or Cl2is more detrimental to plant growth remains controversial, it is appropriate to measure the concentration of both ions in the plant and to determine their relevance to ST for reasons mentioned earlier. Munns and Tester [18] argued that toxicity of Na+versus Cl2 can be best studied through genetic approaches as the alternative method of using different salts has to date produced equivocal results. The potential of the genetic approach has not been employed extensively.
can be toxic to plant growth. Critical toxicity concentration in plants was estimated at 110–200 mmol kg21
DW (4,000– 7,000 mg kg21
DW) and 420–1400 mmol kg21
DW (15,000– 50,000 mg kg21
DW) for sensitive and tolerant species, respec-tively [19]. At present there is very little information on genetic control mechanisms of Cl2 exclusion in plant species. A better understanding of genetic control of Cl2exclusion and identifica-tion of molecular markers has the potential to speed up breeding for a complex trait such as ST. To date, rice and barley appear to be the only cereal species in which genetic control of Cl2exclusion has been investigated. In two studies involving rice F2and RIL
populations derived from a cross between salt tolerant and salt-sensitive varieties CSR27 and MI48 respectively, few Cl2 concentration QTL were co-located with Na+ concentration
QTL, while others mapped to different regions [20,21]. Similar findings were also reported in barley [22,23]. If QTL for Na+and
Cl2 concentration map to different locations, this would suggest separate genetic control mechanisms for regulation of these ions. At present, we are not aware of any reports on QTL mapping of Cl2concentration in wheat.
Screening for ST is usually conducted in one of three main environments: hydroponics, soil-based pot assays or field trials. Due to inherent difficulties with field screening such as non-uniform distribution of salinity throughout the experimental area, fluctuations in rainfall and potential nutritional deficiencies, controlled environments are often preferred. However, as reported in recent studies [24], the results of controlled environments can be quite different from those of field environments and, therefore, require verification. The only two genetic studies on Cl2 accumulation to date have been conducted in hydroponics, and how these results correlate to field environments is unknown. It is important to note that the ability of controlled environmental studies to predict yield responses in the field is rarely addressed in the scientific literature, and the validation of controlled environ-mental studies in the field is important for plant breeding.
In previous studies in hydroponics and field trials [24,25], we reported QTL for grain yield, grain number m22
, 1000-grain weight, maturity, plant height, seedling biomass, tiller number, chlorophyll content, leaf symptoms, Na+and K+concentrations of
leaves and shoots for a bread wheat mapping population (Berkut/ Krichauff). With the recent renewed interest in Cl2 [13], we revisited this population to (i) elucidate the genetic control mechanisms of Cl2 homeostasis via a QTL approach, and (ii) investigate the relationships among seedling biomass, grain yield and plant Na+, K+and Cl2concentrations. Here we report for the first time identification of a major QTL for Cl2concentration in bread wheat and discuss its importance for marker-assisted selection and fine mapping/discovery of genes involved in Cl2 transport in bread wheat. We also demonstrate that Cl2 accumulation is a polygenic trait, but does not appear to be a reliable predictor of ST based on grain yield alone.
Materials and Methods
Plant material
A doubled-haploid (DH) population (152 lines) from a cross between bread wheat (Triticum aestivum L.) genotypes Berkut [Irene/Babax//Pastor] and Krichauff [Wariquam//Kloka/Pi-tic62/3/Warimek/Halberd/4/3Ag3/Aroona] was used in this study. The rationale for screening this population for plant Cl2 concentration and subsequent QTL detection was that a previous study revealed significantly lower shoot Cl2accumulation in the Krichauff parent than in the Berkut parent [26].
Phenotyping and trait analysis
Growth room and field studies were described previously [24,25]. The data for grain yield, grain number m22, 1000-grain weight, maturity, plant height, seedling biomass, tiller number, chlorophyll content, leaf symptoms and Na+and K+
concentra-tions of penultimate leaves and shoots were reported earlier [24,25]. In the present study shoot and leaf Cl2concentrations of DH population grown in hydroponics and field trials (Roseworthy, Balaklava and Georgetown in South Australia) characterised by low, moderate and high salinity [24] were determined. Either single (hydroponics, two replicates) or 15–20 plants per entry (field trials, two replicates) were sampled for elemental analysis. Shoot (hydroponics) and leaf samples (field trials) were dried at 65uC for 48 h and dry weights recorded. The dried plant samples were then ground and analysed for Cl2, calcium (Ca2+) and magnesium
(Mg2+) concentration using either Inductively Coupled Plasma
Optical Emission Spectrometry (ICP-OES) (ARL 3580 B, Appl. Res Lab. SA, Ecublens, Switzerland) [27,28] or a chloride meter (Model 926, Sherwood, Cambridge, UK). For analysis of Cl2 using the ICP-OES method, 0.1 g of ground shoot sample was extracted with hot (95uC) 4% HNO3 acid in 50 mL capped
polypropylene tubes for 90 minutes, whereas for measurements of Cl2using the chloride meter, 0.5 g of ground sample was digested in 40 mL of 1% HNO3at 85uC for 5 hours in a 54well HotBlock
(Environmental Express, Mt. Pleasant, South Carolina, USA). ICP-OES was used initially for analysis of the Cl2concentration of hydroponically-grown plants, but due to prohibitive cost, leaf samples of field-grown plants were analysed using a chloride meter. As two different analytical methods were used for determination of Cl2 concentration in plant tissues, a number of samples were analysed using both methods, and the high correlation of the measurements between the two methods (hydroponically-grown samples, r2= 0.98, n = 45; field-grown samples, r2= 0.97, n = 15) indicated that the methods were comparable. As single measurements were taken from each extraction, duplicate analysis (one sample per batch of 24) was carried out to determine the homogeneity of the samples, and relative standard deviations between the two measurements were below 5% in all cases. Chloride concentration was expressed on a dry mass basis (mmol kg21
DW).
Linkage map and interval construction
Genotyping and construction of a genetic linkage map for the Berkut/Krichauff population was described earlier [24,25]. The constructed linkage map initially comprised 557 markers across 21 chromosomes. After omission of co-locating markers this was reduced to 403 markers with an average interval distance of 9.16 cM. For computational purposes the alleles of the Berkut (A)/ Krichauff (B) population were then converted into 1 and -1 respectively and missing marker scores were imputed using the flanking marker method of Martinez and Curnow [29]. A total of 384 inferred interval markers were then constructed using the mid-point interval method of Verbyla et al. [30].
Multi-environment analysis
To understand the genetic relationships of the DH lines across the field trials and growth room a multi-environment trials (MET) analysis was conducted for each of the traits Na+, K+and Cl2. For grain yield the MET analysis was restricted to field sites only. The analysis approach follows Smith et al. [31] which involves a linear mixed model including the parsimonious modelling of genetic effects of the DH lines through an appropriate genotype by environment interaction model and also captures non-genetic sources of variation through the use of separate spatial models for A Major Locus for Chloride Accumulation in Wheat
the plot errors at each site. The method initially involves the assessment of the spatial or environmental variation occurring at each site through the investigation of the assumption of variance homogeneity, detection of outliers, and the identification of global trends that may exist across the rows or columns of the experiment. For trends existing due to adjacency of plots in a trial, the model included a separable row by column autoregressive correlation structure. Stronger linear trends in either direction are fitted as fixed effects in the model. Design parameters such as genotypic replication or blocking structures were fitted as separate random effects.
The genotype by environment interaction model involved the use of an unstructured heterogeneous correlation matrix that appropriately captures the genetic relationship of the DH lines between trials. If a strong positive genetic correlation exists between any two trials then the relative performance or rankings of the varieties at each of the trials will be similar. As a consequence these trials will most likely share common or co-locating QTL with a common parent being favoured at each locus. Trials that exhibit little or no genetic correlation between them would exhibit different relative rankings for the varieties and most likely have unshared QTL. Each multi-environment analysis was performed using residual maximum likelihood (REML) and the estimated genetic correlations between sites were extracted for interpretation.
Multivariate analysis
A multivariate linear mixed model analysis of four traits (Na+,
K+, Cl2and grain yield) was conducted for each field trial in order to estimate genetic correlations of the DH lines between traits. A multivariate analysis was also conducted for the traits in the growth room and included Na+, K+, Cl2, and seedling biomass. For each of the trials, estimates of the genetic relationships between DH lines were modelled through the use of a trait by genotype interaction with an unstructured heterogeneous correla-tion matrix. The model also included a separable trait by row by column spatial model for the plot errors with an unstructured heterogeneous correlation matrix for the trait component of the model. This unstructured correlation matrix ensures that traits collected from the same trial are connected phenotypically. This separable structure for the spatial model also assumes that the traits have a common row by column separable autoregressive correlation structure. Similar to the MET models, strong trends for any given trait were captured using the appropriate fixed effects, and random effects were used to model genotypic replication as well as blocking structures existing within each trial. Each multivariate analysis was performed using REML and the estimated genetic correlations between traits were extracted for interpretation.
QTL analysis
For each of the field sites and the growth room the detection and estimation of QTL for the measured traits was accomplished using the R [32] package wgaim [33]. The package is a computational implementation of Verbyla et al. [30,34]. In this approach, an initial base linear mixed model is established that contains non-genetic effects that account for extraneous variation. These include an appropriate spatial model for the errors as well as fixed and random effects that are relevant to the trial being examined. The base model also includes a random effect term that captures the genetic variation between the DH lines. Following Verbyla et al. [34] the base model is then extended by including the complete set of inferred interval markers into the base linear mixed model as a contiguous block of random effects with a single
variance parameter. The significance of this variance parameter is then checked using a simple residual likelihood ratio test. If found significant, an alternative outlier model is formulated and the inferred interval marker with the largest outlier statistic is chosen as a putative QTL. This inferred interval marker is then removed from the contiguous block of random effects and placed as a separate random covariate in the original base model as well as the extended model that includes the remaining set of inferred interval markers. The forward selection process is then repeated until the variance parameter associated with the remaining inferred interval markers is not significant. The complete set of putative QTL selected appears additively as random covariates and is summa-rised using the methods of Verbyla et al. [34]. The summary includes the left and right flanking markers of the individual QTL, their effect sizes, approximate LOD scores as well as individual contributions to the overall genetic variance.
For all traits analysed in the present study, the best linear unbiased predictions of the genotypes were extracted from the base linear model and were used to calculate a generalized (broad-sense) heritability using the formula developed by Cullis et al. [35].
Comparative analysis and candidate genes co-located with the 5A Cl2concentration QTL
To align the genetic position of the 5A Cl2QTL to its physical position in the wheat genome, the sequence of RFLP markers with nearby location to the QTL-flanking SSR markersgwm304 and barc141 were identified using the database GrainGenes 2.0 (wheat.pw.usda.gov). The sequences of co-located RFLP markers bcd21andpsr128were 451 bp and 430 bp, respectively, and were both derived from ESTs (GrainGenes 2.0). The sequences were used for homology searches using the BLAST tool at https://urgi. versailles.inra.fr/blast/blast.php. The search was carried out against the sequences of all bread wheat chromosomes showing the best hits on 5AL, as expected. The gene sequence hits were used for synteny analysis using the Genome Zipper v5 across wheat, rice, Brachypodium and sorghum revealing the syntenic regions between 64 non-rendundant wheat ESTs, Brachypodium chromosome 4, rice chromosome 9 and sorghum chromosome 2. To assign potential functions to the wheat genes underlying the 5A Cl2 QTL interval, all 64 non-redundant wheat ESTs were used as queries for homology searches at the National Center for Biotechnology Information (NCBI) using BLASTN against the non-redundant nucleotide database.
Results
Responses to salinity stress, distributions and relationships between traits
Data on Cl2 concentration provided an opportunity to re-examine the relationships amongst traits associated with ST such Na+and K+accumulation, seedling biomass and grain yield in low
(Balaklava), moderate (Roseworthy) and high (Georgetown and growth room) saline environments [24]. Krichauff had 10–20% lower Na+ concentration than Berkut in field trials, and these
differences diminished in hydroponics, whereas Krichauff had 14– 25% lower Cl2 concentration than Berkut in all environments ranging from 362–669 and 482–775 mmol kg21
DW for Krichauff and Berkut, respectively (Table 1), similar to previous studies [26]. It was interesting to observe that Cl2concentrations were much higher than Na+concentrations. Berkut had slightly
higher K+ concentration than Krichauff but only at low to
moderately saline field trials at Roseworthy and Balaklava (812– 934 and 729–882 mmol kg21
production under salinity stress, Berkut produced 18% higher seedling biomass than Krichauff in hydroponics, whilst Krichauff had 6–7% higher grain yield in field trials (Table 1). In all traits, there was evidence of transgressive segregation.
To determine whether selection for Na+and/or Cl2exclusion or even K+accumulation would lead to improved ST, multivariate
analysis of concentrations of Na+, Cl2, K+, seedling biomass and
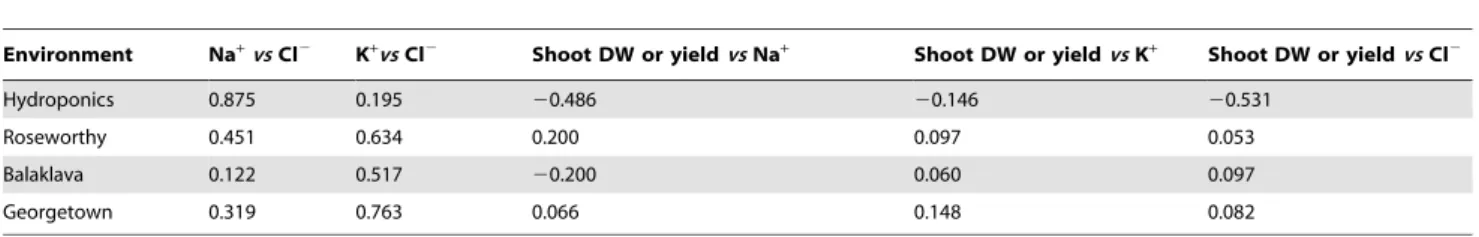
grain yield was performed for each of the environments (Table 2). The analysis showed that there was generally a good estimated correlation between Cl2 and either Na+ or K+ with two
exceptions: there were negligible correlations for Na+ vs Cl2, and K+vs Cl2 at Balaklava and in hydroponics respectively. A negative but moderate correlation was observed between seedling biomass and either Na+(r = 0.479) or Cl2(0.527).
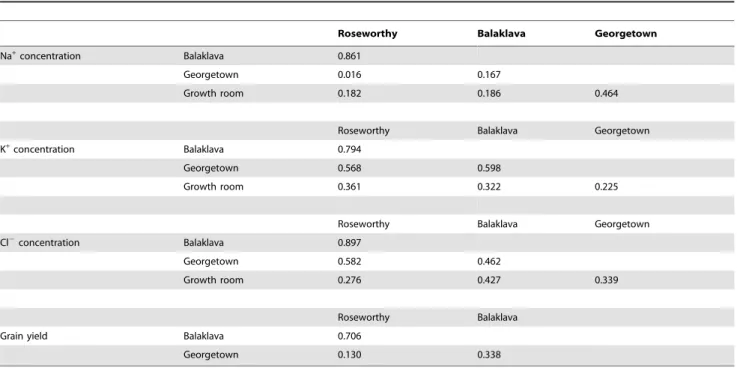
To analyse genotype by environment interaction for each of the measured traits, multi-environment analyses and genetic correla-tions were estimated between environments. Representing low (Balaklava) to moderate (Roseworthy) saline environments, corre-lations for Na+, Ka+, Cl2 concentrations and grain yield were consistently high between these sites whereas low to moderate correlations were observed for these traits between other higher saline environments (Table 3). Therefore, it is reasonable to assume that selection for similar trait values may not be consistent between higher saline sites, indicating environmental effects controlling ion accumulation and grain yield.
Table 1. Parental means, population mean and range for Na+, Cl2, K+, Ca2+and Mg2+concentrations (mmol kg1DW) in penultimate leaves (field trials) and whole shoots (hydroponics), seedling biomass [shoot DW (g plant1)] and grain yield (t ha1) in Berkut/Krichauff DH population tested for ST in hydroponics and field trials (Roseworthy, Balaklava and Georgetown).
Parental Lines DH population
Test environment Trait Berkut Krichauff mean range Heritability h2
Hydroponics Na+conc. 298 295 270 194–361 0.58
(100 mM NaCl,10 dS m1) Cl2conc. 457 376 378 236–480 0.67
K+conc. 771 779 749 661–869 0.82
Shoot DW 1.523 1.296 1.537 1.210–1.835 0.57
Ca2+conc. 107.2 87.3 97.9 77.4–116.7 0.83
Mg2+conc. 94.7 77.5 84.1 73.2–95.1 0.77
Roseworthy Na+conc. 15.2 12.6 12.4 8.8–15.9 0.57
(low salinity, ECe,4 dS m1) Cl2conc. 482 362 393 272–510 0.82
K+conc. 812 729 739 621–847 0.64
Grain yield 2.237 2.392 2.116 1.451–2.489 0.76
Balaklava Na+conc. 13.1 11.6 10.9 7.4–14.5 0.78
(Moderate salinity, ECe = 4–8 dS m1) Cl2conc. 557 447 474 301–598 0.82
K+conc. 934 882 865 749–1011 0.77
Grain yield 2.714 2.888 2.671 1.758–3.035 0.81
Ca2+conc. 121.3 97.2 110.7 71.9–151.4 0.82
Mg2+conc. 77.2 62.2 73.5 52.0–95.1 0.79
Georgetown Na+conc. 20.5 16.3 18.7 10.9–30.4 0.60
(High salinity, ECe.8 dS m1) Cl2conc. 775 669 688 571–884 0.84
K+conc. 1363 1332 1328 1064–1523 0.76
Grain yield 0.645 0.686 0.573 0.277–0.792 0.72
The means represent predicted values from MET (Na+, Cl2, K+) and single environment (Ca2+and Mg2+) analysis of each trait. Broad-sense heritability is also given for
individual traits at each environment. doi:10.1371/journal.pone.0098845.t001
Table 2. Estimated genetic correlations between shoot DW (hydroponics), grain yield (field) Na+, K+, and Cl2(field and hydroponics) extracted from the fitted multi-trait model at each environment.
Environment Na+vsCl2 K+vsCl2 Shoot DW or yieldvsNa+ Shoot DW or yieldvsK+ Shoot DW or yieldvsCl2
Hydroponics 0.875 0.195 20.486 20.146 20.531
Roseworthy 0.451 0.634 0.200 0.097 0.053
Balaklava 0.122 0.517 20.200 0.060 0.097
Georgetown 0.319 0.763 0.066 0.148 0.082
doi:10.1371/journal.pone.0098845.t002
A Major Locus for Chloride Accumulation in Wheat
Generalized (broad-sense) heritability (h2)
Estimates of h2 differed with trait and environment, ranging from moderate to high (0.6–0.8) (Table 1). Amongst the mineral elements, Na+ concentration had the lowest h2
, while Cl2 concentration had the highesth2. Heritability of shoot DW (0.6) was lower than that of grain yield (0.7–0.8). Heritability of individual traits across environments showed relatively consistent (Ca2+, Mg2+and Cl2concentration) to inconsistent patterns (Na+
concentration). As reported earlier [24], consistently higher h2 values indicate greater ability for selection for the traits, while lower and variable h2 suggest the presence of substantial environmental effects, difficulty for direct selection, and the need for more replications.
QTL for Cl2concentration
In the initial analysis in which differences in phenology were not included, there were few Cl2concentration QTL co-locating with QTL for maturity on 5A and 5D (data not shown). Similar to Bonneau et al. [36], after the known differences in the genetic component of the phenology were addressed by fixing the maturity genes in the analyses, 14 QTL were identified (Table 4). However, most QTL were specific to single environments, and only three QTL were detected in two or more environments (3A, 5A, 7D) indicating some genotype by environment interaction. Interest-ingly, there were no co-located QTL controlling trait variation from hydroponics and field trials. The most significant QTL in hydroponics on chromosome 2A explained 20% of the total genetic variance and the Krichauff allele was responsible for increased Cl2 concentration. QTL on chromosome 3A and 7D were detected from multi-location trials and explained 4–11% of the total genetic variance, while QTL on 5A accounted for 27-32% of the total genetic variance (Table 4). Either the Berkut (3A, 5A) or the Krichauff (7D) allele was associated with increased Cl2 concentration at these loci. As the two QTL on 5A appear in tandem, these loci were further investigated to determine whether there may just be one rather than two separate QTL. The plot of
outlier statistics (Figure 1) shows that there is in fact just one QTL on 5A expressed at all field locations. The QTL detected at one location only accounted for a small proportion of the total genetic variance, varying from 3.6 to 9.9% with either the Berkut or Krichauff allele being associated with increased Cl2concentration (Table 4).
Some QTL for Cl2 concentration were co-located with QTL for either Na+or K+ concentration from hydroponics and field
trials (Table 4). It was interesting to observe that in hydroponics QTL for Cl2 concentration were co-located with QTL for Na+
concentration (2A, 2B, 2B, 3A, 7A), while in field trials they were co-located with both Na+(3A, 5A, 7D) and K+(5A).
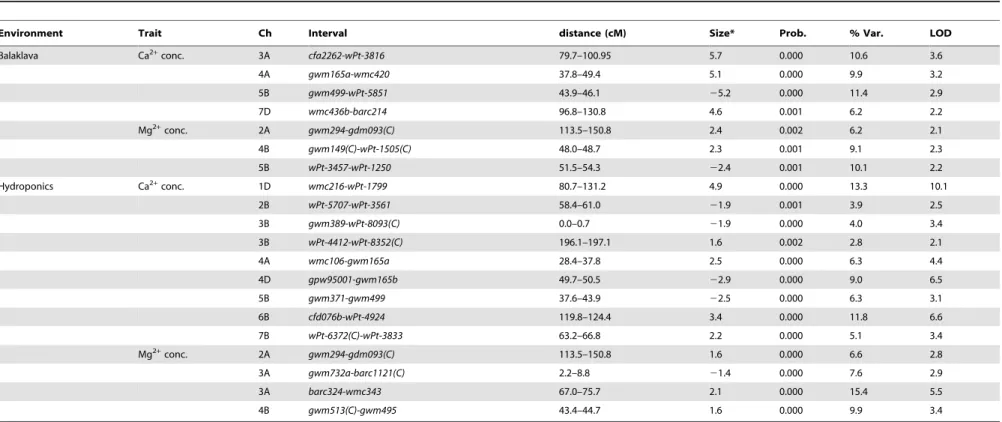
QTL for calcium (Ca2+) and magnesium (Mg2+) concentration
As Ca2+and Mg2+nutrition of the plant can also be affected by
salinity [26,37–40], their genetic control under salinity stress was also investigated, in a limited way, using a QTL mapping approach. A total of 13 QTL for Ca2+concentration and 6 QTL
for Mg2+ concentration were identified in hydroponics and the
field (Table 5). At those loci, either the Berkut or Krichauff allele increased the concentration of these cations. The most significant QTL for Ca2+ concentration was the QTL in hydroponics
accounting for 13% of the genetic variance (Table 5). This QTL was also co-located with the Cl2concentration QTL detected in hydroponic conditions (Table 4). For Mg2+ concentration, the
QTL on 3A in hydroponics was the most significant, explaining 15% of the genetic variance (Table 5). This QTL was also co-located with a QTL for Cl2 concentration detected in environ-ments with low to moderately saline conditions (Roseworthy and Balaklava) and hydroponics e (Table 4). However, there were no common QTL that were detected under hydroponics and the field for either of these two cations.
Table 3. Estimated genetic correlations extracted from the fitted multi-environment model for individual traits.
Roseworthy Balaklava Georgetown
Na+concentration Balaklava 0.861
Georgetown 0.016 0.167
Growth room 0.182 0.186 0.464
Roseworthy Balaklava Georgetown
K+concentration Balaklava 0.794
Georgetown 0.568 0.598
Growth room 0.361 0.322 0.225
Roseworthy Balaklava Georgetown
Cl2concentration Balaklava 0.897
Georgetown 0.582 0.462
Growth room 0.276 0.427 0.339
Roseworthy Balaklava
Grain yield Balaklava 0.706
Georgetown 0.130 0.338
Table 4. QTL associated with Cl2concentration in hydroponics and field trials (Roseworthy, Balaklava and Georgetown) under varying degrees of salinity stress.
Environment Ch Interval
Distance
(cM) Size* Prob. % Var. LOD **Co-locations with Na+or K+in field locations and hydroponics reported earlier [24,25]
Roseworthy 2B cfd011- gwm374(C) 88.0–95.8 212.5 0.001 4.1 2.4
3A wmc343- cfa2262 75.7–79.7 20.6 0.000 11.1 6.4
3B wPt-9049(C)- wPt-0021 124.4–154.0 13.4 0.002 3.6 2.1
5A barc56/gwm186 90.0–100.5 36.8 0.000 32.4 18.3 Na+-GT, K+-RW, K+-BA, K+-GT
6D cfd005(C)- gpw95010(C) 172.8–174.1 211.7 0.001 3.9 2.4
7D barc214- gwm437 130.8–133.5 211.3 0.002 3.6 2.0 Na+-RW, Na+- RH, Na+-WT
7D wmc014a- wPt-0695 243.5–246.4 211.3 0.002 3.6 2.1
Balaklava 3A barc324- wmc343 67.0–75.7 9.4 0.002 4.4 2.2
3B gwm247- wPt-4412 195.1–196.1 13.9 0.000 9.9 4.8
5A gwm156(C)- gwm304 84.1–89.3 25.4 0.000 30.8 14.8
Georgetown 5A barc56- gwm186 90.0–100.5 30.7 0.000 27 11.1
7B 6cg1- wPt-7318 0.0–22.7 214.5 0.000 5.4 2.9
7D barc214- gwm437 130.8–133.5 13.2 0.001 5.7 2.6
Hydroponics 1D wmc216- wPt-1799 80.7–131.2 21.3 0.002 5.8 2.0
2A wPt-3114- wmc170(C) 92.5–109.9 233.5 0.000 21.1 7.1 Na+- HYDRO, Na+-RW, Na+-BA
2B wmc272- barc349 106.5–112.7 219.4 0.000 8.5 2.7 Na+-HYDRO
2B wPt-7859- wPt-7161 198.9–200.2 18.9 0.000 8.4 2.9 Na+-HYDRO
3A barc324- wmc343 67.0–75.7 17.4 0.001 6.7 2.3 Na+-RW
7A gwm282- wPt-0961(C) 170.2–183.3 219.3 0.000 7.8 2.7 Na+-HYDRO
Only those intervals withPvalues#0.01 and LOD.2.0 are presented. Field locations Roseworthy, Balaklava and Georgetown were classified as low, moderate and high salinity, respectively. Please see Genc et al. [24] for soil salinity classification.
*Positive and negative values indicate that Berkut and Krichauff alleles increased the phenotypic values, respectively. **The same co-locations appearing at multiple environments were presented only once. Abbreviations; Hydroponics = HYDRO, Balaklava = BA; Georgetown = GT; Roseworthy = RW. QTL names with letter C indicate several co-locating markers at those loci.
doi:10.1371/journal.pone.0098845.t004
A
Major
Locus
for
Chloride
Accum
ulation
in
Wheat
PLOS
ONE
|
www.ploson
e.org
6
June
2014
|
Volume
9
|
Issue
6
|
Known chloride transporters/channel in grass genomes and the 5A Cl2QTL’
In previous studies, employing transcription analysis under salt stress, cellular localization and transgenesis for functional charac-terization, CLC (chloride channel) and CCC (cation chloride co-transporter) genes had been identified to play a role in Cl2 homoeostasis in plants; examples are CLC1 in tobacco and soybean [13,41,42,43] and CCC in Arabidopsis [44].
To investigate the presence of candidate genes such as CLCs, CCCs and other ion transporters within the QTL interval on chromosome 5A, we physically positioned the 5A Cl2 concentra-tion QTL in the wheat genome sequence. For this purpose, the gene-based sequences of RFLP markers, bcd21 and psr128 with close linkage to the QTL-flanking SSR markers gwm304 and barc141(Figure 2) were used to find wheat genome sequences. As expected, both RFLP sequences had their best hits in bread wheat chromosome 5AL and allowed to retrieve matching contigs of 4.2 kb and 9.1 kb for bcd21 and psr128, respectively. As both RFLPs had originally been derived from ESTs, the corresponding wheat genome contigs (4.2 and 9.1 kb) identified gene hits in rice chromosome 9 (Os09g0321900 and Os09g0412200). These rice genes functioned as borders of the physical interval in the comparative analysis between rice,Brachypodiumand wheat using the alignment in Genome Zipper v5 (Figure 2). In rice (MSU Release 7 at rice.plantbiology.msu.edu/cgi-bin/gbrowse/rice/
#search), the syntenic interval contained 547 genes.
Within the physical interval underlying the 5A Cl2QTL, there were five different classes of genes encoding different transporters or channels: eleven ABC-transporter genes, and single genes encoding a nucleobase-ascorbate transporter, a vacuolar iron transporter (VIT1), a voltage-dependent anion channel (VDAC1) and a potassium transporter (HKT23-like) (Table 6).
Discussion
Implications of screening for Cl2concentration in
hydroponics and field environments
Phenotyping for ST is generally conducted under hydroponic conditions, and results are rarely validated in relevant field environments. Our recent studies in bread wheat demonstrated that phenotyping for Na+ exclusion or ST in hydroponics had
limited value in predicting field responses, and QTL differed vastly between hydroponics and field locations [24]. Given the renewed interest in Cl2 exclusion and ST [13], we analysed Cl2 concentration of hydroponically- and field-grown plants of Berkut/Krichauff DH population to determine the value of hydroponics for QTL analysis of Cl2concentration, and elucidate genetic control mechanisms of Cl2 accumulation. The results demonstrated that plant Cl2 accumulation varied significantly between hydroponics and field trials and as a result, different QTL were identified between the two systems. As was the case with Na+
concentration [24,25], this was most probably due to the two systems being vastly different [24]. These results suggest that there may be very little value in hydroponics testing to predict field responses to Cl2concentration in bread wheat, and future studies should consider field testing or soil-based-pot assays as an alternative.
ST and Na+or Cl2exclusion
In most studies to date Na+exclusion, and to a limited extent
Cl2exclusion, are traits contributing to ST. However, studies that also examined relationships between ST (absolute or relative growth) and Na+ or Cl2 concentration reported inconsistent correlations [3–8,10,12,45–48]. It is noteworthy that studies reporting high correlations (r2.0.5) analysed either a small
Figure 1. Location of Cl2concentration QTL (barc56/gwm186) on chromosome 5A detected in field trials (Balaklava, Georgetown and Roseworthy) with varying salinity levels.The outlier statistics represent LOD scores (Table 4).
Table 5. QTL associated with Ca2+and Mg2+concentrations in hydroponics and in a field trial (Balaklava) under varying degrees of salinity stress.
Environment Trait Ch Interval distance (cM) Size* Prob. % Var. LOD
Balaklava Ca2+conc. 3A cfa2262-wPt-3816 79.7–100.95 5.7 0.000 10.6 3.6
4A gwm165a-wmc420 37.8–49.4 5.1 0.000 9.9 3.2
5B gwm499-wPt-5851 43.9–46.1 25.2 0.000 11.4 2.9
7D wmc436b-barc214 96.8–130.8 4.6 0.001 6.2 2.2
Mg2+conc. 2A gwm294-gdm093(C) 113.5–150.8 2.4 0.002 6.2 2.1
4B gwm149(C)-wPt-1505(C) 48.0–48.7 2.3 0.001 9.1 2.3
5B wPt-3457-wPt-1250 51.5–54.3 22.4 0.001 10.1 2.2
Hydroponics Ca2+conc. 1D wmc216-wPt-1799 80.7–131.2 4.9 0.000 13.3 10.1
2B wPt-5707-wPt-3561 58.4–61.0 21.9 0.001 3.9 2.5
3B gwm389-wPt-8093(C) 0.0–0.7 21.9 0.000 4.0 3.4
3B wPt-4412-wPt-8352(C) 196.1–197.1 1.6 0.002 2.8 2.1
4A wmc106-gwm165a 28.4–37.8 2.5 0.000 6.3 4.4
4D gpw95001-gwm165b 49.7–50.5 22.9 0.000 9.0 6.5
5B gwm371-gwm499 37.6–43.9 22.5 0.000 6.3 3.1
6B cfd076b-wPt-4924 119.8–124.4 3.4 0.000 11.8 6.6
7B wPt-6372(C)-wPt-3833 63.2–66.8 2.2 0.000 5.1 3.4
Mg2+conc. 2A gwm294-gdm093(C) 113.5–150.8 1.6 0.000 6.6 2.8
3A gwm732a-barc1121(C) 2.2–8.8 21.4 0.000 7.6 2.9
3A barc324-wmc343 67.0–75.7 2.1 0.000 15.4 5.5
4B gwm513(C)-gwm495 43.4–44.7 1.6 0.000 9.9 3.4
Only those intervals withPvalues#0.01 and LOD.2.0 are presented. Balaklava location was classified as moderate salinity. Please see Genc et al. [24] for soil salinity classification.
*Positive and negative values indicate that Berkut and Krichauff alleles increased the phenotypic values, respectively. QTL names with letter C indicate several co-locating markers at those loci.
doi:10.1371/journal.pone.0098845.t005 AMajor
Locus
for
Chloride
Accum
ulation
in
Wheat
PLOS
ONE
|
www.ploson
e.org
8
June
2014
|
Volume
9
|
Issue
6
|
number of genotypes or were conducted under controlled environmental conditions [4,7,12,46,49]. In the present study genetic correlations were investigated using multivariate analysis. Moderate correlations in controlled environments (generally phenotypic) are not uncommon [13,21–23,25], while such correlations involving a large number of genotypes in the field are almost non-existent [24]. The lack of genetic correlation between Na+and/or Cl2exclusion and grain yield in field studies suggests that other biochemical and physiological processes need to be taken into consideration for identifying mechanisms associated with ST. These results also indicate that a reductionist approach, such as selection for Na+and/or Cl2 exclusion only, may not substantially improve ST in bread wheat. A more reliable approach would be to select for grain yield, unless specific physiological traits are shown to have significant and consistent correlations with grain yield under saline environments.
Ion channels and transporters involved in Na+, K+and Cl2
homeostasis
Here we aim to introduce a brief discussion on transport of these ions from the soil solution into the root cell and their movements within the plant with respect to ion channels and transporters. However, a greater focus will be placed on Cl2, and for Na+and K+, readers are referred to recent reviews [41,50,51].
It is well established that the initial entry of Na+ from the soil
solution into the root cell is passive along the concentration gradient [52], and Na+uptake occurs primarily via non-selective
cation channels and transporters [41,51,53]. However, Na+efflux
(from cytosol into vacuole or removal from xylem) as a tolerance mechanism has to be active as it requires energy [41]. Potassium uptake from the soil solution into the root cell is an active process (i.e. moving across the membrane against its concentration gradient) and largely mediated by genes encoding channels and transporters [54]. Chloride uptake can be both active and passive depending on the external concentration. Under non-saline conditions transport of negatively charged Cl2 across negatively charged plasma membrane requires energy, therefore is an active process and mediated by transporters, while under saline conditions most Cl2influx across the plasma membrane becomes passive [14]. However, its movement within or out of the plant must be active and aided by transporters [13]. Despite being the most abundant anion in the plant cells, compared to a number of well characterised Na+and K+transporters and encoding genes
[41], very little is known about Cl2transport mechanisms and the genes involved. To date two groups of gene families have repeatedly been discussed in relation to Cl2 homeostasis: CLCs and CCCs. From limited studies, it appears that CLCs, with their location in endomembranes, are involved in turgor regulation, stomatal movement and NO32 transport [55] but not root Cl2
uptake [41], while CCCs are involved in long distance transport of Na+, K+ and Cl2 and function as K+:Cl2, Na+:Cl2 or Na+:
Figure 2. Inferred physical position of the Cl2concentration QTL on 5AL in Berkut/Krichauff identified at Roseworthy field location onto 5AL in wheat.
K+:Cl2 co-transporters [44,56]. However, there may be other gene families involved in Cl2transport, as discussed by Teakle and Tyerman [13].
Genetic control mechanisms of Na+, K+and Cl2homeostasis under salinity stress
A good understanding of inheritance of homeostasis of these ions is required for a successful breeding strategy. Our present knowledge of mechanisms of their inheritance is a mere reflection of the number of studies conducted on them. For instance, due to greater focus on Na+, we know more about Na+than K+or Cl2. The limited studies in rice and wheat suggest that Na+and K+
homeostasis under salinity stress are under separate genetic control [25,57–59], although studies in barley [22,23] found that QTL for Na+co-located with QTL for K+, suggesting one or more genes
regulating Na+ and/or K+ transport such as vacuolar
sodium-hydrogen antiporter (NHX) genes [22]. As for Cl2, to date there have been only four quantitative genetic studies that reported QTL for Cl2concentration; two in rice [20,21] and two in barley [22,23]. In those studies as well as in the present study, moderate correlations between Cl2 and either Na+or K+, and QTL for
different ions mapping to the same and/or different regions indicate the presence of common (i.e. CCCs) and specific transporters for the uptake of these ions [i.e. high-affinity potassium (HKT) and (CLCs)] which in turn suggests common and separate genetic control. For instance, in the present study, Cl2 QTL on 2A and 5A co-located with QTL for Na+and K+
concentration, respectively [24]. A physiological explanation for these co-locations and correlations between cations (Na+and K+)
and anions (Cl2) may be the charge balance between these two groups of ions since the net movement of ions must be balanced so that there is charge equivalence with small difference [13]. Whereas there were no CCC and CLC genes physically close to the Cl2 concentration QTL on chromosome 5A there are 15 transporter and channel genes in the physical interval as candidates for the observed Cl2accumulation. Although we have used the latest release of the comparison between wheat ESTs and contigs with sequenced grass genomes (Genome Zipper v5), it is possible that other genes reside in this region in wheat and the microsynteny is less well preserved as it appears to be so far.
Nguyen et al. [22] recently reported a Cl2concentration QTL under salt stress in barley but used an incorrect barley chromosome nomenclature so that the actual chromosome 5H was mislabelled as 7H (other chromosomes were also mislabelled). The physical position of the RFLP markersABC324andABC302 that flank their barley Cl2QTL on 5HL [22] suggest a position close to the physical chromosomal region corresponding to the 5AL Cl2concentration QTL reported here. In fact, the physical position of the northern flanking marker ABC324 (position chromosome 5H: 399,222,591) slightly overlaps with the position of the southern end of the5A QTL flanked by RFLP marker psr128(position chromosome 5H: 412,653,548). It is possible that both QTL are caused by orthologous genes in wheat and barley, although this is far from certain as the QTL intervals contain hundreds of genes and the barley QTL was identified under salt stress in a hydroponics system whereas the QTL in wheat was repeatedly observed under salt stressed field conditions but not in hydroponics. Only further work such as fine mapping and gene expression analysis of the candidate genes will prove unequivocally Table 6. Candidate genes underlying the physical interval of the Cl2QTL on chromosome 5A.
Brachypodium(v1.2)
Rice (Gene ID at MSUa/at IRGSP
v2) Sorghum (v1.4) Wheat (v5b) Predicted protein functiona
- - Sb02g022750 - ABC transporter
Bradi4g28660 LOC_Os09g19734/OS09G0361400 Sb02g022910 WHE0957_E03_J05ZT; Traes_5AL_99BEC1C3B
Voltage dependent anion channel 1 (VDAC1)
Bradi4g29102 LOC_Os09g20480/Os09g0371000 Sb02g023340 Traes_5AL_F8B48EC59 ABC transporter
Bradi4g29110 LOC_Os09g20490/Os09g0371100 Sb02g023370 - ABC transporter
Bradi4g29120 ‘‘ Sb02g023380 - ‘‘
Bradi4g29110 LOC_Os09g20500/Os09g0371200 Sb02g023370 - ABC transporter
Bradi4g29120 ‘‘ Sb02g023380 - ‘‘
Bradi4g29140 LOC_Os09g20510/Os09g0371300 Sb02g023360 - ABC transporter
Bradi4g29110 LOC_Os09g20520/Os09g0371400 Sb02g023370 - ABC transporter
Bradi4g29120 ‘‘ Sb02g023380 - ‘‘
Bradi4g29347 LOC_Os09g21000/Os09g0376900 Sb02g023620 Traes_5AL_B64648FE6 Potassium transporter family (HKT23-like)
Bradi4g29440 LOC_Os09g21340/Os09g0381100 Sb02g023720 WHE1104_A05_B10ZS; WHE0807_A06_B11ZS; Traes_5AL_3E0C865DF
Nucleobase-ascorbate transporter
Bradi4g29650 LOC_Os09g23110/Os09g0394500 Sb02g024060 Traes_5AL_01A13992D; Traes_5AL_B8B668113
ABC transporter
Bradi4g29720 LOC_Os09g23300/Os09g0396900 Sb02g024130 WHE1787_E02_I03ZS; Traes_5AL_F80B422BA
Vacuolar iron transporter 1 (VIT1)
Bradi4g29810 LOC_Os09g23640/Os09g0401100 - Traes_5AL_678EA44B2 ABC transporter
aaccording to MSU Rice Genome Annotation Project release 7, Ensembl Plants release 22 or NCBI; bGenome Zipper v5.
doi:10.1371/journal.pone.0098845.t006
A Major Locus for Chloride Accumulation in Wheat
the identity of the underlying gene for the differential Cl2 accumulation between Berkut and Krichauff. The present study provides a compelling case that the 5A QTL contains a K+:Cl2 co-transporter gene several other candidates capable of moving Cl2ions across membranes. However, as this is the first report in wheat, there is clearly a need for testing other mapping populations and genetics resources to identify other Cl2 transporter gene(s) to gain a better understanding of genetic control mechanisms of Cl2homoeostasis in crops.
Genetic control mechanisms of Ca2+and Mg2+ accumulation under salinity stress
The inheritance of plant Ca2+and Mg2+accumulation was also
investigated, given the reports of salinity-induced nutritional deficiencies such as Ca2+ and Mg2+ [26,37,39,40] and the
importance of maintenance of adequate nutrition for these essential elements to plant growth and yield under salinity stress. To our knowledge, there have only been two studies in barley [22,23] that investigated inheritance of Ca2+and Mg2+uptake or
accumulation under salinity stress. However, only in one study [23] QTL for Ca2+and Mg2+were detected under salinity stress;
one QTL for Mg2+concentration on 6H, and three QTL for Ca2+
concentration on 1H, 6H and 7H. The QTL on 6H was common not only to Ca2+and Mg2+but also to ST. To our knowledge, this
is the first time in the literature that a QTL for a nutrient other than Na+was co-located with ST, providing evidence for the role
of Ca2+ and Mg2+ nutrition in growth and yield under salinity
stress. These results also indicate that Ca2+and Mg2+uptake may
occur through common as well as independent pathways. In contrast to the barley study, in the present study, none of the Ca2+
and Mg2+concentration QTL co-located with each other or ST
(measured as seedling biomass or grain yield), suggesting independent genetic control. However, further studies are required to enable better understanding of their genetic control mechanisms.
Conclusions
As was the case with Na+[24], plant Cl2responses and related QTL differed widely between hydroponics and field tests, indicating substantial genotype and QTL interactions with environments. The results also indicated that hydroponics-based seedling assays may be very limited in their ability to predict field
responses to salinity, and soil-based assays may be the second best option after field testing. As Cl2 concentration in the plant correlated only moderately with seedling biomass and showed no correlation with grain yield in the field, it does not appear, on its own, to be a reliable physiological parameter to select for in a breeding context, at least in bread wheat. Further research involving other mapping populations/genetic resources is war-ranted to be definitive. In the short term, selection for grain yield, which is integrative of all tolerance mechanisms, appears a more reliable strategy, while in the long term identification of donors for various physiological traits and subsequently combining them in a genotype (pyramiding) is likely to be the way forward [60]. This latter process can be fast-tracked via marker assisted selection. Finally the presence of several QTL for Cl2 concentration indicates that Cl2uptake/accumulation is a polygenic trait. The discovery of a major QTL for Cl2concentration on 5A that co-locates with several candidate genes that could be involved in Cl2 transport in bread wheat provides a starting point for further analysis through fine mapping and functional studies.
Acknowledgments
We would like to thank Dr Hugh Wallwork (South Australian Research and Development Institute) for access to the Berkut/Krichauff DH population and the coordination of the field trials, the staff at Australian Grain Technologies, the LongReach Plant Breeders, the University of Adelaide Barley Breeding Program and Mr Jim Lewis (South Australian Research and Development Institute) for sowing, harvesting and general maintenance of the field trials, Mr Robin Hosking (the Australian Centre for Plant Functional Genomics) for his construction and creative modification of the supported hydroponic system and technical support throughout this project, Mrs Teresa Fowles and Mr Lyndon Palmer (the University of Adelaide) for their help with ICP-OES analysis, Prof. Mark Tester (Australian Centre for Plant Functional Genomics) for the use of a chloride meter, Drs Graham Lyons and John Harris (the University of Adelaide) for their critical review of the manuscript prior to submission, and the editor and the reviewers for their helpful comments.
Author Contributions
Conceived and designed the experiments: YG JT JR KO. Performed the experiments: YG JR KO. Analyzed the data: YG JT KO.
References
1. Martinez-Beltran J, Manzur CL (2005) Overview of salinity problems in the world and FAO strategies to address the problem. In Proceedings of the international salinity forum; Riverside, California. pp. 311–313.
2. Schachtman DP, Munns R, Whitecross MI (1991) Variation in sodium exclusion and salt tolerance inTriticum tauschii. Crop Science 31: 992–997.
3. Ashraf M, O’Leary JW (1996) Responses of newly developed salt-tolerant genotype of spring wheat to salt stress: yield components and ion distribution. Journal of Agronomy and Crop Science 176: 91–101.
4. Rashid A, Querishi RH, Hollington PA, Wyn Jones RG (1999) Comparative responses of wheat cultivars to salinity at the seedling stage. Journal of Agronomy and Crop Science 182: 199–207.
5. Poustini K, Siosemardeh A (2004) Ion distribution in wheat cultivars in response to salinity stress. Field Crops Research 85: 125–133.
6. Hollington PA (2000) Technological breakthroughs in screening/breeding wheat varieties for salt tolerance. In: Gupta SK, Sharma SK, Tyagi NK, editors. National Conference on Salinity Management in Agriculture. Central Soil Salinity Research Institute, Karnal, India. pp. 273–289.
7. Huang Y, Zhang G, Wu F, Chen J, Zhou M (2006) Differences in physiological traits among salt-stressed barley genotypes. Communications in Soil Science and Plant Analysis 37: 567–570.
8. Ashraf M, McNeilly T (1988) Variability in salt tolerance of nine spring wheat cultivars. Journal of Agronomy and Crop Science 160: 14–21.
9. Bagci SA, Ekiz H, Yilmaz A (2007) Salt tolerance of sixteen wheat genotypes during seedling growth. Turkish Journal of Agriculture and Forestry 31: 363– 372.
10. Genc Y, McDonald GK, Tester M (2007) Reassessment of tissue Na+
concentration as a criterion for salinity tolerance in bread wheat. Plant, Cell and Environment 30: 1486–1498.
11. Royo A, Aragu¨e´s R (1999) Salinity-yield response functions on barley genotypes assessed with a triple line source sprinkler system. Plant and Soil 209: 9–20. 12. El-Hendawy S, Hu Y, Schmidhalter U (2005) Growth, ion content, gas
exchange and water relations of wheat genotypes differing in salt tolerances. Australian Journal of Agricultural Research 56: 123–134.
13. Teakle NL, Tyerman SD (2010) Mechanisms of Cl2transport contributing to salt tolerance. Plant, Cell and Environment 33: 566–589.
14. White PJ, Broadley MR (2001) Chloride in soils and its uptake and movement within the plant: A Review. Annals of Botany 88: 967–988.
15. Kingsbury R, Epstein E (1986) Salt sensitivity in wheat. A case for specific ion toxicity. Plant Physiology 80: 651–654.
16. Martin P, Koebner R (1995) Sodium and chloride ions contribute synergistically to salt toxicity in wheat. Biologia Plantarum 37: 265–271.
17. Tavakkoli E, Rengasamy P, McDonald GK (2010) The response of barley to salinity stress differs between hydroponics and soil systems. Functional Plant Biology 37: 621–633.
18. Munns R, Tester M (2008) Mechanisms of salinity tolerance. Annual Review of Plant Biology 59: 651–681.
19. Xu G, Magen H, Tarchitzky J, Kafkafi U (2000) Advances in chloride nutrition. Advances in Agronomy 68: 96–150.
20. Ammar MHM, Pandit A, Singh RK, Sameena S, Chaucan MS, et al. (2009) Na+, K+and Cl2ion concentrations in salt tolerantIndicarice variety CSR27. Journal of Plant Biochemistry and Biotechnology 18: 139–150.
21. Pandit A, Rai V, Bal S, Sinha S, Kumar V, et al. (2010) Combining QTL mapping and transcriptome profiling of bulked RILs for identification of functional polymorphism for salt tolerance genes in rice (Oryza sativa L.). Molecular Genetics and Genomics 284: 121–136.
22. Nguyen VL, Ribot SA, Dolstra O, Niks RE, Visser RGF, et al. (2013) Identification of quantitative trait loci for ion homeostasis and salt tolerance in barley (Hordeum vulgareL). Molecular Breeding 31: 137–152.
23. Nguyen VL, Dolstra O, Malosetti M, Kilian B, Graner A, et al. (2013) Association mapping of salt tolerance in barley (Hordeum vulgareL). Theoretical and Applied Genetics. DOI.10.1007/s00122-013-2139-0.
24. Genc Y, Oldach K, Gogel B, Wallwork H, McDonald GK, et al. (2013) Quantitative trait loci for agronomical and physiological traits for a bread wheat population grown in environments with a range of salinity levels. Molecular Breeding 32: 39–59. DOI: 10.1007/s110320139851y.
25. Genc Y, Oldach K, Verbyla A, Lott G, Hassan M, et al. (2010) Sodium exclusion QTL associated with improved seedling growth in bread wheat under salinity stress. Theoretical and Applied Genetics 121: 877–894.
26. Genc Y, Tester M, McDonald GK (2010) Calcium requirement of wheat in saline and non-saline conditions. Plant and Soil 327: 331–345.
27. Wheal MS, Palmer LT (2010) Chloride analysis of botanical samples by ICPOES. Journal of Analytical Atomic Spectrometry 25: 1946–1952. 28. Wheal MS, Fowles TO, Palmer LT (2011) A cost effective acid digestion method
using closed polypropylene tubes for inductively coupled plasma optical emission spectrometry (ICP-OES) analysis of plant essential elements. Analytical Methods 3: 2854–2863.
29. Martinez O, Curnow RN (1992) Estimating the locations and sizes of the effects of quantitative trait loci using flanking markers. Theoretical and Applied Genetics 85: 480–488.
30. Verbyla AP, Cullis BR, Thompson R (2007) The analysis of QTL by simultaneous use of the of the full linkage map. Theoretical and Applied Genetics 116: 95–111.
31. Smith A, Cullis BR, Thompson R (2001) Analysing variety by environment data using multiplicative mixed models. Biometrics 57: 1138–1147.
32. R Development Core Team (2013) R: A language and environment for statistical computing, R Foundation for Statistical Computing. Vienna, Austria. 33. Taylor JD, Diffey S, Verbyla AP, Cullis BC (2013) wgaim: Whole Genome Average Interval Mapping for QTL detection using mixed models, R package version 1.3–0.
34. Verbyla AP, Taylor JD, Verbyla KL (2012) RWGAIM: An efficient high dimensional random whole average (QTL) interval mapping approach. Genetics Research 94: 291–306.
35. Cullis BR, Smith AB, Coombes NE (2006) On the design of early generation variety trials with correlated data. Journal of Agricultural, Biological and Environmental Statistics 11:381–393.
36. Bonneau J, Taylor J, Parent B, Bennett D, Reynolds M, et al. (2013) Multi-environment analysis and improved mapping of a yield-related QTL on chromosome 3B of wheat. Theoretical and Applied Genetics 126: 747–761. 37. Ehret DI, Redmann RE, Harvey BL, Cipywnyk A (1990) Salinity-induced
calcium deficiencies in wheat and barley. Plant and Soil 128: 143–151. 38. Bergmann W (1992) Nutritional disorders of plants: Developments, visual and
analytical diagnosis. Gustav Fisher, Jena, Stuttgart, New York.
39. Cramer GR (2002) Sodium-calcium interactions under salinity stress. In: Lauchli A, Luttge U, editors. Salinity: Environment- plants- molecules. Kluwer, Dordrecht. pp. 205–227.
40. Adcock KG, Gartrell JW, Brennan RF (2001) Calcium deficiency of wheat grown in acidic sandy soil from Southwestern Australia. Journal of Plant Nutrition 24: 1217–1227.
41. Mian AA, Senadheera P, Maathuis FJ (2011) Improving crop salt tolerance: anion and cation transporters as genetic engineering targets. Plant Stress 5: 64– 72.
42. Lurin C, Geelen D, Barbier-Brygoo H, Guern J, Maurel C (1996) Cloning and functional expression of a plant voltage-dependent chloride channel. Plant Cell 8: 701–711.
43. Wong TH, Li MW, Yao XQ, Lam HM (2013) The GmCLC1 protein from soybean functions as a chloride ion transporter. Journal of Plant Physiology 170: 101–104.
44. Colemenero-Flores JM, Martinez G, Gamba G, Vazuez N, Iglesias DJ, et al. (2007) Identification and functional characterization of cation-chloride cotran-sporters in plants. Plant Journal 50: 278–292.
45. Isla R, Royo A, Aragu¨e´s R (1997) Field screening of barley cultivars to soil salinity using a sprinkler and a drip irrigation system. Plant and Soil 197: 105– 117.
46. Khan MA, Shirazi MU, Khan MA, Mujtaba SM, Islam E, et al. (2009) Role of proline, K/Na ratio and chlorophyll content in salt tolerance of wheat (Triticum aestivumL.). Pakistan Journal of Botany 41: 633–638.
47. Rawson HM, Richards RA, Munns R (1988) An examination of selection criteria for salt tolerance in wheat, barley and triticale genotypes. Australian Journal of Agricultural Research 39: 759–772.
48. Salam A, Hollington PA, Gorham J, Wyn Jones RG, Gliddon C (1999) Physiological genetics of salt tolerance in wheat (Triticum aestivumL): Performance of wheat varieties, inbred lines and reciprocal F1hybrids under saline conditions. Journal of Agronomy and Crop Science 183: 145–156.
49. Munns R, James RA (2003) Screening methods for salinity tolerance: a case study with tetraploid wheat. Plant and Soil 253: 201–218.
50. Maathuis FJM, Amtmann A (1999) K+
Nutrition and Na+
Toxicity: The Basis of Cellular K+
/Na+
Ratios. Annals of Botany 84: 123–133.
51. Tester M, Davenport R (2003) Na+tolerance and Na+transport in higher plants.
Annals of Botany 91: 503–527.
52. Cheeseman JM (1982) Pump-leak sodium fluxes in low salt corn roots. Journal of Membrane Biology 70: 157–164.
53. Byrt CS, Platten JD, Spielmeyer W, James RA, Lagudah ES, et al. (2007) HKT1;5-like cation transporters linked to Na+exclusion loci in wheat,Nax2and
Kna1. Plant Physiology 143: 1918–1928.
54. Horie T, Brodsky DE, Costa A, Kaneko T, Schiavo FL, et al. (2011) K+
transport by the OsHKT2;4 transporter from rice (Oryza sativa) with atypical Na+
transport properties and competition in permeation of K+
over Mg2+
and Ca2+
ions. Plant Physiology 156: 1493–1507.
55. Hechenberger M, Schwappach B, Fischer WN, Frommer WB, Jentsch TJ, et al. (1996) A family of putative chloride channels from Arabidopsis and functional complementation of a yeast strain with a CLC gene disruption. Journal of Biological Chemistry 271: 33632–33638.
56. Kong X-Q, Gao X-H, Sun W, An J, Zhao Y-X, et al. (2011) Cloning and functional characterization of a cation-chloride cotransporter gene OsCCC1. Plant Molecular Biology 75: 567–578.
57. Garcia A, Rizzo CA, Ud-Din J, Bartos SL, Senadhira D, et al. (1997) Sodium and potassium transport to the xylem are inherited independently in rice and the mechanisms of sodium: potassium selectivity differs between rice and wheat. Plant, Cell and Environment 20: 1167–1174.
58. Koyama ML, Levesley A, Koebner RMD, Flowers TJ, Yeo AR (2001) Quantitative trait loci for component physiological traits determining salt tolerance in rice. Plant Physiology 125: 406–422.
59. Lin HX, Zhu MZ, Yano M, Gao JP, Liang ZW, et al. (2004) QTLs for Na+and
K+uptake of the shoots and roots controlling rice salt tolerance. Theoretical and
Applied Genetics 108: 253–260.
60. Peng S, Ismail AM (2004) Physiological basis of yield and environmental adaptation in rice. In: Nguyen HT, Blum A, editors. Physiology and biotechnology integration for plant breeding. CRC Press, New York, Basel. pp. 72–118.
A Major Locus for Chloride Accumulation in Wheat