Predicting Soluble Nickel in Soils Using Soil
Properties and Total Nickel
Xiaoqing Zhang1, Jumei Li2, Dongpu Wei2, Bo Li2, Yibing Ma3*
1School of Forestry and Horticulture, Hubei University for Nationalities, 39 Xueyuan Road, Enshi, Hubei Province, 445000, China,2Institute of Agricultural Resources and Regional Planning, Chinese Academy of Agricultural Sciences, 12 Southern Street of Zhongguancun, Beijing, 100081, China,3School of Resources and Environment, University of Jinan, Jinan, 250022, Shandong Province, China
Abstract
Soil soluble nickel (Ni) concentration is very important for determining soil Ni toxicity. In the present study, the relationships between soil properties, total and soluble Ni concentrations in soils were developed in a wide range of soils with different properties and climate charac-teristics. The multiple regressions showed that soil pH and total soil Ni concentrations were the most significant parameters in predicting soluble Ni concentrations with the adjusted determination coefficients (Radj2) values of 0.75 and 0.68 for soils spiked with soluble Ni salt and the spiked soils leached with artificial rainwater to mimic field conditions, respectively. However, when the soils were divided into three categories (pH<7, 7–8 and>8), they
obtained better predictions with Radj2values of 0.78–0.90 and 0.79–0.94 for leached and unleached soils, respectively. Meanwhile, the other soil properties, such as amorphous Fe and Al oxides and clay, were also found to be important for determining soluble Ni concen-trations, indicating that they were also presented as active adsorbent surfaces. Additionally, the whole soil speciation including bulk soil properties and total soils Ni concentrations were analyzed by mechanistic speciation models WHAM VI and Visual MINTEQ3.0. It was found that WHAM VI provided the best predictions for the soils with pH<7, was relatively reason-able for pH 7 to 8, and gave an overestimation for pH>8. The Visual MINTEQ3.0 could pro-vide better estimation for pH<8 and meanwhile quite reasonable results for pH>8. These results indicated the possibility and applicability of these models to predict soil soluble Ni concentration by soil properties.
Introduction
Soil soluble metals are considered to be most active fractions for bioavailability/toxicity to soil organisms, and are governed by soil chemistry and the solid/solution distribution of total metals. Dominant soil chemical/physical properties known to affect the bioavailability of con-taminants include: soil pH, soil organic matter (SOM), clay, reactive iron, aluminum, and man-ganese oxides [1]. Research has shown that empirical and mechanistic models can provide accurate estimates of soluble metal concentrations. Most empirical estimate values are derived
OPEN ACCESS
Citation:Zhang X, Li J, Wei D, Li B, Ma Y (2015) Predicting Soluble Nickel in Soils Using Soil Properties and Total Nickel. PLoS ONE 10(7): e0133920. doi:10.1371/journal.pone.0133920
Editor:Jingdong Mao, Old Dominion University, UNITED STATES
Received:March 19, 2015
Accepted:July 2, 2015
Published:July 28, 2015
Copyright:© 2015 Zhang et al. This is an open access article distributed under the terms of the
Creative Commons Attribution License, which permits unrestricted use, distribution, and reproduction in any medium, provided the original author and source are credited.
Data Availability Statement:All relevant data are within the paper and its Supporting Information files.
Funding:The manuscript was financially supported by Special Fund for Environmental Protection Scientific Research in the Public Interest (Project no. 201509032), the International Copper Association, Rio Tinto Pty Ltd., and the Nickel Producers Environmental Research Association. The funders had no role in study design, data collection and analysis, decision to publish, or preparation of the manuscript.
from multiple regression analyses of soil physicochemical properties and total soil metal con-centrations [2–4]. However, integration of a semi-mechanistic model (based on the
competi-tive adsorption of metal) into the multiple regression analyses has been proven to be more successful at predicting soluble metal concentrations [3,5–6]. In this study, various sorption
surfaces were taken into account, not only the soil organic matter, but also clay silicates and metal oxides.
As for mechanistic models, WHAM VI has been widely used for metal speciation in soil sys-tems [2,7–10]. At present, few studies have used the whole soil speciation approach to predict
soluble metal concentration [2,11]. Thakali et al. [11] used bulk properties and total Ni and SOM content as inputs in WHAM VI to predict dissolved Ni2+concentrations with a root mean square error (RMSE) of 0.39 for soils with a pH<7 and a CaCO3content of nearly 0. However, the ability of WHAM VI to conduct whole soil speciation in calcareous soils charac-terized by high pH (pH>7) and significant CaCO3content, representative of certain types and properties of Chinese soils, appears not to have been attempted. In the present study, we attempted to use the same whole soil approach to compute Ni speciation in laboratory-spiked soils.
Visual MINTEQ 3.0 is another well-known mechanistic model, and has been increasingly employed for calculating soluble metal speciation [12–14]. Most of these attempts were
per-formed on soluble phases (natural water, solutions, and pore water), whereas use tests of whole soil approaches are rare. The Stockholm Humic Model (SHM) in Visual MINTEQ3 was speci-fied to calculate cation binding to humics, a reaction that provides more realistic assessment of metal–humic complexation, and also can be used to calculate both dissolved and solid humic
substance bindings [15]. According to previous studies, SHM has been proven to better describe proton binding and dissolved metal concentrations [13,16]. However, the application of this model for speciation of soil soluble Ni still requires further investigation.
The objectives of the present study were to: (i) investigate the influence of major soil proper-ties on Ni solid–solution distributions; (ii) develop competitive adsorption models that use
multiple regressions to predict soil soluble Ni concentrations in 17 typical Chinese soils with a wide range of soil properties and total metal concentrations; and (iii) attempt to apply the spe-ciation models (WHAM VI and Visual MINTEQ3) for whole soil spespe-ciation and to determine whether they can provide reasonable predictions.
Materials and Methods
2.1. Soil Sampling and Treatment
The present study was carried out on 17 soil samples, which covered the main areas of China
(Table 1) and represented the major types of Chinese agricultural soils. These soils were
described in full in a separate paper [17]. The ranges of soil properties were as follows: pH 4.93–8.90; organic carbon content (OC) 0.60%–4.28%; and clay content 10%–66%.
Soil samples were spiked with NiCl2solution with a range of eight concentrations from 37.5
to 2400 mg Ni/kg for soils with pH>7; 25 to 1600 mg Ni/kg for soils with pH 5 to 7; and 12.5 to 800 mg Ni/kg for soils with pH<5, respectively. The eight different amended soil samples for each site were leached with artificial rainwater to overcome potential salinity effects and to reduce the difference in Ni speciation between laboratory-treated and field-aged soils, and for comparison of the Ni partition between unleached soils [17–18]. The spiked soil samples were
stored for at least two months before measurement of soil and pore water properties. None of the soil samples before amendment with Ni were contaminated by other heavy metals (Cu, Zn, Pb, As, Cd and Cr), the exception being the total Ni concentration in the Haikou, Hainan soil sample (No. 6 inTable 1), which was as high as 124 mg/kg.
2.2. Analyses of Soil and Soil Solutions
Soil pH and electrical conductivity (EC) were determined in a water suspension of soil using a 1:5 (soil:solution) ratio. The main soil properties were determined, including: texture, effective cation exchange capacity, OC, total carbon content, and total Ni content, according to Li et al. [17]. The concentrations of amorphous iron, manganese, and aluminum in the soils were extracted by ammonium oxalate extraction and analyzed using an inductively coupled plasma-optical emission spectrometer (ICP-OES) (SpectroFlame Modula, Spectro, Boschstr, Kleve, Germany).
Soil solutions were extracted by centrifuge for 45 minutes at a speed of 3500 r/min and then another 45 minutes at a higher speed of 15000 r/min after incubation overnight at 50 cm water tension and 20°C. The extracted soil pore water was passed through 0.45μm filters. The
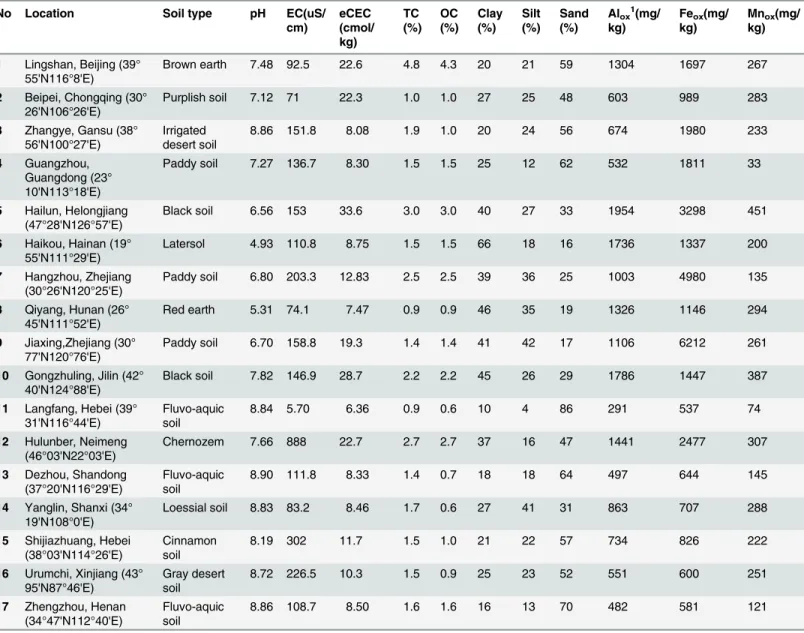
Table 1. The locations and main properties of soils used in the present study.
No Location Soil type pH EC(uS/
cm) eCEC (cmol/ kg) TC (%) OC (%) Clay (%) Silt (%) Sand (%)
Alox1(mg/
kg)
Feox(mg/
kg)
Mnox(mg/
kg)
1 Lingshan, Beijing (39° 55'N116°8'E)
Brown earth 7.48 92.5 22.6 4.8 4.3 20 21 59 1304 1697 267
2 Beipei, Chongqing (30° 26'N106°26'E)
Purplish soil 7.12 71 22.3 1.0 1.0 27 25 48 603 989 283
3 Zhangye, Gansu (38° 56'N100°27'E)
Irrigated desert soil
8.86 151.8 8.08 1.9 1.0 20 24 56 674 1980 233
4 Guangzhou, Guangdong (23° 10'N113°18'E)
Paddy soil 7.27 136.7 8.30 1.5 1.5 25 12 62 532 1811 33
5 Hailun, Helongjiang (47°28'N126°57'E)
Black soil 6.56 153 33.6 3.0 3.0 40 27 33 1954 3298 451
6 Haikou, Hainan (19° 55'N111°29'E)
Latersol 4.93 110.8 8.75 1.5 1.5 66 18 16 1736 1337 200
7 Hangzhou, Zhejiang (30°26'N120°25'E)
Paddy soil 6.80 203.3 12.83 2.5 2.5 39 36 25 1003 4980 135
8 Qiyang, Hunan (26° 45'N111°52'E)
Red earth 5.31 74.1 7.47 0.9 0.9 46 35 19 1326 1146 294
9 Jiaxing,Zhejiang (30° 77'N120°76'E)
Paddy soil 6.70 158.8 19.3 1.4 1.4 41 42 17 1106 6212 261
10 Gongzhuling, Jilin (42° 40'N124°88'E)
Black soil 7.82 146.9 28.7 2.2 2.2 45 26 29 1786 1447 387
11 Langfang, Hebei (39° 31'N116°44'E)
Fluvo-aquic soil
8.84 5.70 6.36 0.9 0.6 10 4 86 291 537 74
12 Hulunber, Neimeng (46°03'N22°03'E)
Chernozem 7.66 888 22.7 2.7 2.7 37 16 47 1441 2477 307
13 Dezhou, Shandong (37°20'N116°29'E)
Fluvo-aquic soil
8.90 111.8 8.33 1.4 0.7 18 18 64 497 644 145
14 Yanglin, Shanxi (34° 19'N108°0'E)
Loessial soil 8.83 83.2 8.46 1.7 0.6 27 41 31 863 707 288
15 Shijiazhuang, Hebei (38°03'N114°26'E)
Cinnamon soil
8.19 302 11.7 1.5 1.0 21 22 57 734 826 222
16 Urumchi, Xinjiang (43° 95'N87°46'E)
Gray desert soil
8.72 226.5 10.3 1.5 0.9 25 23 52 551 600 251
17 Zhengzhou, Henan (34°47'N112°40'E)
Fluvo-aquic soil
8.86 108.7 8.50 1.6 1.6 16 13 70 482 581 121
EC: electric conductivity; eCEC: effective cation exchange capacity; TC: total carbon; OC: organic carbon;1ox: oxalate extractable metal.
dissolved organic carbon (DOC), pH, EC, Na+, K+, Ca2+, Mg2+and Ni2+in the soil pore water samples were measured immediately. DOC was analyzed using the Formacs SERIES TOC/TN Analyzer (Skalar Ltd., Breda, the Netherlands). The major ions (K+, Ca2+, Na+, Mg2+, Ni2+) were measured either by ICP-OES or inductively coupled plasma-mass spectrometry (Spectro-flameModula, Spectro, Boschstr, Kleve, Germany), depending on their concentrations [19]. Pore water properties for 136 soil samples (17 site samples with eight Ni concentration levels) were determined for both unleached and leached treatments. Some soluble Ni concentrations were less than the detection limits, only 102 and 97 data sets were adopted for further analyses and modeling for unleached and leached soil samples, respectively.
2.3. Competition and the Adsorption Model
The partitioning of Ni between the solid and the solution phase was determined by soil properties, such as pH, clay, soil organic matter, metal oxides/hydroxides (Al, Fe and Mn).
Eq 1, which was derived from the empirical Freundlich model [3,6], was employed to describe how Ni competes with cations for binding and exchange sites. The soluble Ni concentration in soil pore water (Nidis), total Ni in soil (Nitot), and the important soil properties were logarithms
of values.
Nidis¼lgNitotþpHþlgOCþlgClayþlgFeoxþ. . .
ð1Þ
2.4. Soil Speciation Models
Two chemical mechanism calculation models (WHAM/Model VI and Visual MINTEQ ver-sion 3.0) were employed to estimate the soluble Ni concentration in the soil solution. These two models were used with the default parameters. The required bulk soil properties used as input data were: total concentration of Ni; SOM content; DOC concentrations; cations (K+, Na+, Mg2+, Ca2+); estimated solution concentration of Cl-and SO42-; soil solution pH; and
activity concentration of Fe3+and Al3+. The solubility of Al (OH)3, Fe (OH)3,and the active
fraction of DOC were included to optimize the prediction of soluble Ni concentrations. For WHAM VI, humic substances were presumed to be the only ion-binding components of the soil–solid phase. Other studies have shown that other soil phases, such as clays and metal
oxides, may also contribute to metal sorption [2]. Therefore, clay and metal oxide were also included to improve the fit.
In MINTEQ, the SHM model was similar to WHAM VI in many aspects and thus the input data was consistent with those used in WHAM VI. In some soil samples, the soil solution may become oversaturated when the pH is more than 7 and the CaCO3content above 0. Some
potential solid phases (NiCO3(lgKs=–11.2)) were specified, and if these solids did not
physi-cally exist they did not affect the equilibrium. The details of the speciation procedures of WHAM VI have been described in detail by Tipping et al. [2], Thakali et al. [11], and Sjöstedt et al. [13].
Results, Discussion, and Conclusions
3.1. Multiple Regression Models
Multiple regression analysis was performed to derive the relationships between the soluble Ni concentrations in pore water, total soil Ni concentrations, and soil properties (lg transformed)
(Table 2). These selected soil properties were significantly correlated with soluble Ni
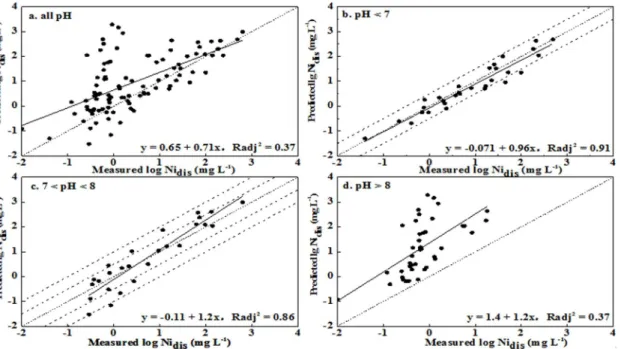
were the most important factors controlling the soluble Ni concentration in pore water for the whole pH range, with the Radj2of 0.75 for soils spiked with soluble Ni salt, and 0.68 for the
spiked soils leached with artificial rainwater to mimic field conditions (Table 2). Soluble Ni concentrations were strongly controlled by soil Ni concentrations and soil pH, meaning that Nidisincreased when Nitotincreased and pH decreased (Fig 1), indicating competitive
adsorp-tion between H+and Ni for soil binding sites. Previous studies also showed that soil pH was the most important factor influencing Ni partitioning in soils [3,6]. Compared with pH, other soil factors exhibited relatively weak effects on soluble Ni concentration. Incorporation of amor-phous Aloxslightly improved the prediction in leached soils, and was identical with clay for
unleached soils (equations 3 and 17 inS3 Table).
In order to better examine the influence of soil properties on soluble Ni concentration, the selected soil samples were segregated into three categories: acid (pH<7), weak alkaline
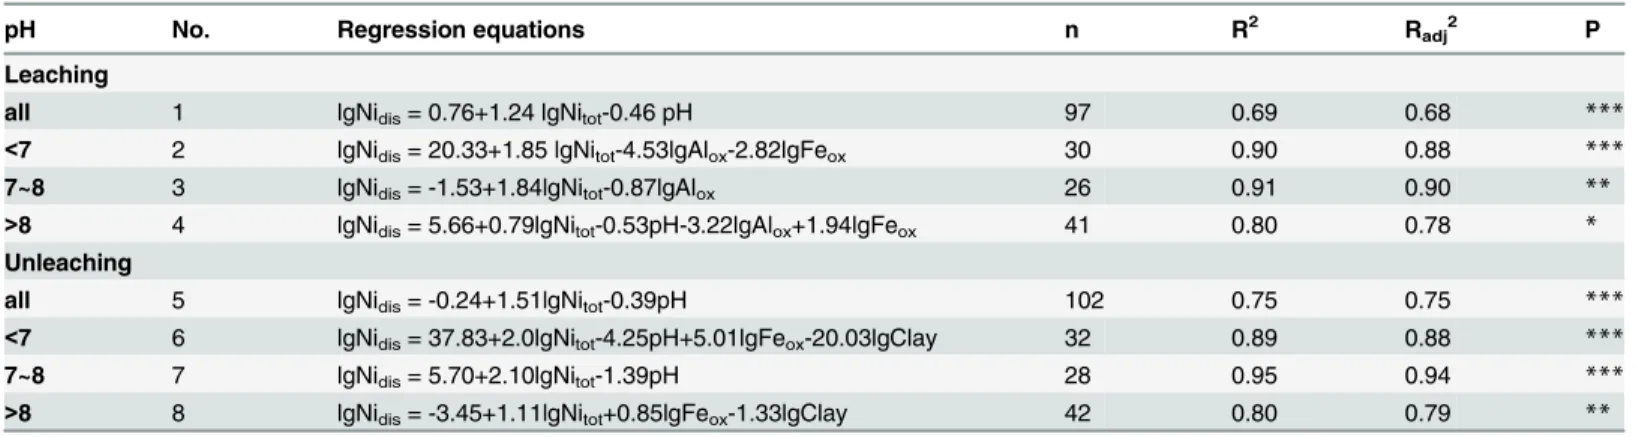
Table 2. Multiple regressions between log Nidis(soluble Ni concentration in soil pore water) and log Nitot(total Ni in soil) together with soil
properties.
pH No. Regression equations n R2 Radj2 P
Leaching
all 1 lgNidis= 0.76+1.24 lgNitot-0.46 pH 97 0.69 0.68 ***
<7 2 lgNidis= 20.33+1.85 lgNitot-4.53lgAlox-2.82lgFeox 30 0.90 0.88 ***
7~8 3 lgNidis= -1.53+1.84lgNitot-0.87lgAlox 26 0.91 0.90 **
>8 4 lgNidis= 5.66+0.79lgNitot-0.53pH-3.22lgAlox+1.94lgFeox 41 0.80 0.78 *
Unleaching
all 5 lgNidis= -0.24+1.51lgNitot-0.39pH 102 0.75 0.75 ***
<7 6 lgNidis= 37.83+2.0lgNitot-4.25pH+5.01lgFeox-20.03lgClay 32 0.89 0.88 ***
7~8 7 lgNidis= 5.70+2.10lgNitot-1.39pH 28 0.95 0.94 ***
>8 8 lgNidis= -3.45+1.11lgNitot+0.85lgFeox-1.33lgClay 42 0.80 0.79 **
Nidis: soluble Ni concentration in soil pore water; Nitot: total Ni concentration in soil; R2: coefficient of determination; Radj2: adjusted coefficient of determination; p: significant level of factors in regression equations;*: 5% significant level
**: 1% significant level
***: 1‰significant level. doi:10.1371/journal.pone.0133920.t002
Fig 1. Soluble Ni concentrations as a function of total Ni concentrations and soil pH (Nitotand Nidisrepresented total Ni concentration in soil and
the soluble Ni concentration in soil pore water, respectively).
(7<pH<8) and strong alkaline (pH>8), in accordance with the soluble Ni speciation distri-bution pattern [20]. Regression models based on these three pH ranges provided significantly better fits: the Radj2increased to more than 0.79, and was especially higher in the acid and weak
alkaline soils, and the predictions were within a half order of magnitude of the measured ones (S1andS2Figs). For soil pH between 7 and 8, Aloxwas significantly related with Nidisin
lea-ched soils, whereas a significant effect of pH was observed in unlealea-ched soils (equations 3 and
7 inTable 2). For the rest of the soils, amorphous Al, Fe oxide, and clay also demonstrated
sig-nificant affinity with soluble Ni, indicating that Ni sorption onto the soils was influenced by their presence. However, the significant factors observed in leached soils did not completely match those in unleached soils. On one hand, leaching treatments partially changed soil salin-ity and pH and consequently influenced the soluble Ni concentration. On the other hand, the soil properties themselves were intercorrelated. For example, Aloxwas closely connected with
pH and clay content (S1andS2Tables). Thus, the influence of Aloxon soluble Ni content in
leached soil may indirectly reflect the effect of pH and soil clay content, which could explain the differences between equations 2 and 4 and between 6 and 8 (Table 2). Meanwhile, the pre-dictions were slightly improved when all of the factors were included in the multiple regres-sions (S3 Table).
For leached soils, a negative relationship was observed between Aloxand soluble Ni
concentration. A number of studies have demonstrated that the high affinity of Aloxfor metal
is due to large surface areas, microporous structures, and an abundance of binding sites [21]. In unleached soils, amorphous Feoxwas positively correlated with soluble Ni concentrations,
which was not consistent with previous studies [6]. The solid and dissolved amorphous Feoxin
the soil was mainly in the forms of oxides and hydroxides, respectively. Dissolved colloidal Fe hydroxides could form complexes with Ni and DOC complexes [22], which influenced soluble Ni speciation and potentially increased Ni mobility. Additionally, adsorption of humic matter altered the surface chemistry and colloidal stability of iron oxides. In the case of DOC, they would compete with Ni for the iron oxide surface sites, and consequently, DOC occupied a portion of all surface sites. As for Ni, the soil absorption capacity decreased relatively and more Ni partitioned to the soluble phase. Therefore, the soluble Ni concentration depended on the partition of Feoxin solid and solution phases.
3.2. WHAM Speciation for Soluble Ni Concentration
The precision in the soluble Ni speciation calculation depended on the input data of total concentrations of soil parameters. According to previous models [2,11], several inputs were considered to optimize the prediction, including: (1) the adsorptive surfaces of clay and amor-phous Al, Fe, and Mn oxides; (2) the solubility products of Fe3+and Al3+; (3) the fraction of active SOM and DOC; and (4) the dissolved cations (K+, Na+, Mg2+and Ca2+). The inputs list and modeled optimized results are presented inTable 3.
The inclusion of Fe oxides improved the prediction with a small decrease in RMSE values (no. 1 to 2 inTable 3), indicating their contribution to Ni adsorption. Meanwhile, Al and Mn oxides showed insignificant effects on Ni sorption. For example, in unleached soils with pH<7, the RMSE values were very similar (both at 0.33) when the inputs were Al and Mn oxides (no. 2 to 4 inTable 3). These results could be explained by the comparative strong fixa-tion of Fe oxides on soil Ni [23–24]. With inclusion of clay content, a slight improvement in
The activities of Fe3+and Al3+were determined by their hydrolysis and interaction with Ni for binding sites. The optimized solubility constants were referenced from Thakali et al. [11] with p KFeðOHÞ3= 3.0 and p KAlðOHÞ3= 6.0, respectively. However, the inclusion of Fe and Al
activity did not improve the prediction and conversely aggravated the differences between the predicted and observed concentrations (no. 5 and 6 inTable 3).
SOM was assumed to be an important adsorbent due to its high affinity to Ni and the assess-ment of active fraction of SOM was essential in Ni speciation. According to previous research, SOM consisted of particulate FA and HA with a ratio of 84:16 [27]. Earlier publications defined 65% of DOC as colloidal FA [2,11], and others were assumed inert. In the present study, results were over predicted when the active fraction of DOC was 65%. Adjusting the active fraction to 30%, the RMSE values were smaller than those with 65% (no. 7 and 8 inTable 3). Further decreasing the fraction to 0%, the predicted results were similar to those with a 30% active fraction of DOC, indicating that DOC may be neglected in predicted dissolved Ni concentrations.
When considering the dissolved cations, K+and Na+did not affect the precision of predic-tion (no. 9 to 11 inTable 3). The exclusion of dissolved Mg2+resulted in a fluctuation of RMSE in different pH ranges with the RMSE nearly unchanged for soils with pH<7 and decreased for the rest of the soils (no. 11 to 12 inTable 3). The effects of Mg could not be ignored in deter-mining soluble Ni concentration for soils with pH>7; nevertheless dissolved Ca2+was deemed essential as the only dissolved cation that improved the prediction in some soils.
The above analyses show that the optimized and simplified parameters of the inputs to WHAM VI included: total Ni, SOM, pH, Feox, Clay, dissolved Ca2+, Cl-, and SO42-. For the
unleached soils, WHAM VI could provide better predictions for soils with pH<8 and weaker predictions for soils with pH>8. The RMSE values were 0.31, 0.45, and 1.66 in the three pH ranges (<7, 7–8, and>8), corresponding to deviations of 2.0-, 2.8-, and 45.8-fold between the
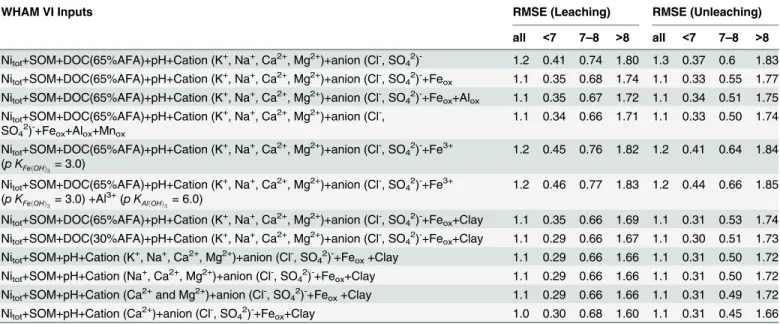
Table 3. Effects of the input variables on the RMSE between the predicted soluble Ni concentrations by WHAM and measured values.(The temper-ature is set at 293K and the partial pressure of CO2(pCO2) is set at 10−3.5atm).
No. WHAM VI Inputs RMSE (Leaching) RMSE (Unleaching)
all <7 7–8 >8 all <7 7–8 >8
1 Nitot+SOM+DOC(65%AFA)+pH+Cation (K+, Na+, Ca2+, Mg2+)+anion (Cl-, SO42)- 1.2 0.41 0.74 1.80 1.3 0.37 0.6 1.83
2 Nitot+SOM+DOC(65%AFA)+pH+Cation (K+, Na+, Ca2+, Mg2+)+anion (Cl-, SO42)-+Feox 1.1 0.35 0.68 1.74 1.1 0.33 0.55 1.77
3 Nitot+SOM+DOC(65%AFA)+pH+Cation (K+, Na+, Ca2+, Mg2+)+anion (Cl-, SO42)-+Feox+Alox 1.1 0.35 0.67 1.72 1.1 0.34 0.51 1.75
4 Nitot+SOM+DOC(65%AFA)+pH+Cation (K+, Na+, Ca2+, Mg2+)+anion (Cl-,
SO42)-+Feox+Alox+Mnox 1.1 0.34 0.66 1.71 1.1 0.33 0.50 1.74
5 Nitot+SOM+DOC(65%AFA)+pH+Cation (K+, Na+, Ca2+, Mg2+)+anion (Cl-, SO42)-+Fe3+ (p KFeðOHÞ3= 3.0)
1.2 0.45 0.76 1.82 1.2 0.41 0.64 1.84
6 Nitot+SOM+DOC(65%AFA)+pH+Cation (K+, Na+, Ca2+, Mg2+)+anion (Cl-, SO42)-+Fe3+ (p KFeðOHÞ3= 3.0) +Al
3+(p K
AlðOHÞ3= 6.0)
1.2 0.46 0.77 1.83 1.2 0.44 0.66 1.85
7 Nitot+SOM+DOC(65%AFA)+pH+Cation (K+, Na+, Ca2+, Mg2+)+anion (Cl-, SO42)-+Feox+Clay 1.1 0.35 0.66 1.69 1.1 0.31 0.53 1.74
8 Nitot+SOM+DOC(30%AFA)+pH+Cation (K+, Na+, Ca2+, Mg2+)+anion (Cl-, SO42)-+Feox+Clay 1.1 0.29 0.66 1.67 1.1 0.30 0.51 1.73
9 Nitot+SOM+pH+Cation (K+, Na+, Ca2+, Mg2+)+anion (Cl-, SO42)-+Feox+Clay 1.1 0.29 0.66 1.66 1.1 0.31 0.50 1.72
10 Nitot+SOM+pH+Cation (Na+, Ca2+, Mg2+)+anion (Cl-, SO42)-+Feox+Clay 1.1 0.29 0.66 1.66 1.1 0.31 0.50 1.72
11 Nitot+SOM+pH+Cation (Ca2+and Mg2+)+anion (Cl-, SO42)-+Feox+Clay 1.1 0.29 0.66 1.66 1.1 0.31 0.49 1.72
12 Nitot+SOM+pH+Cation (Ca2+)+anion (Cl-, SO42)-+Feox+Clay 1.0 0.30 0.68 1.60 1.1 0.31 0.45 1.66
Nitot: total Ni concentration in soil; SOM: soil organic matter; DOC: dissolved organic carbon; AFA: active fulvic acid; Alox: amorphous Al oxide; Feox: amorphous Fe oxide; Mnox: amorphous Mn oxide; RMSE: root mean square error.
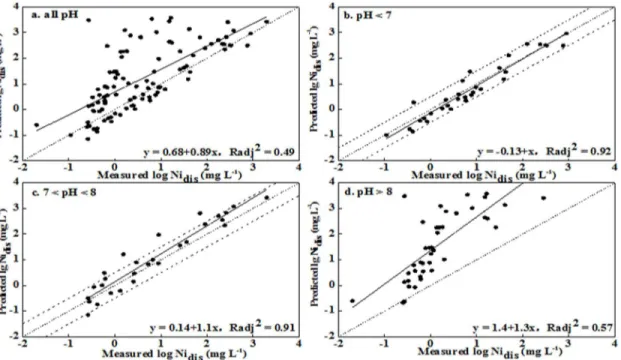
predictions and observations, respectively (no. 12 inTable 3). Most predicted values were gen-erally within a half order of magnitude of observations for soil with pH<8, while distinct over predictions were obtained for soil with pH>8 (Figs2and3). Simultaneously, better correla-tions between prediccorrela-tions and observacorrela-tions were obtained for the pH<7 and pH 7–8 ranges, with Radj2values being 0.92 and 0.91, respectively. The correlation was worse for pH>8, with
the value of Radj2being 0.57. Similar results were observed for the leached soils. These results
indicated that the precision levels in the prediction soluble Ni concentration were acceptable for soil pH<8 and were unsatisfactory for soil pH>8.
When the pH was>8, NiCO3(aq) was the most dominant soluble Ni species with fraction more than 40% and the proportion increased as pH increased [20]. The strong alkaline soils had a higher CaCO3content and larger added dosages of Ni to the point that the NiCO3(aq)
may have oversaturated and precipitated on the soil. WHAM VI was unable to evaluate Ni pre-cipitation in soils because the dissolution–precipitation reactions were not taken into account
in the program. Similarly, Bonten et al. [28] concluded that the model tended to overestimate concentrations in solution for heavily contaminated soils because of potential precipitation. Therefore, it was not suitable to apply WHAM VI to evaluate soluble Ni concentrations in the calcareous and alkaline soils.
3.3. Visual MINTEQ Speciation
In order to advance the prediction of soil soluble Ni concentration, the other mechanistic model, Visual MINTEQ, was applied. The input parameters included: total soil Ni concentra-tions, SOM, pH, DOM, the activity of Al3+and Fe3+, major dissolved anions, cations, and clay content. Since the soluble product of Al3+and Fe3+and the ratio of active DOM to DOC were the most important factors controlling the soluble Ni concentration, the model was optimized by adjusting these parameters. The results are shown inTable 4. Some differences were observed between the leached and unleached soils: the effects of dissolved Na+and K+could be
Fig 2. Measured soluble Ni concentrations versus predicted Ni concentrations using WHAM VI for leached soils (Nidisrepresented the soluble Ni
concentration in soil pore water).
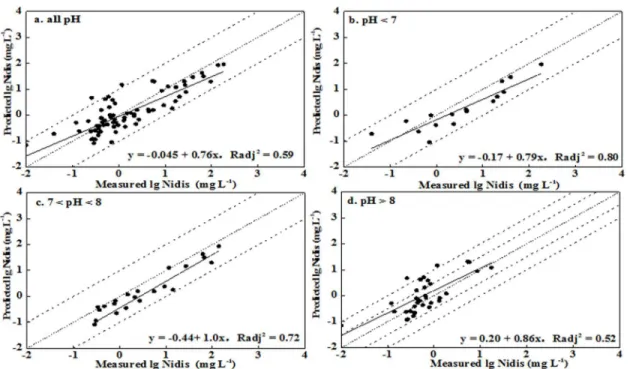
ignored in model simulation for leached soils, while they could improve the prediction for unleached soils. Additionally, relatively better fits were obtained when the ratio of active DOM to DOC was 1.65 and 2.0 for leached and unleached soils, respectively. However, the SHM sim-ulations in most cases fitted well with the observations from no. 1 and no. 10 for the leached and unleached soils, respectively, within an order of magnitude of observations (Figs4and5). For soils with pH<8, the model worked better for the unleached soils, with predictions within a half order of magnitude of observations. Meanwhile, better correlation between prediction and observation was obtained for soils with pH<8, with Radj2more than 0.89. For pH>8, the RMSE values were 0.51 and 0.70 for the leached and unleached soil, respectively, correspond-ing to deviations of 3.2- and 5.0-fold between the predictions and observations. It was evident that the values were over predicted, which may have been caused by the original assumption of a high ratio of DOM to DOC. Although the deviation between the simulations and the observa-tions was fairly large, the predicobserva-tions were greatly improved by comparison with those from WHAM. These differences in model performance may be due to the greater number of adjust-able parameters in the SHM, the determination of active DOM, a different set of soluble prod-ucts for Al3+and Fe3+, the possible precipitation calculation of NiCO3(s), and also other likely
model-specific differences [13,15].
A number of additional problems were also present in the simulation. For example, the interactions between the solid and soluble phases were complicated, and the ion strength of inputs exceeded the limits, which resulted in the number of iterations extending beyond the allowed maximum. These problems happened more often for soils with pH less than 8 and these simulated values were adopted for further analysis. Nevertheless, the simulations by Visual MINTEQ were reasonable, which made for significant progress in prediction of soil sol-uble Ni concentration for the high pH soils. Hence, the model can provide a valuable reference for practical applications if the ion loading is in the specified maximum.
Fig 3. Measured soluble Ni concentration versus predicted Ni concentration using WHAM VI in unleached soils (Nidisrepresented the soluble Ni
concentration in soil pore water).
Table 4. Effects of the input variables on the RMSE between the predicted soluble Ni concentrations by Visual MINTEQ and measured values.
No. MINTEQ Inputs RMSE (Leaching) RMSE (Unleaching)
all <7 7–8 >8 all <7 7–8 >8
1 Nitot+SOM+pH+Cation(K+, Na+, Ca2+, Mg2+)+anion (Cl-, SO42)+DOC (DOM/ DOC = 1.65)+Fe3+(p KFeðOHÞ3= 2.69) +Al
3+
(p KAlðOHÞ3= 8.29)
0.49 0.49 0.58 0.51 0.50 0.37 0.29 0.67
2 Nitot+SOM+pH+Cation(Ca2+,Mg2+)+anion (Cl-, SO42)+DOC(DOM/DOC = 1.65)+Fe3+ (p KFeðOHÞ
3= 2.69) +Al
3+(p K
AlðOHÞ3= 8.29)
0.56 0.50 0.68 0.51 0.54 0.44 0.36 0.69
3 Nitot+SOM+pH+Cation (Ca2+, Mg2+)+anion (Cl-, SO42)+DOC (DOM/DOC = 1.65)+Fe3+ (p KFeðOHÞ3= 3.0) +Al
3+(p K
AlðOHÞ3= 6.0)
0.92 0.88 1.20 0.71 - - -
-4 Nitot+SOM+pH+Cation (Ca2+, Mg2+)+anion (Cl-, SO42)+DOC(DOM/DOC = 1.3)+Fe3+ (p KFeðOHÞ3= 3.0) +Al
3+(p K
AlðOHÞ3= 6.0)
0.58 0.55 0.74 0.47 - - -
-5 Nitot+SOM+pH+Cation(Ca2+, Mg2+)+anion (Cl-, SO42)+DOC(DOM/DOC = 0.6)+Fe3+ (p KFeðOHÞ3= 3.0) +Al
3+(p K
AlðOHÞ3= 6.0)
0.73 0.77 0.96 0.51 - - -
-6 Nitot+SOM+pH+Cation (Ca2+, Mg2+)+anion (Cl-, SO42)+DOC(DOM/DOC = 2)+Fe3+ (p KFeðOHÞ
3= 3.0) +Al
3+ (p KAlðOHÞ
3= 6.0)
0.56 0.46 0.63 0.55 - - -
-7 Nitot+SOM+pH+Cation (Ca2+, Mg2+)+anion (Cl-, SO42)+DOC(DOM/DOC = 2)+Fe3+ (p KFeðOHÞ
3= 3.0) +Al
3+(p K
AlðOHÞ3= 6.0) +Clay%
0.57 0.46 0.63 0.57 - - -
-8 Nitot+SOM+pH+Cation(K+, Na+, Ca2+, Mg2+)+anion(Cl-, SO42)+DOC(DOM/DOC = 1.3)+Fe3+ (p KFeðOHÞ3= 2.69) +Al
3+(p K
AlðOHÞ3= 8.29)
- - - - 0.51 0.43 0.36 0.64
9 Nitot+SOM+pH+Cation(K+, Na+, Ca2+, Mg2+)+anion(Cl-, SO42)+DOC(DOM/DOC = 0.6)+Fe3+ (p KFeðOHÞ3= 2.69) +Al
3+(p K
AlðOHÞ3= 8.29)
- - - - 0.64 0.66 0.61 0.65
10 Nitot+SOM+pH+Cation (K+, Na+, Ca2+, Mg2+)+anion(Cl-, SO42)+DOC(DOM/DOC = 2)+Fe3+ (p KFeðOHÞ3= 2.69) +Al
3+
(p KAlðOHÞ3= 8.29)
- - - - 0.50 0.33 0.25 0.70
11 Nitot+SOM+pH+Cation(K+, Na+, Ca2+, Mg2+)+anion (Cl-, SO42)+DOC(DOM/DOC = 2)+Fe3+ (p KFeðOHÞ
3= 2.69) +Al
3+(*p K
AlðOHÞ3= 8.29) +Clay%
- - - - 0.52 0.33 0.25 0.73
Nitot: total Ni concentration in soil; SOM: soil organic matter; DOC: dissolved organic carbon; RMSE: root mean square error.
doi:10.1371/journal.pone.0133920.t004
Fig 4. Measured soluble Ni concentration versus predicted Ni concentration using Visual MINTEQ for leached soils (Nidisrepresented the soluble
Supporting Information
S1 Fig. Measured soluble Ni concentration versus predicted Ni concentration in leached
soils from regression Equations (a. lgNidis= 0.76 + 1.24lgNitot—0.46pH; b. lgNidis=
20.33 + 1.85lgNitot—4.53lgAloxi—2.82lgFeoxi; c. lgNidis= -1.53 + 1.84lgNitot—0.87lgAloxi;
d. lgNidis= 5.66 + 0.79lgNitot—0.53pH—3.22lgAloxi+ 1.94lgFeoxi) (Nitotand Nidis
repre-sented total Ni concentration in soil and the soluble Ni concentration in soil pore water,
respectively; Aloxiand Feoxirepresented amorphous Al and Fe oxides, respectively).
(DOC)
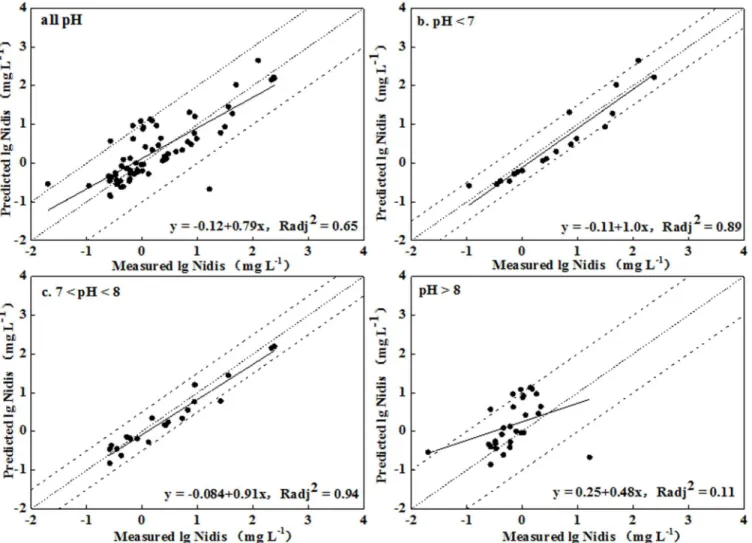
S2 Fig. Measured soluble Ni concentration versus predicted Ni concentration in unleached
soils from regression Equations (a. lgNidis= -0.24 + 1.51lgNitot—0.39pH; b. lgNidis=
37.83 + 2.0lgNitot—4.25pH + 5.01lgFeoxi—20.03lgClay; c. lgNidis= 5.70 + 2.10lgNitot—
1.39pH; d. lgNidis= -3.45 + 1.11lgNitot+ 0.85lgFeoxi—1.33lgClay) (Nitotand Nidis
repre-sented total Ni concentration in soil and the soluble Ni concentration in soil pore water,
respectively; Aloxiand Feoxirepresented amorphous Al and Fe oxides, respectively).
(DOC)
Fig 5. Measured soluble Ni concentration versus predicted Ni concentration using Visual MINTEQ in unleached soils (Nidisrepresented the
soluble Ni concentration in soil pore water).
S1 Table. Correlation matrix (Pearson correlation cofficient) between lgNidisconcentration
in leached soil pore water and lgNitottogether with soil properties (n = 97) (Nitotand Nidis
represented total Ni concentration in soil and the soluble Ni concentration in soil pore water, respectively).
(DOC)
S2 Table. Correlation matrix (Pearson correlation cofficient) between lgNidisconcentration
in unleached soil pore water and lgNitotin soil together with soil properties (n = 102) (Nitot
and Nidisrepresented total Ni concentration in soil and the soluble Ni concentration in soil
pore water, respectively).
(DOC)
S3 Table. Multiple regressions between lgNidisconcentration in soil pore water and lgNitot
in soil together with soil properties (Nitotand Nidisrepresented total Ni concentration in
soil and the soluble Ni concentration in soil pore water, respectively).
(DOC)
Acknowledgments
The authors thank the financial support by Special Fund for Environmental Protection Scien-tific Research in the Public Interest (Project no. 201509032), the International Copper Associa-tion, Rio Tinto Pty Ltd., and the Nickel Producers Environmental Research Association. The authors also thank the national long-term soil experimental stations in China for soil collec-tion, and Gillian Cozens and Cathy Fiebiger for technical assistance.
Author Contributions
Conceived and designed the experiments: YBM. Performed the experiments: BL XQZ. Ana-lyzed the data: XQZ YBM. Contributed reagents/materials/analysis tools: DPW JML. Wrote the paper: XQZ YBM.
References
1. Fairbrother A, Wenstel RW, Sappington K, Wood W. Framework for metals risk assessment. Ecotoxi-col. Environ. Saf. 2007; 68 (2): 145–227. PMID:17889701
2. Tipping E, Rieuwerts J, Pan G, Ashmore MR, Lofts S, Hill MTR, et al. The solid-solution partitioning of heavy metals (Cu, Zn, Cd, Pb) in upland soils of England and Wales. Environ. Pollut. 2003; 125 (2): 213–225. PMID:12810315
3. Sauvé S, Hendershot W, Allen H. Solid-solution partitioning of metals in contaminated soils: depen-dence on pH, total metal burden, and organic matter. Environ. Sci. Technol. 2000; 34(7): 1125–1131.
4. Sauvé S, Manna S, Turmel MC, Roy AG, Courchesne F. Solid−Solution partitioning of Cd, Cu, Ni, Pb,
and Zn in the organic horizons of a forest soil. Environ. Sci. Technol. 2003; 37(22): 5191–5196. PMID: 14655707
5. Weng LP, Wolthoorn A, Lexmond TM, Temminghoff EJM, van Riemsdijk WH. Understanding the effects of soil characteristics on phytotoxicity and bioavailability of nickel using speciation models. Envi-ron. Sci. Technol. 2004; 38 (1): 156–162. PMID:14740731
6. Gandois L, Probst A, Dumat C. Modelling trace metal extractability and solubility in French forest soils by using soil properties. Eur. J. Soil Sci. 2010; 61(2): 271–286.
7. Tye AM, Young S, Crout NMJ, Zhang H, Preston S, Zhao FJ, et al. Speciation and solubility of Cu, Ni and Pb in contaminated soils. Eur. J. Soil Sci. 2004; 55 (3): 579–590.
8. Dijkstra JJ, Meeussen JCL, Comans RNJ. Leaching of heavy metals from contaminated soils: An experimental and modeling study. Environ. Sci. Technol. 2004; 38(16): 4390–4395. PMID:15382869
10. Ponizovsky AA, Thakali S, Allen HE, Di Toro DM, Ackerman AJ. Effect of soil properties on copper release in soil solutions at low moisture content. Environ. Toxicol. Chem. 2006; 25 (3): 671–682. PMID: 16566151
11. Thakali S, Allen HE, Di Toro DM, Ponizovsky AA, Rooney CP, Zhao FJ, et al. A terrestrial biotic ligand model. 1. development and application to Cu and Ni toxicities to barley root elongation in soils. Environ. Sci. Technol. 2006; 40(22): 7085–7093. PMID:17154020
12. Parat C, Cornu JY, Schneider A, Authier L, Sapin-Didier V, Denaix L, et al. Comparison of two experi-mental speciation methods with a theoretical approach to monitor free and labile Cd fractions in soil solutions. Anal. Chim. Acta. 2009; 648 (2): 157–161. doi:10.1016/j.aca.2009.06.052PMID:19646578
13. Sjöstedt CS, Gustafsson JP, Köhler SJ. Chemical equilibrium modeling of organic acids, pH, aluminum, and iron in Swedish surface waters. Environ. Sci. Technol. 2010; 44(22): 8587–8593. doi:10.1021/ es102415rPMID:20958024
14. Ytreberg E, Jenny Karlsson J, Hoppe S, Eklund B, Ndungu K. Effect of organic complexation on copper accumulation and toxicity to the Estuarine Red Macroalga Ceramium tenuicorne: a test of the free ion activity model. Environ. Sci. Technol. 2011; 45 (7): 3145–3153. doi:10.1021/es1039166PMID: 21391651
15. Gustafsson JP, Van Schaik JWJ. Cation binding in a mor layer: batch experiments and modelling. Eur. J. Soil Sci. 2003; 54 (2): 295–310.
16. Gustafsson JP, Pechová P. Modeling Metal Binding to Soils: The role of natural organic matter. Envi-ron. Sci. Technol. 2003; 37 (12): 2767–2774. PMID:12854717
17. Li B, Zhang HT, Ma YB, McLaughlin MJ. Influences of soil properties and leaching on nickel toxicity to barley root elongation. Ecotox. Environ. Safe.2011; 74 (3): 459–466.
18. Oorts K, Ghesquiere U, Smolders E. Leaching and aging decrease nickel toxicity to soil microbial pro-cesses in soils freshly spiked with nickel chloride. Environ. Toxicol. Chem. 2007; 26(6): 1130–1138. PMID:17571677
19. Zarcinas BA, McLaughlin MJ, Smart MK. The effect of acid digestion technique on the performance of nebulization systems used in inductively coupled plasma spectrometry. Commun. Soil Sci. Plant Anal. 1996; 27(5–8): 1331–1354.
20. Li B, Zhang X, Wang XD, Ma YB. Refining a biotic ligand model for nickel toxicity to barley root elonga-tion in soluelonga-tion culture. Ecotox. Environ. Safe. 2009; 72(6): 1760–1766.
21. Axe L, Trivedi P. Intraparticle surface diffusion of metal contaminants and their attenuation in Micropo-rous Amorphous Al, Fe, and Mn Oxides. J. Colloid Interf. Sci. 2002; 247(2): 259–265.
22. Tipping E, Rey-Castro C, Bryan SE, Hamilton-Taylor J. Al(III) and Fe(III) binding by humic substances in freshwaters, and implications for trace metal speciation. Geochim. Cosmochim. Acta 2002; 66 (18): 3211–3224.
23. Contin M, Mondini C, Leita L, De Nobili M. Enhanced soil toxic metal fixation in iron (hydr)oxides by redox cycles. Geoderma. 2007; 140 (1–2): 164–175.
24. Buekers J, Van Laer L, Amery F, Van Buggenhout S, Maes A, Smolders E. Role of soil constituents in fixation of soluble Zn, Cu, Ni and Cd added to soils. Eur. J. Soil Sci. 2007; 58(6): 1514–1524.
25. Shi ZQ, Peltier E, Sparks DL. Kinetics of Ni sorption in soils: roles of soil organic matter and Ni precipita-tion. Environ. Sci. Technol. 2012; 46(4): 2212–2219. doi:10.1021/es202376cPMID:22283487
26. Weng LP, Temminghoff EJM, Van Riemsdijk WH. Contribution of individual sorbents to the control of heavy metal activity in sandy soil. Environ. Sci. Technol. 2001; 35(22): 4436–4443. PMID:11757598
27. Tipping E, Berggren D, Mulder J. Modelling the solid–solution distributions of protons, aluminium, base
cations and humic substances in acid soils. Eur. J. Soil Sci. 1995; 46(1): 77–94.