Ciência e Agrotecnologia, 41(6):648-664, Nov/Dec. 2017
2017 | Lavras | Editora UFLA | www.editora.ufla.br | www.scielo.br/cagro
All the contents of this journal, except where otherwise noted, is licensed under a Creative Commons Attribution License attribuition-type BY.
http://dx.doi.org/10.1590/1413-70542017416010317
Multiple linear regression and random forest to predict and map soil
properties using data from portable X
-ray fluorescence spectrometer (pXRF)
Regressão linear múltipla e random forest para predição e mapeamento de atributos do
solo utilizando dados de espectrômetro portátil de fluorescência de raios-X (pXRF)
Sérgio Henrique Godinho Silva1*, Anita Fernanda dos Santos Teixeira1, Michele Duarte de Menezes1,
Luiz Roberto Guimarães Guilherme1, Fatima Maria de Souza Moreira1, Nilton Curi1
1Universidade Federal de Lavras/UFLA, Departamento de Ciência do Solo/DCS, Lavras, MG, Brasil *Corresponding author: sergio.silva@dcs.ufla.br
Received in April 9, 2017 and approved in June 22, 2017
ABSTRACT
Determination of soil properties helps in the correct management of soil fertility. The portable X-ray fluorescence spectrometer (pXRF) has been recently adopted to determine total chemical element contents in soils, allowing soil property inferences. However, these studies are still scarce in Brazil and other countries. The objectives of this work were to predict soil properties using pXRF data, comparing stepwise multiple linear regression (SMLR) and random forest (RF) methods, as well as mapping and validating soil properties. 120 soil samples were collected at three depths and submitted to laboratory analyses. pXRF was used in the samples and total element contents were determined. From pXRF data, SMLR and RF were used to predict soil laboratory results, reflecting soil properties, and the models were validated. The best method was used to spatialize soil properties. Using SMLR, models had high values of R² (≥0.8), however the highest accuracy was obtained in RF modeling. Exchangeable Ca, Al, Mg, potential and effective cation exchange capacity, soil organic matter, pH, and base saturation had adequate adjustment and accurate predictions with RF. Eight out of the 10 soil properties predicted by RF using pXRF data had CaO as the most important variable helping predictions, followed by P2O5, Zn and Cr. Maps generated using RF from pXRF data had high accuracy for six soil properties, reaching R2 up to 0.83. pXRF in association with RF can be used to predict soil properties with high accuracy at low cost and time, besides providing variables aiding digital soil mapping.
Index terms: Soil analyses; spatial prediction; proximal sensor.
RESUMO
A determinação de atributos do solo auxilia no correto manejo da sua fertilidade. O equipamento portátil de fluorescência de raios-X (pXRF) foi recentemente adotado para determinar o teor total de elementos químicos em solos, permitindo inferências sobre atributos do solo. No entanto, esses estudos ainda são escassos no Brasil e em outros países. Os objetivos deste trabalho foram prever atributos do solo a partir de dados do pXRF, comparando-se os métodos de regressão linear múltipla stepwise (SMLR) e de random forest (RF), além de mapear e validar atributos do solo. 120 amostras de solo foram coletadas em três profundidades e submetidas a análises laboratoriais. Utilizou-se o pXRF para leitura das amostras e determinou-se o teor total de elementos. A partir dos dados do pXRF, foram utilizadas SMLR e RF para predizer resultados laboratoriais, que refletem atributos do solo, e os modelos foram validados. O melhor método foi utilizado para espacializar os atributos do solo. Utilizando SMLR, os modelos apresentaram valores elevados de R² (≥0,8), porém maior acurácia foi obtida na modelagem com RF. A capacidade de troca de cátions potencial e efetiva, matéria orgânica do solo, pH, saturação por bases e teores trocáveis de Ca, Al e Mg apresentaram ajustes adequados e predições acuradas com RF. Dos dez atributos do solo preditos por RF a partir de dados do pXRF, sete apresentavam CaO como a variável mais importante para auxiliar as predições, seguido por P2O5, Zn e Cr. Os mapas gerados a partir de dados do pXRF usando RF apresentaram adequados valores de R² para seis atributos do solo, atingindo R2 de até 0,83. O pXRF em associação com RF pode ser usado para prever atributos do solo com elevada acurácia, com rapidez e a baixo custo, além de proporcionar variáveis que auxiliam o mapeamento digital de solos.
Termos para indexação: Análises de solo; predição espacial; sensor próximo.
INTRODUCTION
Soils present diverse physical, chemical, mineralogical and biological properties, which influence their diverse potentialities of use (Birkeland, 1999; Resende et al., 2014; Schaetzl; Anderson, 2005), such as plant growth. The characterization of those properties is of great importance for
On the other hand, carrying out laboratory tests in a large number of samples requires more time and
financial resources, as well as chemical reagents, which
generate residues. Thus, the use of tools that quickly allow the evaluation of soil properties, at low cost and without residues production may facilitate the evaluation of more samples to characterize soils in more detail and for different purposes.
Portable X-ray fluorescence spectrometer (pXRF) is a tool used in works of several fields of study for identification and quantification of chemical elements present in varied materials (Ioannides et al., 2016; Milić,
2014; Peinado et al., 2010; Rouillon; Taylor, 2016; Terra et al., 2014; Zhu; Weindorf; Zhang, 2011). This equipment emits high-energy X-ray beams, which cause the displacement of electrons from inner to outer orbits as they hit the atoms of the elements in the sample. In sequence, the displaced electrons return to their original orbits emitting a fluorescence characteristic of each chemical element, as it is related to the element atomic number. Thus, in a few seconds the equipment is able to determine the total contents of elements of the Periodic
Table between Mg and U, allowing its use both in the field
and in the laboratory (Weindorf; Bakr; Zhu, 2014). The pXRF generates a large data set, which may slow down their analyses and interpretation in detail. In this sense, the use of machine learning tools may
accelerate the identification of data for characterizing
soils. Several methods of analyzing large amount of data of both continuous and categorical variables have been used in works of various natures, such as the stepwise multiple linear regression (SMLR) (Juhos; Szabó; Ladányi, 2015; Menezes et al., 2016; Rodrigues; Corá; Fernandes, 2012). This analysis adjusts regression models from easily obtained variables to estimate data more
difficult to be acquired, in which the addition or removal
of predictive variables to the model is performed based
on statistical tests, generating a final equation. Weindorf
et al. (2012) evaluated the pXRF to discriminate spodic
and albic horizons in the field, using SMLR to estimate
organic carbon data from pXRF data, concluding that the equipment was adequate, contributing to the rapid generation of chemical data.
Another method that has been increasingly used for predictions is the so-called random forest (RF) (Breiman, 2001). This algorithm presents as advantages the possibility of using both numerical and categorical variables, modeling non-linear relationships, assessment of the importance
of each variable for the generation of the final model,
calculation of modeling errors, among others (Breiman,
2001; Liaw; Wiener, 2002). However, despite of classifying the variables according to their importance to the model
(Archer; Kimes, 2008), this method does not generate a final
equation of the model, as opposed to SMLR. Therefore, it is sometimes referred to as a black-box method (Grimm et al., 2008), although some works have pointed out that this method is robust and provides better results than other methods for both spatial and non-spatial predictions (Hengl et al., 2015; Lies; Glaser; Huwe, 2012; Souza et al., 2016).
In recent years, most works involving digital soil mapping has been based on continuous variables for the area of interest, such as satellite images and digital elevation models and their derivatives (e.g. slope, topographic wetness index, curvatures, etc.), to spatialize soils information (Adhikari et al., 2014; Giasson et al., 2015; Menezes et al., 2014; Silva et al., 2016a; Taghizadeh-Mehrjardi et al., 2015). However, when working in smaller areas, mainly in developing countries, it is common to face
difficulties in obtaining data with high spatial resolution,
which tends to make the use of these variables unfeasible. In this sense, pXRF can be an alternative to obtain a large amount of punctual data that, after being spatialized, may contribute to spatial predictions (Silva et al., 2016b).
In spite of the advantages of using pXRF to analyze elemental composition of materials, very few works have used pXRF in Brazil and in other developing countries for studies with a variety of purposes, mainly regarding soils. In this sense, due to the search for methods to obtain soils information in rapid and economical ways, the objectives of this work were: (i) to predict results of laboratory analysis through SMLR and RF from data generated by pXRF, validating the generated models and; (ii) to evaluate the potential of pXRF to aid spatial prediction of analytical
results, reflecting soil properties, generating and validating
maps of soil properties.
MATERIAL AND METHODS
Study area
Ciência e Agrotecnologia, 41(6):648-664, Nov/Dec. 2017
650 SILVA, S. H. G. et al.
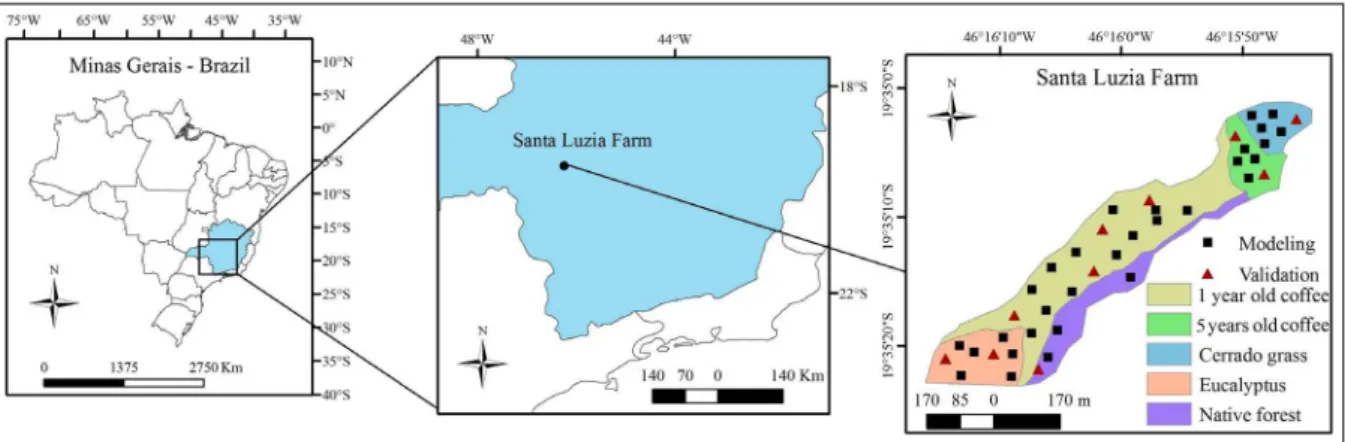
Figure 1: Study area location, land uses and sampling points for modeling and validation.
of the area) and 1 year old (51.8%), 5 year-old eucalyptus plantation (15.4%) and native vegetation of secondary forest (14.7%) and cerrado grasses (8.4%) (Figure 1).
The study area is occupied by typic Dystrophic Haplic Cambisols (95% of the area) followed by typic
Dystrophic Regolithic Neosols (5%), classified using the Brazilian Soil Classification System (Embrapa, 2013),
both with gravels, developed from metapelitic rocks. Soil samples were collected at three depths: 0 to 10 cm, 10 to 20 cm and 20 to 40 cm, at 40 places randomly distributed in the area, making up a total of 120 samples (Figure 1).
Laboratory analyses
Soil samples were air dried, passed through a 2 mm sieve and analyzed in the laboratory where the following soil properties were determined: soil pH in water, exchangeable contents of Ca2+, Mg2+ and Al3+ (Mclean et al.,
1958), available K extracted with Mehlich-l, soil organic matter (OM) (Walkley; Black, 1934), remaining P (P-rem) (Alvarez; Fonseca, 1990), potential (T) and effective (t)
cation exchange capacity (CEC), and base saturation (V).
The samples were also analyzed in the laboratory
with the pXRF of Bruker model S1 Titan LE. This equipment contains 50 kV and 100 μA X-ray tubes. The
software used was GeoChem, in the Trace (dual soil)
configuration, recommended for soils, for 60 seconds,
including two X-ray beams. The 120 samples collected were subjected to analysis in triplicate by pXRF and the accuracy of the equipment was evaluated through scanning
standard reference materials 2710a and 2711a certified by
the National Institute of Standards and Technology (NIST) as well as scanning an equipment standard sample (check
sample - CS). From the NIST and CS certified samples, the
recovery of the element contents obtained by pXRF (% of
recovery = 100 x Obtained content / Total certified content)
were calculated. The recovery percentages of the samples are presented in Table 1 only for the elements that were
identified in all the samples of this work.
Analysis of data and modeling
The results of the laboratory analyses were submitted to descriptive statistics, in the three soil depths evaluated, to obtain the average, maximum and minimum
values, standard deviation and coefficient of variation (CV). From the data of the pXRF, models were adjusted
to predict the following soil properties: exchangeable Ca2+,
Mg2+, K+, Al3+, P-rem, pH, potential CEC (T), effective
CEC (t), soil organic matter (OM) and base saturation (V).
Sample1 Al Si P K Ca Ti Cr Mn Fe Ni Cu Zn Sr
2710a 80.2 58.7 399.8 56.1 36.0 78.4 - 71.6 76.0 - - - 97.8
2711a 67.0 49.8 574.2 44.6 42.1 70.8 118.6 63.1 68.6 98.1 75.2 82.7 92.6
CS 90.2 89.8 - 84.2 - - - 82.5 86.8 99.4 94.4 -
-1 2710a e 2711a - NIST certified samples; CS - equipment certified sample.
2 1 1 [ ] n OOB i i
MSEoob y y n
(1)2 1 1 ( ) n i
RMSE ei mi
n
(2)(3) 1
1
( -in )
ME ei mi
n
Soil samples were randomly separated into modeling and validation data sets, respectively, consisting of 75% and 25% of the total data. Also, the samples were subdivided
and modeled in two ways: i) specific models, according to
the three depths of sampling, with n = 40 for each depth, with 30 samples for modeling and 10 for validation; and ii) general model, including all samples (n = 120, 90 for modeling and 30 for validation).
In order to adjust the models for predicting soil property results from the pXRF data, two methods were tested: stepwise multiple linear regression (SMLR) and random forest algorithm (RF). The SMLR was generated through SigmaPlot software, backward method, in which the least important variables for model adjustment are removed, with 95% probability.
The random forest analysis was performed in R software, randomForest package (Liaw and Wiener, 2015), with the following parameters established: number of trees of the model (ntrees) = 1000, number of variables in each node (nodesize) = 5, and number of variables used in each tree (mtry) = one third of the total number of samples, as suggested by Liaw and Wiener (2002) for regression random forests.
The random forest adjustment results in the mean
square of the residuals (MSEoob), the percentage of the
variance explained by the model and the importance of all the variables of the model in the prediction of the data, by
the out-of-bag method. MSEoob is calculated when, for each
iteration, only a few predictor variables are used to generate
a tree. The MSEoob is calculated through Equation 1. The
importance of the variables, also obtained by the algorithm, is a result of the average of the reduction of the accuracy in the prediction as one variable is left out of the model while the other variables are included. Thus, if a variable is removed, the more the prediction error increases, which means, the accuracy of the prediction decreases, the more important that variable is for the model adjustment (Breiman, 2001; Liaw; Wiener, 2002).
used in the modeling), consisting of 25% of the total data, to determine if the predictions by the models are valid for other observed data. For this, the estimated values for each sample of the independent subset were determined and the accuracy of the models was evaluated through the following
statistical indices: coefficient of determination (R2), adjusted
R2 (R2
adj) in relation to observed and estimated data, root
mean square error (RMSE), and mean error (ME), according to Equations 2 and 3:
in which yi isthe real (observed) value, yiOOB is the mean
of the predictions of OOB for the ith observation, n is the
number of trees.
Accuracy of the models
The validation of the general and specific (per depth) models generated by SMLR and random forest was performed using the independent subset of data (not
where n: number of observations, ei: values estimated by the model, and mi: values observed through laboratory analysis.
The efficiency of the modeling methods (SMLR and
random forest) was carried out in addition to the determination of the analytical results capable of being predicted with greater accuracy from the generated models. In this sense, the models that obtained the highest values of R2 and R2
adj
and the smallest RMSE and ME comparing observed with
estimated data were considered the best for prediction of the results of laboratory analysis from the pXRF data.
Spatial prediction of soil properties from pXRF data From the definition of the best method for modeling,
the laboratory results that presented high accuracy of predictions were spatialized for the entire study area. This procedure aimed to evaluate the possibility of using pXRF data as a basis for mapping soil properties (Duda et al., 2017; Silva et al., 2016b), providing easily obtainable variables, at low cost, rapidly and with no generation of chemical residues.
Ciência e Agrotecnologia, 41(6):648-664, Nov/Dec. 2017
652 SILVA, S. H. G. et al.
1
1
1
p i i
n p i
i
d
d
(4)
where di is the distance between two points, p is a power parameter, and n represents the number of sampled points used for the estimation.
The predicted maps of the soil properties were also validated with 25% of the samples (not used for the modeling) through the R2, R2
adj, RMSE, ME and 1: 1 graphs
(observed vs. estimated data).
RESULTS AND DISCUSSION
Descriptive statistics
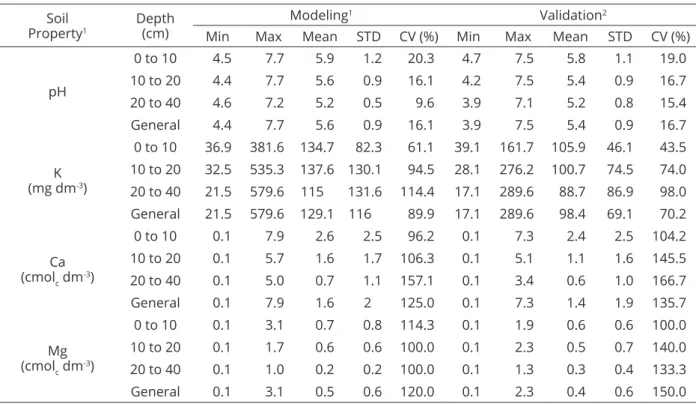
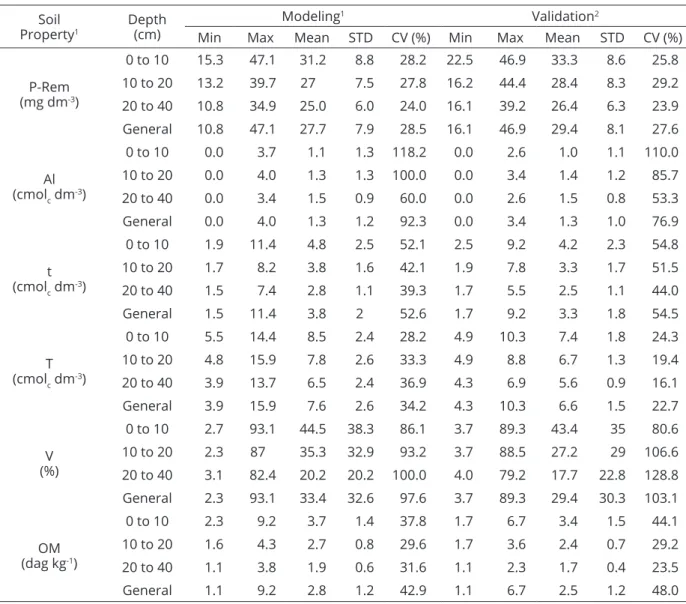
The analytical data of the samples used for modeling and validation are presented in Table 2. There is great variability of values of all evaluated soil properties,
as demonstrated by the high coefficients of variation, in
both modeling and validation data sets. This occurred, as expected, due to the different land uses of the area and soil management practices, ranging from native vegetation, where pH and nutrient contents are lower since no anthropic influence occurs, to cultivated areas, where these values are higher because of liming and fertilizers application. This variability of data can contribute to the generation of more reliable models with possible use for soils with different conditions, since the used values contemplate a wide range of values of the analyzed properties, such as P-rem varying from 10.8 to 47.1 mg dm-3, and pH, from 4.4 to 7.7.
As a general trend, the exchangeable/available
nutrient contents as well as pH, OM, T, t, and V
decreased from the surface to the subsurface, contrary to the exchangeable Al that increases in depth. These facts are in agreement with the fertilizer applications and liming practices, which are carried out on the more
superficial soil layers.Furthermore, although liming
decreases the content of exchangeable Al, this product moves very little in depth in the soil, thus, its corrective effect is more concentrated on the layer in which it is incorporated (Alvarez; Ribeiro, 1999).
Soil
Property1
Depth
(cm)
Modeling1 Validation2
Min Max Mean STD CV (%) Min Max Mean STD CV (%)
pH
0 to 10 4.5 7.7 5.9 1.2 20.3 4.7 7.5 5.8 1.1 19.0
10 to 20 4.4 7.7 5.6 0.9 16.1 4.2 7.5 5.4 0.9 16.7
20 to 40 4.6 7.2 5.2 0.5 9.6 3.9 7.1 5.2 0.8 15.4
General 4.4 7.7 5.6 0.9 16.1 3.9 7.5 5.4 0.9 16.7
K
(mg dm-3)
0 to 10 36.9 381.6 134.7 82.3 61.1 39.1 161.7 105.9 46.1 43.5
10 to 20 32.5 535.3 137.6 130.1 94.5 28.1 276.2 100.7 74.5 74.0 20 to 40 21.5 579.6 115 131.6 114.4 17.1 289.6 88.7 86.9 98.0 General 21.5 579.6 129.1 116 89.9 17.1 289.6 98.4 69.1 70.2
Ca
(cmolc dm-3)
0 to 10 0.1 7.9 2.6 2.5 96.2 0.1 7.3 2.4 2.5 104.2
10 to 20 0.1 5.7 1.6 1.7 106.3 0.1 5.1 1.1 1.6 145.5
20 to 40 0.1 5.0 0.7 1.1 157.1 0.1 3.4 0.6 1.0 166.7
General 0.1 7.9 1.6 2 125.0 0.1 7.3 1.4 1.9 135.7
Mg
(cmolc dm-3)
0 to 10 0.1 3.1 0.7 0.8 114.3 0.1 1.9 0.6 0.6 100.0
10 to 20 0.1 1.7 0.6 0.6 100.0 0.1 2.3 0.5 0.7 140.0
20 to 40 0.1 1.0 0.2 0.2 100.0 0.1 1.3 0.3 0.4 133.3
General 0.1 3.1 0.5 0.6 120.0 0.1 2.3 0.4 0.6 150.0
Table 2: Descriptive statistics of soil properties in modeling and validation data sets.
130 samples for 0 to 10 cm, 10 to 20 cm and 20 to 40 cm, and 90 samples for General; 210 samples for 0 to 10 cm, 10 to
20 cm and 20 to 40 cm, and 30 samples for General; Min: minimum value; Max: maximum value; STD: standard deviation; CV: coefficient of variation; P-Rem: Remaining phosphorus; t: effective cation exchange capacity; T: potential cation exchange capacity; V: base saturation; OM: organic matter.
Table 2: Continuation...
The pXRF determined 16 elements for all analyzed samples, being them Al2O3, Fe, SiO2, CaO, P2O5, K2O, Cl,
Ti, V, Cr, Mn, Ni, Cu, Zn, Zr e Sr. Table 3 presents the
descriptive statistics for the pXRF data.
Modeling soil properties through stepwise multiple linear regression
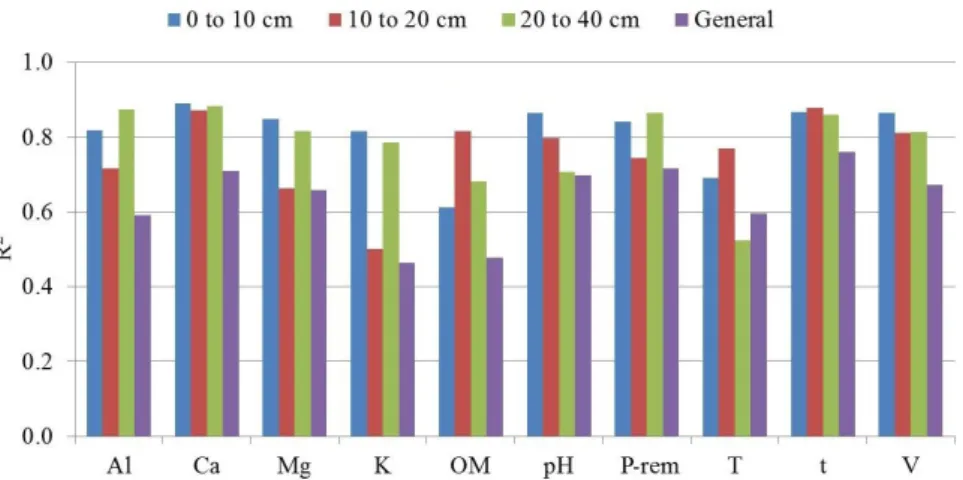
Analyzing Figure 2, which shows the R2 values from
the SMLR models, it is noticed that high values were found with at least one model obtaining R2 greater than 0.8 for all
of the soil properties, except for T. Among the three depths, 0 to 10 and 20 to 40 presented, in general, higher values than 10 to 20. The latter only presented better adjustment for OM and t. These values indicate the potentiality of using pXRF to provide variables for adjusting prediction equations of soil properties in tropical regions. Works such as Sharma et al. (2015), who used pXRF data to perform CTC prediction in soils of the United States, obtaining adequate results using SMLR, corroborate the appropriate soil property predictions from pXRF data.
Soil
Property1 Depth(cm)
Modeling1 Validation2
Min Max Mean STD CV (%) Min Max Mean STD CV (%)
P-Rem (mg dm-3)
0 to 10 15.3 47.1 31.2 8.8 28.2 22.5 46.9 33.3 8.6 25.8 10 to 20 13.2 39.7 27 7.5 27.8 16.2 44.4 28.4 8.3 29.2 20 to 40 10.8 34.9 25.0 6.0 24.0 16.1 39.2 26.4 6.3 23.9 General 10.8 47.1 27.7 7.9 28.5 16.1 46.9 29.4 8.1 27.6
Al
(cmolc dm
-3)
0 to 10 0.0 3.7 1.1 1.3 118.2 0.0 2.6 1.0 1.1 110.0
10 to 20 0.0 4.0 1.3 1.3 100.0 0.0 3.4 1.4 1.2 85.7
20 to 40 0.0 3.4 1.5 0.9 60.0 0.0 2.6 1.5 0.8 53.3
General 0.0 4.0 1.3 1.2 92.3 0.0 3.4 1.3 1.0 76.9
t
(cmolc dm-3)
0 to 10 1.9 11.4 4.8 2.5 52.1 2.5 9.2 4.2 2.3 54.8
10 to 20 1.7 8.2 3.8 1.6 42.1 1.9 7.8 3.3 1.7 51.5
20 to 40 1.5 7.4 2.8 1.1 39.3 1.7 5.5 2.5 1.1 44.0
General 1.5 11.4 3.8 2 52.6 1.7 9.2 3.3 1.8 54.5
T
(cmolc dm-3)
0 to 10 5.5 14.4 8.5 2.4 28.2 4.9 10.3 7.4 1.8 24.3
10 to 20 4.8 15.9 7.8 2.6 33.3 4.9 8.8 6.7 1.3 19.4
20 to 40 3.9 13.7 6.5 2.4 36.9 4.3 6.9 5.6 0.9 16.1
General 3.9 15.9 7.6 2.6 34.2 4.3 10.3 6.6 1.5 22.7
V
(%)
0 to 10 2.7 93.1 44.5 38.3 86.1 3.7 89.3 43.4 35 80.6
10 to 20 2.3 87 35.3 32.9 93.2 3.7 88.5 27.2 29 106.6
20 to 40 3.1 82.4 20.2 20.2 100.0 4.0 79.2 17.7 22.8 128.8
General 2.3 93.1 33.4 32.6 97.6 3.7 89.3 29.4 30.3 103.1
OM (dag kg-1)
0 to 10 2.3 9.2 3.7 1.4 37.8 1.7 6.7 3.4 1.5 44.1
10 to 20 1.6 4.3 2.7 0.8 29.6 1.7 3.6 2.4 0.7 29.2
20 to 40 1.1 3.8 1.9 0.6 31.6 1.1 2.3 1.7 0.4 23.5
Ciência e Agrotecnologia, 41(6):648-664, Nov/Dec. 2017 654
SILVA, S. H. G. et al.
Table 3: Descriptive statistics for data (ppm) obtained bythe portable X-ray fluorescence spectrometer (pXRF) for the different data
sets (per soil depth and general).
1Element contents in parts per million (ppm); STD: Standard deviation; Min:Minimum value; Max: Maximum value.
Element1 STD Min Max Mean STD Min Max Mean STD Min Max Mean STD Min Max Mean
---0 to 10 cm--- ---10 to 20 cm--- ---20 to 40 cm---
---General---Al2O3 15925 74304 134546 104199 13927 79488 135889 108193 17330 64404 138396 112199 15952 64404 138396 108197
SiO2 52248 273598 463722 380374 48603 282641 506353 376470 59629 276203 533520 388995 53343 273598 533520 381946
P2O5 2396 302 12332 1670 1045 0 5790 906 752 0 4248 787 1602 0 12332 1121
Cl 292 198 1432 829 419 360 2119 919 527 331 3243 910 421 198 3243 886
K2O 2794 16041 26437 21944 4216 16460 32830 23850 6942 12823 44171 25624 5131 12823 44171 23806
CaO 16446 439 75820 8982 7892 468 43702 3585 2943 251 16496 1668 10997 251 75820 4745
Ti 2079 4786 15467 7102 1291 4174 9984 6497 1071 3453 8723 5717 1628 3453 15467 6439
V 43 0 177 76 42 18 162 74 38 15 201 80 41 0 201 76
Cr 28 0 88 42 23 17 109 67 21 32 115 83 29 0 115 64
Mn 122 50 590 208 92 55 459 183 97 51 489 162 105 50 590 184
Fe 9010 32217 71056 47962 8127 34891 67100 51298 9339 37403 77675 53538 9039 32217 77675 50933
Ni 7 0 24 11 7 0 27 10 7 0 24 9 7 0 27 10
Cu 10 22 71 32 5 23 48 30 4 23 39 30 7 22 71 31
Zn 19 16 107 34 8 15 56 27 7 11 41 26 13 11 107 29
Sr 34 8 161 52 19 11 82 38 19 11 89 37 26 8 161 42
The general equation presented lower R2 values in
most cases, which may be due to the greater heterogeneity of the samples used in this modeling. In contrast, these results demonstrate that adjusting equations according to the depth of sampling tends to provide better models using SMLR. Souza et al. (2016) used SMLR for bulk density prediction, comparing models created only for A horizon, only for B horizon and a general one, encompassing the two horizons, and also obtained better adjustments for the equations for horizons separately in relation to the general model.
Table 4 shows the equations with R² values greater than or equal to 0.80 generated for 0 to 10 cm, 10 to 20 cm, 20 to 40 cm. The general models did not reach R2 of
0.80. It is noticed that, in the 17 equations presented, the CaO content was the one that appeared more often (15 equations), followed by SiO2 (12 equations) and Fe (11 equations). Also, for 0 to 10 cm, 8 equations presented R2
of at least 0.80, against 4 for 10 to 20 cm and 5 for 20 to 40 cm. Thus, these equations indicate that exchangeable
Ca, Mg, K, Al as well as P-rem, pH, t, V(%) and OM
could be adequately modeled by SMLR using pXRF data.
Modeling soil properties through random forest
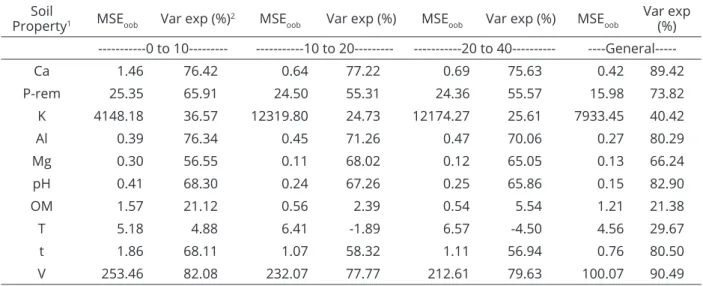
Table 5 shows the results of random forest modeling:
MSEoob and the percentage of variance explained for each
model (general and specific). With the exception of Mg, it
is observed that the percentage of the variance explained by the models for the analyzed soil properties decreased in depth, being greater, therefore, for the 0 to 10 cm depth and smaller for the 20 to 40 cm depth. However, the general
model was the one that presented the lowest MSEoob and the
highest percentages of the explained variance. This may be
due to the greater amount of data used for this model (n = 90) relative to the models for only one depth (n = 30). This result is contrary to that found with SMLR modeling, in which
the general models were mostly worse than the specific ones
(by depth). Carvalho Junior et al. (2016) compared SMLR models generated with different sets of variables and number of samples to estimate the bulk density and noticed that R2
values were lower for the models with greater amount of samples. In the same work, they noticed that the models generated by random forest with greater amount of data presented better adjustments than those with smaller amount
of data, in agreement with the findings of this work.
Table 5 indicates that the soil properties most
explained by the general and specific random forest models
were base saturation, exchangeable Ca and Al, and pH, whereas OM and T were the least explained. K was the
variable with the highest MSEoob, indicating larger prediction
errors (to be confirmed by the validation of the models).
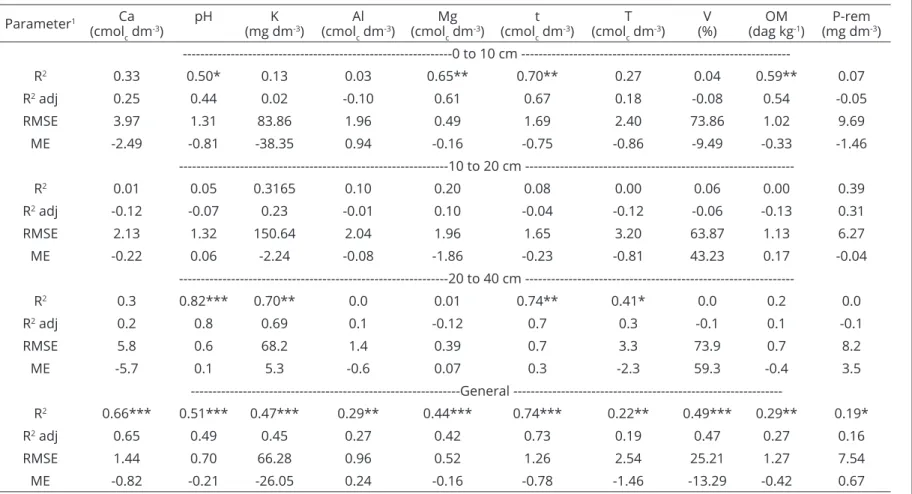
Validation of models generated with stepwise multiple linear regression and random forest
The R² values resulted from the comparison between the observed and estimated values generated by SMLR and random forest for the validation of samples are presented in Tables 6 and 7. It is noted that the highest R² values were obtained in predictions with random forest rather than with SMLR for the soil properties, except for K. Available K was also the predicted soil property that presented the highest
MSEoob values in the modeling phase (Table 5). Differences
were verified between the R2 values of the validation of the
analyzed properties prediction with random forest models
Figure 2: Coefficient of determination (R2) of the equations to modeling soil properties through stepwise multiple linear
Ciência e Agrotecnologia, 41(6):648-664, Nov/Dec. 2017
656 SILVA, S. H. G. et al.
Table 4: Stepwise multiple linear regression equations with R² ≥0.80, in different depths to predict exchangeable
Ca (cmolc dm-3), exchangeable Mg (cmol
c dm
-3), available K (mg dm-3), exchangeable Al (cmol
c dm
-3), pH, effective
cation exchange capacity (t) (cmolc dm
-3), base saturation (V) (%), remaining P (P-rem) (mg dm-3) and organic
matter content (OM) (%) from pXRF data (ppm).
Equation R²
- 0 to 10 cm
---Ca = 13.211 + 0.0000481Al2O3 - 0.0000213SiO2 - 0.000950P2O5 + 0.00358Cl - 0.0436Cr - 0.000257Fe
+ 0.232Cu + 0.0326Sr - 0.0192Zr 0.89
Mg = 1.903 + 0.0000984K2O + 0.0000332CaO - 0.00867Cr - 0.00176Mn - 0.0146Zr 0.85
K = 32.668 + 0.0133K2O + 0.00329CaO + 0.621V - 2.088Cr - 0.327Mn + 6.258Cu - 2.352Sr - 0.937Zr 0.81
Al = 3.053 + 0.000835P2O5 - 0.00163Cl - 0.0000676CaO + 0.0103V + 0.0299Cr + 0.00383Mn -
0.131Cu 0.82
pH = 6.442 - 0.00000519SiO2 - 0.000615P2O5 + 0.00102Cl + 0.000100K2O + 0.0000816CaO -
0.0209Cr - 0.0000533Fe + 0.0677Cu 0.86
t = 6.281 + 0.000352K2O - 0.0373Cr - 0.00586Mn + 0.0706Zn - 0.0442Zr 0.87
V = 16.322 + 0.00101Al2O3 - 0.000315SiO2 - 0.0193P2O5 + 0.0524Cl + 0.00164CaO - 0.912Cr -
0.0646Mn -0.00302Fe +3.552Cu 0.89
P-rem = 41.156 + 0.000125Al2O3 + 0.00704Cl - 0.000401CaO - 0.118Cr - 0.000721Fe + 0.276Sr 0.84 -- 10 to 20 cm
---Ca = 4.449 + 0.0000756Al2O3 - 0.0000113SiO2 + 0.000217CaO + 0.00131Ti + 0.0143V - 0.000323Fe -
0.0561Ni + 0.269Cu - 0.296Zn 0.87
t = 12.538 + 0.0000671Al2O3 - 0.0000223SiO2 + 0.000203CaO + 0.000725Ti + 0.0189V + 0.00607Mn -
0.000294Fe + 0.190Cu - 0.226Zn 0.87
V = 113.847 + 0.00145Al2O3 - 0.000221SiO2 + 0.00418CaO + 0.0304Ti + 0.309V - 0.00675Fe - 1.449Ni
+ 4.983Cu - 6.450Zn 0.81
OM = 4.057 + 0.0000406Al2O3 - 0.0000121SiO2 - 0.000512Cl + 0.000119CaO + 0.0000697Fe -
0.0432Ni - 0.0746Cu - 0.0543 Sr 0.82
20 to 40 cm
---Ca = -2.866 + 0.00000409SiO2 + 0.0000237K2O + 0.000318CaO + 0.000150Ti 0.88
Al = 10.433 - 0.0000173SiO2 + 0.000722P2O5 - 0.000112K2O - 0.000290CaO - 0.000400Ti + 0.0202Cr
+ 0.00502Mn - 0.0000890Fe + 0.0661Zn 0.0173Zr 0.87
t = 4.037 - 0.00000469SiO2 - 0.000506Cl + 0.000334CaO + 0.00278Mn 0.86 V = - 71.659 + 0.000172SiO2 - 0.00931Cl + 0.00134K2O + 0.00404CaO + 0.00503Ti + 0.346Sr - 0.247Zr 0.81 P-rem = - 26.468 + 0.000121SiO2 - 0.00390P2O5 + 0.000751K2O + 0.00150CaO - 0.193Cr - 0.0126Mn
+ 0.000490Fe - 0.612Zn + 0.141Sr - 0.0576Zr 0.86
and SMLR, especially exchangeable Ca and Al, pH and t, being them better predicted with random forest. This suggests that random forest presents greater potential for estimating
analytical results, reflecting soil properties, from pXRF data. RMSE, ME and R2
adj, presented in Tables 6 and 7,
corroborate the best predictions with random forest in relation to the SMLR. Souza et al. (2016) compared model adjustments for predicting bulk density using SMLR and random forest, also obtaining better results with random forest, in consonance with this work.
In the validation of the models obtained with SMLR, only pH of the 20 to 40 cm depth model and of the general model, exchangeable Al in general model, and t
and OM by the 20 to 40 cm depth model presented RMSE
values lower than 1.0, while in the validation by random forest, Ca, pH, Al , Mg, t and OM showed values lower than that at all depths and in the general model (Tables 6
and 7). The absolute values of ME were also mostly smaller
Soil
Property1 MSEoob Var exp (%)2 MSEoob Var exp (%) MSEoob Var exp (%) MSEoob Var exp (%)
---0 to 10--- ---10 to 20--- ---20 to 40---
----General---Ca 1.46 76.42 0.64 77.22 0.69 75.63 0.42 89.42
P-rem 25.35 65.91 24.50 55.31 24.36 55.57 15.98 73.82
K 4148.18 36.57 12319.80 24.73 12174.27 25.61 7933.45 40.42
Al 0.39 76.34 0.45 71.26 0.47 70.06 0.27 80.29
Mg 0.30 56.55 0.11 68.02 0.12 65.05 0.13 66.24
pH 0.41 68.30 0.24 67.26 0.25 65.86 0.15 82.90
OM 1.57 21.12 0.56 2.39 0.54 5.54 1.21 21.38
T 5.18 4.88 6.41 -1.89 6.57 -4.50 4.56 29.67
t 1.86 68.11 1.07 58.32 1.11 56.94 0.76 80.50
V 253.46 82.08 232.07 77.77 212.61 79.63 100.07 90.49
Table 5: Mean error of prediction by the out-of-bag method (MSEoob) and percentage of the explained variance of
the models originated using the random forest algorithm.
1Ca, Mg, Al, T and t in cmol c dm
-3; P-rem and K in mg dm-3; OM in dag kg-1; V in %; 2Var exp (%) = percentage of the variance of
the models explained.
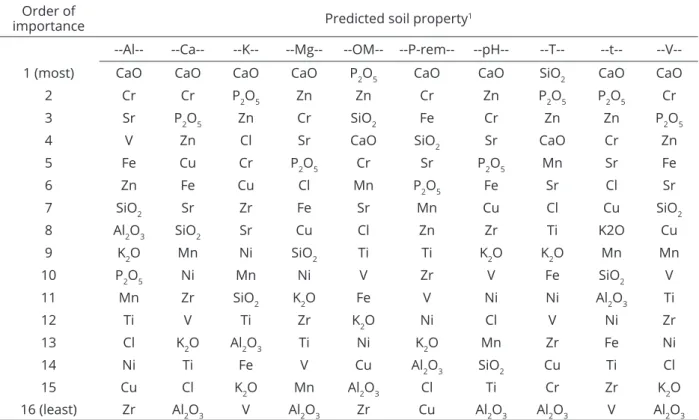
Importance of variables
By analyzing the importance of the variables for the explanation of the data with random forest, eight out of the ten soil properties predicted through pXRF data had CaO as the most important variable (Table 8, Figure 3) and, among these ten soil properties, base saturation, and exchangeable Al and Ca had Cr as the second most important variable. P2O5 was the most important variable to predict OM, followed by Zn, whereas SiO2 was the most important to predict T, with P2O5 as the second most important variable. Aldabaa et al. (2015) used pXRF, remote sensing data and
visible infrared diffuse reflectance spectroscopy (VisNIR
DRS) to predict values of electrical conductivity and
verified that, among the pXRF variables, Cl and S were
the most important elements for predictions.
The frequency that each pXRF variable appeared in
the first three positions of importance for the predictions
shows that CaO was the one that appeared most (8 times), followed by P2O5, Zn, and Cr (6 times each), SiO2 (2), Sr (1) and Fe (1). Figure 3 shows the values of importance for the main variables to help predict soil properties in order to show the greater importance of CaO in relation to the other important variables.
In contrast to the most important variables, the ones that appeared more often in the last three positions were Al2O3 (7), Cu (4), Cl, Zr, V and Ti (3 times each), K2O (2), and SiO2, Mn Cr, Fe and Ni (1 each). It is worth noticing that Al2O3 may have not been an important contributor to
the prediction of exchangeable Al since the pXRF obtains total element contents, including both the exchangeable Al and the Al stuck in the structure of soil minerals. However, as the study area has managed areas, the exchangeable Al content is quite variable (Table 2), even having little variation of total Al contents as obtained by pXRF (Table 3), which may have hampered the models. Similar trends can be inferred for available K.
Mapping soil properties with random forest through
pXRF data
Using random forest, which obtained better modeling and validation results than the SMLR, maps of some well predicted soil properties for the 0 to 10 cm layer were prepared and validated (Figure 4). The maps show that the highest contents of plant nutrients Ca and Mg, higher
levels of OM, V, t, higher pH and lower exchangeable Al
content were found in the areas of cultivated coffee, with the oldest crop being the one with better soil chemical conditions for plant development (only considering the chemical soil properties predicted here). Under eucalyptus plantation, the nutrient contents are lower, since this area was fertilized only at the moment of implantation, 5 years earlier the sampling. The areas with the lowest nutrient contents and pH are under native forest and native cerrado grasses, which do not present anthropogenic intervention,
and reflect the high degree of weathering-leaching of these
Ciência e Agrotecnologia, 41(6):648-664, Nov/Dec. 2017 658
SILVA, S. H. G. et al.
Parameter1 Ca
(cmolc dm
-3) pH (mg dmK -3) (cmolAl
c dm
-3) (cmolMg
c dm
-3) (cmolt
c dm
-3) (cmolT
c dm
-3) (%)V (dag kgOM-1) (mg dmP-rem-3)
0 to 10 cm
---R2 0.33 0.50* 0.13 0.03 0.65** 0.70** 0.27 0.04 0.59** 0.07
R2 adj 0.25 0.44 0.02 -0.10 0.61 0.67 0.18 -0.08 0.54 -0.05
RMSE 3.97 1.31 83.86 1.96 0.49 1.69 2.40 73.86 1.02 9.69
ME -2.49 -0.81 -38.35 0.94 -0.16 -0.75 -0.86 -9.49 -0.33 -1.46
10 to 20 cm
---R2 0.01 0.05 0.3165 0.10 0.20 0.08 0.00 0.06 0.00 0.39
R2 adj -0.12 -0.07 0.23 -0.01 0.10 -0.04 -0.12 -0.06 -0.13 0.31
RMSE 2.13 1.32 150.64 2.04 1.96 1.65 3.20 63.87 1.13 6.27
ME -0.22 0.06 -2.24 -0.08 -1.86 -0.23 -0.81 43.23 0.17 -0.04
20 to 40 cm
---R2 0.3 0.82*** 0.70** 0.0 0.01 0.74** 0.41* 0.0 0.2 0.0
R2 adj 0.2 0.8 0.69 0.1 -0.12 0.7 0.3 -0.1 0.1 -0.1
RMSE 5.8 0.6 68.2 1.4 0.39 0.7 3.3 73.9 0.7 8.2
ME -5.7 0.1 5.3 -0.6 0.07 0.3 -2.3 59.3 -0.4 3.5
General
---R2 0.66*** 0.51*** 0.47*** 0.29** 0.44*** 0.74*** 0.22** 0.49*** 0.29** 0.19*
R2 adj 0.65 0.49 0.45 0.27 0.42 0.73 0.19 0.47 0.27 0.16
RMSE 1.44 0.70 66.28 0.96 0.52 1.26 2.54 25.21 1.27 7.54
ME -0.82 -0.21 -26.05 0.24 -0.16 -0.78 -1.46 -13.29 -0.42 0.67
***p<0.001; **p<0.01; *p<0.05. 1RMSE - root mean square error; ME - mean error; t: effective cation exchange capacity; T: potential cation exchange capacity; V:
base saturation; OM: soil organic matter; P-rem: remaining P.
659
Ciência e Agrotecnologia, 41(6):648-664, Nov/Dec. 2017
***p<0.001; **p<0.01; *p<0.05. 1RMSE - root mean square error; ME - mean error; t: effective cation exchange capacity; T: potential cation exchange capacity; V:
base saturation; OM: soil organic matter; P-rem: remaining P.
Parameter1 Ca
(cmolc dm
-3) pH (mg dmK -3) (cmolAl
c dm
-3) (cmolMg
c dm
-3) (cmolt
c dm
-3) (cmolT
c dm
-3) (%)V (dag kgOM-1) (mg dmP-rem-3)
0 to 10 cm
---R2 0.950*** 0.891*** 0.098 0.711** 0.573* 0.957*** 0.485* 0.875*** 0.779*** 0.707**
R2 adj 0.943 0.878 -0.015 0.675 0.520 0.952 0.421 0.859 0.752 0.670
RMSE 0.757 0.415 69.299 0.597 0.460 0.887 1.597 12.802 0.803 5.021
ME -0.346 -0.126 -35.000 -0.145 -0.180 -0.735 -1.044 -1.669 -0.386 1.575
10 to 20 cm
---R2 0.895*** 0.628** 0.310 0.871*** 0.831*** 0.773*** 0.306 0.895*** 0.145 0.835***
R2 adj 0.882 0.581 0.224 0.855 0.810 0.744 0.219 0.882 0.038 0.814
RMSE 0.750 0.566 75.881 0.595 0.409 0.979 1.531 13.449 0.658 5.077
ME -0.341 -0.053 -44.226 0.108 -0.030 -0.359 -1.145 -4.878 -0.271 1.887
20 to 40 cm
---R2 0.915*** 0.730** 0.673** 0.885*** 0.829*** 0.647** 0.311 0.930*** 0.389 0.553*
R2 adj 0.904 0.696 0.632 0.870 0.807 0.603 0.225 0.921 0.313 0.498
RMSE 0.524 0.569 52.671 0.372 0.258 0.780 1.597 11.790 0.384 4.806
ME -0.201 0.029 -23.004 -0.180 0.016 -0.239 -1.423 -1.706 -0.237 2.278
General
---R2 0.955*** 0.885*** 0.390*** 0.856*** 0.707*** 0.937*** 0.377*** 0.946*** 0.601*** 0.764***
R2 adj 0.953 0.881 0.368 0.851 0.696 0.934 0.354 0.944 0.587 0.756
RMSE 0.468 0.355 64.060 0.411 0.310 0.567 1.640 8.488 0.800 4.282
Ciência e Agrotecnologia, 41(6):648-664, Nov/Dec. 2017
660 SILVA, S. H. G. et al.
Order of
importance Predicted soil property1
--Al-- --Ca-- --K-- --Mg-- --OM-- --P-rem-- --pH-- --T-- --t--
--V--1 (most) CaO CaO CaO CaO P2O5 CaO CaO SiO2 CaO CaO
2 Cr Cr P2O5 Zn Zn Cr Zn P2O5 P2O5 Cr
3 Sr P2O5 Zn Cr SiO2 Fe Cr Zn Zn P2O5
4 V Zn Cl Sr CaO SiO2 Sr CaO Cr Zn
5 Fe Cu Cr P2O5 Cr Sr P2O5 Mn Sr Fe
6 Zn Fe Cu Cl Mn P2O5 Fe Sr Cl Sr
7 SiO2 Sr Zr Fe Sr Mn Cu Cl Cu SiO2
8 Al2O3 SiO2 Sr Cu Cl Zn Zr Ti K2O Cu
9 K2O Mn Ni SiO2 Ti Ti K2O K2O Mn Mn
10 P2O5 Ni Mn Ni V Zr V Fe SiO2 V
11 Mn Zr SiO2 K2O Fe V Ni Ni Al2O3 Ti
12 Ti V Ti Zr K2O Ni Cl V Ni Zr
13 Cl K2O Al2O3 Ti Ni K2O Mn Zr Fe Ni
14 Ni Ti Fe V Cu Al2O3 SiO2 Cu Ti Cl
15 Cu Cl K2O Mn Al2O3 Cl Ti Cr Zr K2O
16 (least) Zr Al2O3 V Al2O3 Zr Cu Al2O3 Al2O3 V Al2O3 Table 8: Importance of portable X-ray fluorescence spectrometer (pXRF) variables in decreasing order to predict soil properties.
1available/exchangeable Al, Ca, K, Mg; P-rem - remaining P;OM - soil organic matter; T - potential cation exchange capacity; t -
effective cation exchange capacity; V - base saturation.
Validation of these maps with an external set of
samples (n = 10) resulted in 1:1 graphics between predicted and observed values of the soil properties (Figure 5). For most predicted soil properties, high R2 and R2
adj values were
found, except for available Mg, which had a R2 of 0.30. For
exchangeable Al (R2 = 0.83), P-rem (R2 = 0.80), exchangeable
Ca (R2 = 0.78) and t (R2 = 0.73), adequate spatialized
predictions were found, followed by base saturation (R2 =
0.67), OM (R2 = 0.66), and pH (R2 = 0.54). These results
indicate that, although this mapping procedure has
accumulated errors, first on the spatialization of the pXRF
variables by the IDW, and then during the random forest modeling and predictions, most generated soil property maps presented satisfactory accuracy. This demonstrates the potential of using pXRF as a source of variables
to help predict soil properties also spatially, mainly in areas that lack continuous information in greater detail (e.g., digital elevation model and its derivatives), as it is the case of the study area of this work. In addition, by providing results quickly and inexpensively, it may favor gathering more observations (points visited) in the
field and also, through predictions, reduce the number of
laboratory analyses. The use of pXRF to improve spatial and non-spatial soil predictions was also found by Silva et al. (2016b), who used magnetic susceptibility and pXRF data, as well as continuous variables derived from digital elevation model for soil classes and properties
prediction in Brazil, finding that magnetic susceptibility
and pXRF data increased the models accuracy when associated with terrain data.
Ciência e Agrotecnologia, 41(6):648-664, Nov/Dec. 2017
662 SILVA, S. H. G. et al.
Weindorf; Bakr; Zhu (2014), after presenting examples of correlations among the element contents obtained by pXRF and results of laboratory analysis, suggested that many works using this equipment would be performed focusing on predicting soil properties in the years to come. Here we demonstrated the potential of this
equipment for predicting soil properties also in Brazilian soils, in accordance with Piikki et al. (2016), who used pXRF coupled with three other sensors to predict results of laboratory soil analyses in Kenya, observing that pXRF was frequently employed in good models. Sharma et al. (2014) used pXRF data to predict soil pH from linear regressions.
Data collection through pXRF in this work was carried out in the laboratory; however, the use of this equipment in the
field can accelerate the acquisition of data that is more difficult
to be obtained, through adjustment of models with data from
pXRF scanning in the field. Stockmann et al. (2016) evaluated the concentration of elements in soil profiles to infer about their parent materials using the pXRF in the field, in addition to
making a comparison with the data obtained in the laboratory. In this way, future tests in this line of research are suggested for tropical soils, since the pXRF in association with robust algorithms can increase the amount of data on soils in Brazil both spatially and punctually, providing results rapidly, at low cost and without generation of chemical residues.
CONCLUSIONS
Soil properties such as exchangeable Ca, Mg, Al, pH, organic matter, base saturation, potential and effective
CEC and P-rem could be predicted with high accuracy
by random forest from the data obtained by pXRF, surpassing the predictions made by stepwise multiple linear regression. The variables obtained by pXRF allowed the spatial prediction of soil properties related to soil fertility, leading to the generation of accurate maps, which demonstrates the potential of pXRF to be used as a source of variables to help spatial prediction of soil properties rapidly, at low cost and without generating residues.
ACKNOWLEDGEMENTS
The authors would like to thank National Council
for Scientific and Technological Development (CNPQ), Coordination for the Improvement of Higher Education Personnel (CAPES) and Minas Gerais Foundation for Research Support (FAPEMIG) funding agencies for the financial support that enabled us to develop this work, and
thanks to Luiz da Silva Teixeira.
REFERENCES
ADHIKARI, K. et al. Constructing a soil class map of Denmark based on the FAO legend using digital techniques.
Geoderma, 214-215(2014):101-113, 2014.
ALDABAA, A. A. A. et al. Combination of proximal and remote sensing methods for rapid soil salinity quantification.
Geoderma, 239:34-46, 2015.
ALVAREZ V., V. H.; FONSECA, D. M. Definição de doses de fósforo para a determinação da capacidade máxima de adsorção
de fosfato e para ensaios de casa de vegetação. Revista
Brasileira de Ciência do Solo, 14:49-55, 1990.
ALVAREZ V., V. H.; RIBEIRO, A. C. Calagem. In: RIBEIRO, A. C.; GUIMARÃES, P. T. G.; ALVAREZ V., V. H. (Eds.).
Recomendações para o uso de corretivos e fertilizantes em Minas Gerais - 5° Aproximação. Viçosa: CFSEMG, 1999. p.43-60.
ARCHER, K. J.; KIMES, R. V. Empirical characterization of random forest variable importance measures. Computational Statistics and Data Analysis, 52(4):2249-2260, 2008. BIRKELAND, P. W. Soils and geomorhology. 3rd. ed. New York:
Oxford University Press, 1999. 448p.
BREIMAN, L. Random forests. Machine Learning, 45(1):5-32, 2001. CARVALHO JUNIOR, W. de et al. Regressão linear múltipla e modelo Random Forest para estimar a densidade do solo em áreas montanhosas. Pesquisa Agropecuária Brasileira, 51(9):1428-1437, 2016.
DUDA, B. M. et al. Soil characterization across catenas via
advanced proximal sensors. Geoderma, 298:78-91, 2017.
EMPRESA BRASILEIRA DE PESQUISA AGROPECUÁRIA -
EMBRAPA. Sistema Brasileiro de Classificação de Solos.
3rd. ed. Brasília: Embrapa, 2013. 353p.
GIASSON, E. et al. Instance selection in digital soil mapping: A study case in Rio Grande do Sul, Brazil. Ciência Rural,
45(9):1592-1598, 2015.
GRIMM, R. et al. Soil organic carbon concentrations and stocks on Barro Colorado Island - Digital soil mapping using Random
Forests analysis. Geoderma, 146(1-2):102-113, 2008.
HENGL, T. et al. Mapping soil properties of Africa at 250 m resolution: Random forests significantly improve current
predictions. Plos One, 10(6):0125814, 2015.
IOANNIDES, D. et al. A preliminary study of the metallurgical ceramics from Kition, Cyprus with the application of pXRF.
Journal of Archaeological Science: Reports, 7:554-565, 2016. JUHOS, K.; SZABÓ, S.; LADÁNYI, M. Influence of soil properties
on crop yield: A multivariate statistical approach.
International Agrophysics, 29(4):433-440, 2015.
LIAW, A.; WIENER, M. Classification and regression by random
forest. R News, 2(December):18-22, 2002.
LIAW, A.; WIENER, M. Package “randomForest.” 2015. Available in: <https://cran.r-project.org/web/packages/randomForest/ randomForest.pdf>. Access in: January, 3, 2017.
Ciência e Agrotecnologia, 41(6):648-664, Nov/Dec. 2017
664 SILVA, S. H. G. et al.
LOPES, A. S.; GUILHERME, L. R. G. A career perspective on soil management in the Cerrado Region of Brazil. Advances
in Agronomy, 137:1-72, 2016.
MCLEAN, E. O. et al. Aluminium in soils: I. Extraction methods and magnitud clays in Ohio soils. Soil Science Society of America Proceedings, 22(5):382-387, 1958.
MENEZES, M. D. de et al. Solum depth spatial prediction comparing conventional with knowledge-based digital
soil mapping approaches. Scientia Agricola,
71(4):316-323, 2014.
MENEZES, M. D. de et al. Spatial prediction of soil properties in two contrasting physiographic regions in Brazil. Scientia Agricola, 73(3):274-285, 2016.
MILIĆ, M. pXRF characterisation of obsidian from central Anatolia, the Aegean and central Europe. Journal of Archaeological Science, 41:285-296, 2014.
MOTTA, P. E. F.; BARUQUI, A. M.; SANTOS, H. G. Levantamento
de reconhecimento de média intensidade dos solos da
região do Alto Paranaíba, Minas Gerais. 1. ed. Rio de Janeiro: Embrapa Solos, 2004. 238p.
PEINADO, F. M. et al. A rapid field procedure for screening trace elements in polluted soil using portable X-ray fluorescence (pXRF). Geoderma, 159(1-2):76-82, 2010.
PIIKKI, K. et al. Performance evaluation of proximal sensors for soil assessment in smallholder farms in Embu County,
Kenya. Sensors, 16(11):1-21, 2016.
RESENDE, M. et al. Pedologia: Base para distinção de ambientes. 6th. ed. Lavras: Editora UFLA, 2014. 378p.
RODRIGUES, M. S.; CORÁ, J. E.; FERNANDES, C. Soil sampling intensity and spatial distribution pattern of soils attributes and corn yield in no-tillage system. Revista Brasileira de Ciencia do Solo, 36:599-609, 2012.
ROUILLON, M.; TAYLOR, M. P. Can field portable X-ray fluorescence (pXRF) produce high quality data for
application in environmental contamination research?
Environmental Pollution, 214:255-264, 2016.
SCHAETZL, R. J.; ANDERSON, S. Soil: Genesis and Geomorphology. 1st. ed. New York: Cambridge University Press, 2005. 817p.
SEVERIANO, E. D. C. et al. Potencial de uso e qualidade estrutural de dois solos cultivados com cana-de-açúcar em Goianésia (GO). Revista Brasileira de Ciência do Solo,
33(1):159-168, 2009.
SHARMA, A. et al. Characterizing soils via portable X-ray fluorescence spectrometer: 3. Soil reaction (pH). Geoderma,
232-234:141-147, 2014.
SHARMA, A. et al. Characterizing soils via portable X-ray fluorescence spectrometer: 4. Cation exchange capacity (CEC). Geoderma, 239:130-134, 2015.
SILVA, S. H. G. et al. Retrieving pedologist’s mental model from existing soil map and comparing data mining
tools for refining a larger area map under similar environmental conditions in Southeastern Brazil.
Geoderma, 267:65-77, 2016a.
SILVA, S. H. G. et al. Proximal sensing and digital terrain models
applied to digital soil mapping and modeling of Brazilian
Latosols (Oxisols). Remote Sensing, 8:614-635, 2016b. SOUZA, E. DE et al. Pedotransfer functions to estimate
bulk density from soil properties and environmental covariates: Rio Doce basin. Scientia Agricola,
73(6):525-534, 2016.
STOCKMANN, U. et al. Utilizing portable X-ray fluorescence spectrometry for in-field investigation of pedogenesis.
Catena, 139:220-231, 2016.
TAGHIZADEH-MEHRJARDI, R. et al. Comparing data mining classifiers to predict spatial distribution of USDA-family soil groups in Baneh region, Iran. Geoderma, 253-254:67-77, 2015.
TERRA, J. et al. Análise Multielementar de solos: Uma proposta envolvendo equipamento portátil de fluorescência de raios X. Semina: Ciências Exatas e Tecnológicas, 35(2):207-214, 2014.
WALKLEY, A.; BLACK, I. A. An examination of the Degtjareff
method for determining soil organic matter and a proposed
modification of the chromic acid titration method. Soil Science, 37(1):29-38, 1934.
WEINDORF, D. C. et al. Characterizing soils via portable x-ray fluorescence spectrometer: 2. Spodic and Albic horizons.
Geoderma, 189-190:268-277, 2012.
WEINDORF, D. C.; BAKR, N.; ZHU, Y. Advances in portable X-ray fluorescence (PXRF) for environmental, pedological, and
agronomic applications. Advances in Agronomy,
128:1-45, 2014.
ZHU, Y.; WEINDORF, D. C.; ZHANG, W. Characterizing soils using a portable X-ray fluorescence spectrometer: 1. Soil texture.