Computers 2020, 9, 67; doi:10.3390/computers9030067 www.mdpi.com/journal/computers Article
Experimental Study for Determining the Parameters
Required for Detecting ECG and EEG Related
Diseases During the Timed-Up and Go Test
Vasco Ponciano 1,2, Ivan Miguel Pires 3,4,*, Fernando Reinaldo Ribeiro 1, María Vanessa Villasana 5, Maria Canavarro Teixeira 6,7 and Eftim Zdravevski 8
1 R&D Unit in Digital Services, Applications and Content, Polytechnic Institute of Castelo Branco, 6000-767 Castelo Branco, Portugal; [email protected] (V.P.); [email protected] (F.R.R.) 2 Altranportugal, 1990-096 Lisbon, Portugal
3 Instituto de Telecomunicações, Universidade da Beira Interior, 6200-001 Covilhã, Portugal 4 Department of Computer Science, Polytechnic Institute of Viseu, 3504-510 Viseu, Portugal 5 Faculty of Health Sciences, Universidade da Beira Interior, 6200-506 Covilhã, Portugal;
6 UTC de Recursos Naturais e Desenvolvimento Sustentável, Polytechnique Institute of Castelo Branco, 6001-909 Castelo Branco, Portugal; [email protected]
7 CERNAS—IPCB Research Centre for Natural Resources, Environment and Society, Polytechnique Institute of Castelo Branco, 6001-909 Castelo Branco, Portugal
8 Faculty of Computer Science and Engineering, University Ss Cyril and Methodius, 1000 Skopje, North Macedonia; [email protected]
* Correspondence: [email protected]; Tel.: +351-966-379-785
Received: 13 July 2020; Accepted: 26 August 2020; Published: 27 August 2020
Abstract: The use of smartphones, coupled with different sensors, makes it an attractive solution for measuring different physical and physiological features, allowing for the monitoring of various parameters and even identifying some diseases. The BITalino device allows the use of different sensors, including Electroencephalography (EEG) and Electrocardiography (ECG) sensors, to study different health parameters. With these devices, the acquisition of signals is straightforward, and it is possible to connect them using a Bluetooth connection. With the acquired data, it is possible to measure parameters such as calculating the QRS complex and its variation with ECG data to control the individual’s heartbeat. Similarly, by using the EEG sensor, one could analyze the individual’s brain activity and frequency. The purpose of this paper is to present a method for recognition of the diseases related to ECG and EEG data, with sensors available in off-the-shelf mobile devices and sensors connected to a BITalino device. The data were collected during the elderly’s experiences, performing the Timed-Up and Go test, and the different diseases found in the sample in the study. The data were analyzed, and the following features were extracted from the ECG, including heart rate, linear heart rate variability, the average QRS interval, the average R-R interval, and the average R-S interval, and the EEG, including frequency and variability. Finally, the diseases are correlated with different parameters, proving that there are relations between the individuals and the different health conditions.
Keywords: diseases; electrocardiography; electroencephalography; timed-up and go test; sensors; mobile devices; feature detection; diseases; older adults
1. Introduction 1.1. Background
Currently, the world’s population is increasingly aging, promoting research in several medical areas [1]. Due to the increase in life expectancy, the research studies focused on the elderly population are essential to improve the quality of life of the elderly. There are 157 elderly persons per hundred young people, so we can verify that the number of older adults is around 64% higher than young people [2–5]. Commonly, older adults have different types of pathologies. The automatic identification of these diseases based on the data acquired during the Timed-Up and Go test may allow different preliminary treatments [5–7]. The future generation of older adults will use mobile devices intensively [8,9], allowing the possibility of recognizing different types of diseases with these devices [10–15]. The evolution and high proliferation of the technological equipment with varying kinds of sensors allow the growth of the development of novel medical solutions [16], promoting the elderly to independent living with remote medical control [17].
Several sensors are embedded in mobile devices, but other sensors may be used in conjunction with the internal sensors to provide different measurements related to various physical and physiological parameters [18,19]. Regarding the analysis of different variables of the Timed-Up and Go test, the accelerometer and magnetometer sensors embedded on mobile devices may be used in conjunction with external sensors to perform complementary measurements [20–22].
Previous works show that the accelerometer and magnetometer sensors may support the analysis of the individuals’ functionality, including the gait [23,24]. However, one of the significant problems in this type of study consists in the synchronization of the acquisition of the different types of data from the sensors embedded on mobile devices, and the other sensors connected by over-the-air connection, including Electrocardiography (ECG) and Electroencephalography sensors (EEG) [25–29]. In addition to this challenge, data processing may include the fusion of the data acquired from different sources.
One of the most common tests for the assessment of the performance of the lower limbs is the Timed-Up and Go test, where the analysis of the data acquired from different sources allows the recognition of several healthcare problems, including balance, mobility, fall risk, Parkinson’s disease, amyotrophic lateral sclerosis, and other orthopedic, cardiovascular and brain pathologies [30–35].
The use of ECG and EEG sensors in conjunction with Timed-Up and Go tests allows cardiac problems and other problems associated with the nervous system to be monitored for the first analysis of emergency [25–29]. One of the low-cost solutions that may be used in conjunction with mobile devices is the BITalino device and its sensors [36]. The BITalino device is an example of biomedical equipment that is scalable and versatile, used for the acquisition of different biosignals transmitted by Bluetooth. The ECG sensors detect the duration and variation in size of the ECG waves used for the abnormalities of heart rate. Furthermore, the EEG sensor is used for the capture of the brain activity and it is positioned in a bipolar configuration with two measurement electrodes for the detection of electrical potentials. Combining smartphones with these devices and sensors may allow for the acquisition of cardiac signals, realizing the relationship of these signals with diseases associated with the heart, and the recognition of different healthcare problems.
In this work, we build upon previous studies [37,38] related to the acquisition of data from the accelerometer and magnetometer sensors available on the off-the-shelf mobile devices, pressure sensors available in the back of the chair, and ECG and EEG sensors, for the detection of different types of movement, and cardiac and brain problems. This paper aims to design and develop a method for the acquisition, analysis, and identification of different patterns of diseases with low-cost sensors. To facilitate this, the proposed solution uses embedded smartphone sensors and additional ones connected to a BITalino device [36] to identify patterns in measured ECG and EEG signals during Timed-Up and Go test and find their relation to existing illnesses of patients. We show that such correlation exists and that it can be used to identify emerging medical conditions, so they can be treated from early on.
1.2. Motivation
This research is supported by the ability to accurately identify various parameters during the Timed-Up and Go test [39]. However, the use of mobile devices to help the capture of the various sensors poses several additional restrictions associated with the memory, power processing, among others [40,41]. The data captured during the Timed-Up and Go test are essential for further measurements, where we intend to create a large dataset from different sensors used for additional measures of various diagnostics in medicine.
Different diseases may be recognized by the use of the Timed-Up and Go test [42], allowing healthcare professionals to assess different healthcare conditions of older adults. This implementation may be first aid or preliminary detection of various diseases in an initial state [43]. As it is an easy test, it may be performed with people with neurological disorders [44], allowing the pattern recognition of different diseases. Several parameters may be measured for the detection of cardiac diseases, including the heart rate, linear heart rate variability, the amplitude of complex QRS, and amplitudes of R-R and R-S intervals, for the detection of different diseases.
1.3. Prior Work
The ECG and EEG signals have been used in the past for the recognition of different diseases. The authors of [45] filtered the acquired ECG data and applied a differential transfer function to the signal. The authors of [45] also squared the ECG signal to obtain information about the waveform and to calculate the heart rate. According to the authors of [45], a heart rate below 60 bpm is related to the presence of a bradycardia disease. A tachycardia is identified with a heart rate higher than 100 bpm. In continuation, the premature ventricular contraction is recognized for an amplitude of the QRS complex higher than 120ms [45]. Bradycardia and tachycardia diseases are not identified, but the heart rate is not between 60 and 100 bpm, the premature atrial contraction may be recognized [45].
The detection of different diseases, including normal sinus rhythm, premature atrial beat, atrial fibrillation, supraventricular tachyarrhythmia, pre-excitation, premature ventricular contraction, ventricular bulge, ventricular triplet, ventricular tachycardia, idioventricular rhythm, fusion ventricular block beat of the left branch, block beat of the right branch, were recognized with neural networks with features related to the normalization, maximum pooling, flattening, density, among others, related to several sliding windows [46]. The measurement of the P-R interval and the amplitude of QRS were also used for the recognition of cardiovascular death [47].
In [48], the authors recognized primary and secondary pulmonary hypertension with the amplitude of the P wave in the II derivation, the frontal mid axis of the QRS complex, duration of the QRS complex, deviations of the R and S waves in leads I and V6 and the T wave configurations in the precordial leads, where the best correlation was obtained with the value of the frontal mid-axis of the QRS complex.
The authors of [49] developed a method to detect atrial fibrillation based on the absence of P wave, irregular heart rate, and other variables related to the atrial activity. The implementation of the Pan Tompkins algorithm was used to detect arrhythmias with features related to frequency and time domains [50]. The detection of the coronary artery disease was recognized by the amplitude of QRS interval, and depressions S-T and T wave [51].
With the use of neural networks, the authors of [52,53] also detected various cardiac diseases, including left bundle branch block, right bundle branch block, premature ventricular contraction, Wolff–Parkinson–White syndrome, myocardial ischemia, and myocardial injury, with the duration of P, S, T and QRS, P-R and Q-T intervals, P, R and T amplitudes, and S-T segment.
Parkinson’s disease may be detected with different features, including R-R, P-R, QRS, and Q-T intervals, and the heart rate measured and corrected by Q-T interval, analyzing the Spearman correlation coefficient [54]. Based on different features, including heart rate, P, T and QRS intervals, P durations, and P-R, QRS, Q-T and corrected Q-T intervals, ventricular activation time, and frontal plane axis, the authors of [55] recognized left and right ventricular hypertrophies.
Related to the EEG signal, the authors of [56] implemented machine learning methods for the recognition of various diseases, including Alzheimer’s disease, with different statistical, amplitude, and frequency-based features. On the other hand, the authors of [57] implemented machine learning methods with time–domain features. Epilepsy is detected by various studies with machine learning methods, including Support Vector Machine (SVM), adaptive neuro-fuzzy inference system, and linear classifier, based on different features based on wavelet coefficients, including 2nd order cumulants (mean ± standard deviation), asymmetry, kurtosis, spectral, Renvi, Kolmogorov–Sinai, variance, energy, and the maximum and minimum values of the power spectral density [58–61].
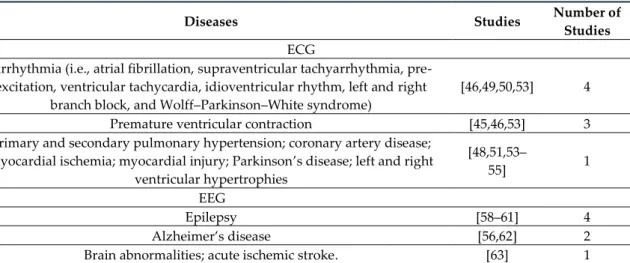
Based on signal strength, window strength, and sample entropy, Alzheimer’s disease is correctly recognized with linear discriminant analysis [62]. Finally, acute ischemic stroke is detected by the densities of the power spectrum acquired by different devices [63]. As presented in Table 1, the diseases recognized by the ECG and EEG sensors are distributed by the number of the studies analyzed.
Table 1. Studies vs. Diseases.
Diseases Studies Number of Studies
ECG
Arrhythmia (i.e., atrial fibrillation, supraventricular tachyarrhythmia, pre-excitation, ventricular tachycardia, idioventricular rhythm, left and right
branch block, and Wolff–Parkinson–White syndrome)
[46,49,50,53] 4
Premature ventricular contraction [45,46,53] 3
Primary and secondary pulmonary hypertension; coronary artery disease; myocardial ischemia; myocardial injury; Parkinson’s disease; left and right
ventricular hypertrophies [48,51,53– 55] 1 EEG Epilepsy [58–61] 4 Alzheimer’s disease [56,62] 2
Brain abnormalities; acute ischemic stroke. [63] 1
1.4. Purpose of the Study
The hypothesis of this research is that Android smartphones complemented by affordable external ECG and EEG sensors can provide a reliable method for the identification of different diseases. In particular, the paper aims to identify the different waves from the ECG and EEG sensors, calculate various metrics based on them, and verify that each disease has distinct features that can facilitate its identification.
The presentation of a method for recognizing the diseases related to ECG and EEG data with sensors, available in off-the-shelf mobile devices, and sensors connected to a BITalino device during the performance of the Timed-Up and Go test is the main contribution of this paper. This document presents the measurement of different features to create a reliable dataset for the recognition of the various diseases present in the sample in analysis. Additionally, this paper presents a state-of-the-art review of the methods used in the literature to identify illnesses related to ECG and EEG signals. The use of mobile devices proves its usability in these types of studies.
The data were previously acquired from people aged between 60 and 97 years old with several diseases. Clinicians already identified the disorders of each participant for the success of this study related to automatic identification, including arterial hypertension, depression, cardiac arrhythmia, coronary artery disease, and Parkinson’s disease. These diseases are only recognized with ECG sensors, where the EEG sensor is only used to detect possible abnormalities. The data acquisition was performed by institutionalized people in the Centre region of Portugal, explicitly in the municipalities of Fundão and Covilhã.
The data acquisition was performed during the performance of the Timed-Up and Go test with Android devices. The accelerometer and magnetometer data from the embedded sensors feature on the mobile device, pressure sensor data are placed on the back of the chair, and the EEG and ECG
sensors are connected to the individual for the data acquisition. The mobile application simultaneous acquire the data from the different sensors, where, after data acquisition, the various text files were uploaded to the Cloud by using the FireBase service.
Commonly, ECG and EEG data are captured while the subject is stationary. Contrary to that, The Timed-Up and Go test involves movement. Be that as it may, there are approaches such as [63] which show that, even in cases when the subject is moving, recognition of different diseases related to ECG and EEG data [64] is still possible. This would be convenient for the users to perform these measurements while having light movement during other tests. Moreover, there also be some advantages to this approach because it can emphasize some emerging medical conditions that may become more apparent during movement. This subject is related to Internal Medicine, and the recognition of different diseases in an early stage is excellent for the treatment of different diseases [65,66].
After the data acquisition, the ECG and EEG data were processed, and the different features were extracted. The features extracted from the ECG sensors were the heart rate, the linear heart rate variability, the average QRS interval, the average R-R interval, and the average R-S interval. Next, the features extracted from the EEG sensor were frequency and variability.
The different features were correlated with the institutions, and the diseases present in the sample. Initially, the correlation between the values extracted from the sample and the diseases identified by the healthcare professionals was performed, verifying that they are commonly determined by different parameters, except the coronary artery disease and bilateral gonarthrosis. Applying different statistical tests, we also proved different correlations between diseases, and parameters extracted, as presented in Section 4.1.
1.5. Structure of the Study
The remaining sections of this paper are organized as follows: Section 2 presents the methods used for the analysis of the data acquired from ECG and EEG sensors during the performance of the Up and Go test by older adults. The study design and participants’ description of the Timed-Up and Go test, the data processing and acquisition processing, and the statistical analysis are presented in Section 3. In continuation, Section 4 discusses the main findings and limitations of the study. The comparison with prior work is also shown in Section 4. Finally, the conclusions of this study are presented in Section 5.
2. Methods
2.1. Study Design and Participants
For the acquisition of data related to the Timed-Up and Go test, this study is designed to use one mobile device with accelerometer and magnetometer sensors, and two BITalino devices with pressure, ECG, and EEG sensors. The mobile device is used for data acquisition and to send the collected data to the server. Several environments may be recognized, but our focus is related to healthcare. This study is a trial to check if, during the performance of the test, we can identify different types of diseases.
This study’s target is related to the population with cardiac and brain problems institutionalized in retirement homes and aged between 60 and 90 years. The sample for the analysis was selected in collaboration with the people responsible in the retirement homes. The requirement is related to the possibility of having mobility capabilities to perform the test. The volunteers were informed of all the rules to complete the test and the instrumentation. They signed the ethical agreement to publish the results of the experiments in an anonymous form.
The tests were performed with a XIAOMI MI6 with the Android operating system, but the different environment variables vary between the various institutions, which influences the data acquisition. The different individuals performed the test between October and December 2019 several times. Initially, the test was performed by 40 older adults, however, due to the over-the-air connection constraints, the ECG and EEG signals were only reliable acquired from 14 individuals with mean age
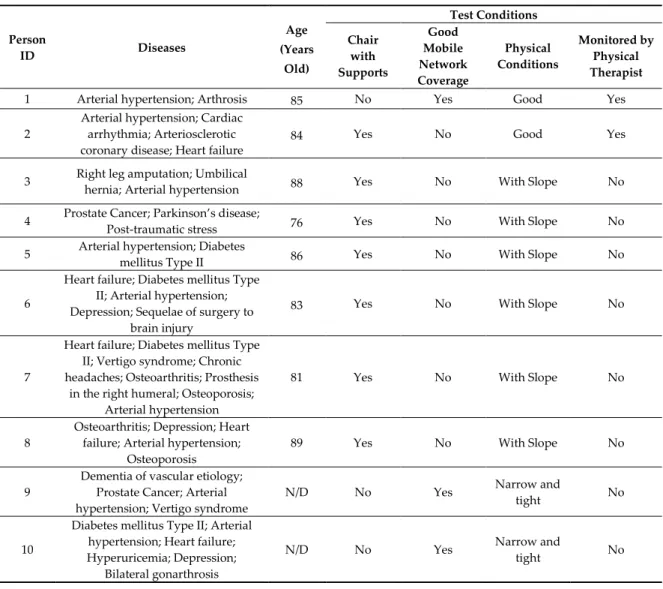
83.1 and a standard deviation of 7.4. The various healthcare diseases were presented in Table 2. The different volunteers have different types of diseases, including multiple sclerosis, diseases related to the heart, such as arrhythmia, or illnesses associated with mental health, such as Parkinson’s disease. Of the participants, 50% had a chair with supports and also 50% of them had good mobile network coverage. Only 14% of the patients were monitored by a physical therapist. The physical condition of 14% was good, 43% were narrow and tight, and 43% had a slope. Thus, the acquired data are heterogeneous. Parkinson’s disease is commonly classified as an illness related to mental health, but the derivations of ECG sensors frequently detect it.
The sample selected has different cardiac and brain problems that result in the creation of a dataset with varying types ofdata that will be processed, as presented in Section 2.2. The essential diseases analyzed were arterial hypertension, depression, cardiac arrhythmia, coronary artery disease, and Parkinson’s disease. The mobile application acquired the data from different sensors with different delays. The accelerometer and magnetometer sensors receive the data every 1 ms, and the pressure, ECG, and EEG sensors acquire the data every 10 ms. The EEG and ECG values taken into account in this study are related to the alpha channel of the sensor. The electrodes of the EEG sensors were placed in the electrically neutral location (left) and measurement electrodes (right), and another electrode in a region of low muscular activity as reference. The two electrodes of ECG sensor were placed at the wrist of the individual. The ECG and EEG sensors connected to the BITalino device has only one channel for the acquisition of the data [36]. The data acquisition process starts with an acoustic signal, which signals the start of the data acquisition.
Table 2. Description of the population of the study and test conditions.
Person ID Diseases Age (Years Old) Test Conditions Chair with Supports Good Mobile Network Coverage Physical Conditions Monitored by Physical Therapist
1 Arterial hypertension; Arthrosis 85 No Yes Good Yes
2
Arterial hypertension; Cardiac arrhythmia; Arteriosclerotic coronary disease; Heart failure
84 Yes No Good Yes
3 Right leg amputation; Umbilical
hernia; Arterial hypertension 88 Yes No With Slope No
4 Prostate Cancer; Parkinson’s disease;
Post-traumatic stress 76 Yes No With Slope No
5 Arterial hypertension; Diabetes
mellitus Type II 86 Yes No With Slope No
6
Heart failure; Diabetes mellitus Type II; Arterial hypertension; Depression; Sequelae of surgery to
brain injury
83 Yes No With Slope No
7
Heart failure; Diabetes mellitus Type II; Vertigo syndrome; Chronic headaches; Osteoarthritis; Prosthesis
in the right humeral; Osteoporosis; Arterial hypertension
81 Yes No With Slope No
8
Osteoarthritis; Depression; Heart failure; Arterial hypertension;
Osteoporosis
89 Yes No With Slope No
9
Dementia of vascular etiology; Prostate Cancer; Arterial hypertension; Vertigo syndrome
N/D No Yes Narrow and
tight No
10
Diabetes mellitus Type II; Arterial hypertension; Heart failure; Hyperuricemia; Depression;
Bilateral gonarthrosis
N/D No Yes Narrow and
11
Heart failure; Chronic obstructive pulmonary disease; Bilateral
gonarthrosis
97 No Yes Narrow and
tight No
12 Diabetes mellitus Type II; Arterial
hypertension 71 No Yes
Narrow and
tight No
13 Arterial hypertension 74 No Yes Narrow and
tight No
14
Arterial hypertension; Pulmonary fibrosis; Hyperuricemia; Anemia; Chronic kidney disease; Cardiac
arrhythmia; Acute myocardial infarction; Hypocoagulated
N/D No Yes Narrow and
tight No
N/D: The values were not reported.
2.2. Description of the Timed-Up and Go Test and Data Acquisition and Processing
In 1991, the Timed-Up and Go was created to help the healthcare professionals for the measurement of the risk of falls [60]. The Timed-Up and Go test is composed of various phases: sitting on the chair, lifting from the chair, walking for three meters, reversing the direction of walking, walking another three meters towards the chair, and sitting on the chair.
During the test’s performance, some technical issues influence the acquisition of signals by the BITalino device, such as the failure of the sensors data acquisition, the Bluetooth connection is lost, among others. This makes it more complicated to perform realistic studies on the field with actual patients, therefore the number of valid data points was reduced. The acquisition of different types of data was performed with a mobile device and two BITalino devices. The sensors used for the measurement of the results of the test and other complementary sensors may be used for the analysis of different parameters of healthcare diseases.
2.3. Statistical Analysis
After the acquisition of the data from the sensors, available in off-the-shelf mobile devices, and the sensors connected to the BITalino device, the data analysis was performed. The main goal is to analyze the data acquired from the ECG and EEG sensors during the performance of the Timed-Up and Go test for helping in recognition of the diseases associated with these sensors. Firstly, the ECG data were processed for the extraction of heart rate, linear heart rate variability, the average of QRS interval, the average of R-R interval, and the average of R-S interval. Finally, the EEG sensor as processed for the extraction of its frequency and variability.
After measuring the different variables, descriptive statistics, normality tests, and detection of outliers were performed. In addition, a statistical comparison between them was performed, analyzing and comparing the results by the averages of each institution, person, age, and healthcare diseases.
3. Results
3.1. Data Acquisition
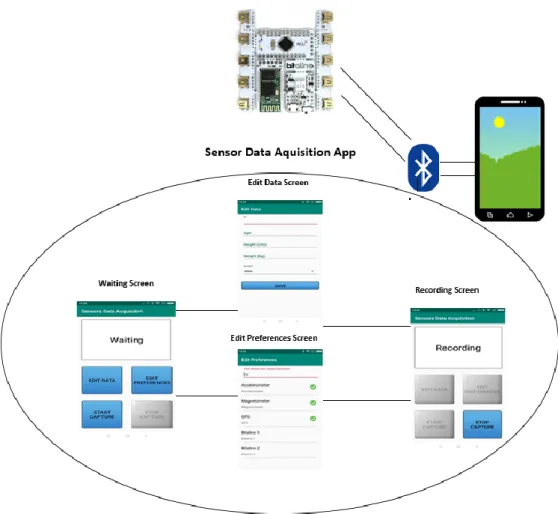
The data were acquired by a mobile application installed in an Android device. It was developed with Android Studio. As presented in Figure 1, the mobile application is composed of components for data acquisition, storage, and send it to a FireBase server. The mobile application acquired data from the onboard sensors, i.e., accelerometer and magnetometer, and two BITalino devices connected by Bluetooth. The BITalino devices receive different sensors’ data at a sampling rate of 10 kHz and 16 bits of precision. The data acquired by onboard sensors are collected with a sampling rate of 1 kHz and 16 bits of precision. Firstly, the ECG sensor was attached to the user in three positions with electrodes on the arm. Finally, the EEG sensor was positioned on the head with two electrodes. This position of the sensors was discussed with healthcare professionals related to medicine and physiotherapy subjects.
On the one hand, this mobile application performed a continuous data collection using the built-in magnetometer and accelerometer sensors. The data were collected with a samplbuilt-ing rate of 1 kHz and 16 bits of precision. On the other hand, the mobile application handled the communication technologies required to receive data through Bluetooth from the BITalino device with a pressure sensor. Still, it was also responsible for sending the collected data to the FireBase service for storage.
Figure 1. Mobile application.
3.2. Requirements
The requirements for performing the experiments were related to the environment and the individual. The individual must have the mobility to complete the test. For the performance of the Timed-Up and Go test, the material and equipment needed consists of a chair, a tape measure to identify the distance to walk, adhesive tape to mark the end of the three meters, where the individual should reverse the gait, two sports belts, where one is for the mobile device and another one for the BITalino device to measure ECG and EEG data, two BITalino devices and one mobile device. The ECG and EEG sensors consisted of the use of electrodes placed in the individual before the test (i.e., three electrodes for ECG sensor, and two electrodes for EEG sensors).
3.3. Validation
The data acquired from the ECG and EEG sensors allowed us to measure different parameters found in the literature, namely:
• ECG sensor: Heart Rate; Linear Heart Rate Variability; Average of QRS interval; Average of R-R interval; Average of R-R-S interval.
In the subsequent sections, the results of the comparison between age and the different variables measured (Section 3.3.1), finalizing this section with the descriptive statistics of the experiments by diseases (Section 3.3.2).
3.3.1. Results by Age
The average age of this group of individuals is 83 years old, varying between a minimum of 71 and a maximum of 97 years of age. The standard deviation is approximately 7 years old, and the respective coefficient of variation (CVs) is 9%, so we can consider the average as a good central indicator of the sample. Thus, in order to study the parameters analyzed by age, we started by organizing individuals into two groups separated by the average sample value, namely individuals aged 83 years or less and individuals aged over 83 years. The age frequency distribution can be seen in Table 3 as <= 83 years old and >83 years old.
Table 3. Frequencies of the different ages.
Class of Age Frequency Percent (%) Valid Percent (%)
Valid [71; 83] 5 35.7 45.5 (83; 97] 6 42.9 54.5 Total 11 78.6 100.0 missing N/D 3 21.4 Total 14 100.0
For the analysis of the signification differences between the averages of age groups, the Student t-test was used to compare the average values. The assumptions of normality were validated, and the equality of variances was tested using the Levene F-test, and it was concluded that the variances between the two age groups for all parameters under analysis are equal (Pr (F > F-test) = p-value > 0.05) (Table 4).
Initially, we processed the ECG and EEG sensor data to identify the different variables. In Table 3, we can also observe the results of the Student’s t-test, through the respective limited probability associated with the test statistic (p-value) and the mean values for the different age ranges for the heart rate, linear heart rate variability, the average of QRS interval, the average of R-R interval, and the average of R-S interval variables obtained with the ECG sensor, and the frequency, and variability obtained with the EEG sensor, of the 11 individuals separated by age. Following the results by age, there are no homogeneous groups found in the sample.
Through the results of the t-student test, we can conclude that, statistically, there are no differences between the means of the two age groups for someone of the analyzed parameters ((Pr (|T|> t -test) = p-value > 0.05); that is, age is not discriminating anything within each parameter
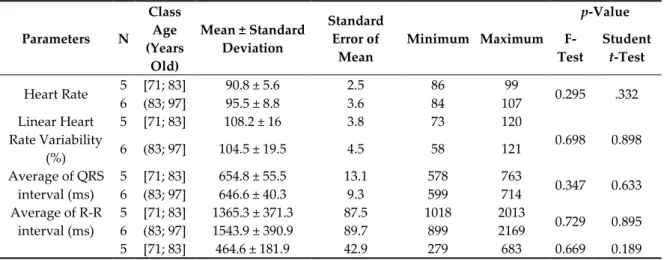
Table 4. Average values of the Electroencephalography (EEG) and Electrocardiography (ECG)
sensors by age for the 14 studied participants.
Parameters N Class Age (Years Old) Mean ± Standard Deviation Standard Error of Mean Minimum Maximum p-Value F-Test Student t-Test Heart Rate 5 [71; 83] 90.8 ± 5.6 2.5 86 99 0.295 .332 6 (83; 97] 95.5 ± 8.8 3.6 84 107 Linear Heart Rate Variability (%) 5 [71; 83] 108.2 ± 16 3.8 73 120 0.698 0.898 6 (83; 97] 104.5 ± 19.5 4.5 58 121 Average of QRS interval (ms) 5 [71; 83] 654.8 ± 55.5 13.1 578 763 0.347 0.633 6 (83; 97] 646.6 ± 40.3 9.3 599 714 Average of R-R interval (ms) 5 [71; 83] 1365.3 ± 371.3 87.5 1018 2013 0.729 0.895 6 (83; 97] 1543.9 ± 390.9 89.7 899 2169 5 [71; 83] 464.6 ± 181.9 42.9 279 683 0.669 0.189
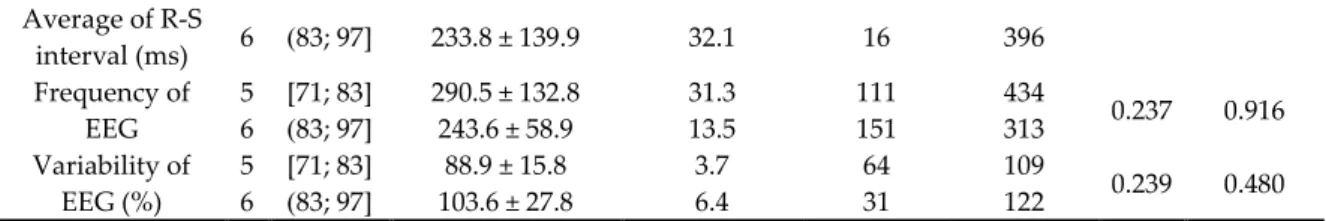
Average of R-S interval (ms) 6 (83; 97] 233.8 ± 139.9 32.1 16 396 Frequency of EEG 5 [71; 83] 290.5 ± 132.8 31.3 111 434 0.237 0.916 6 (83; 97] 243.6 ± 58.9 13.5 151 313 Variability of EEG (%) 5 [71; 83] 88.9 ± 15.8 3.7 64 109 0.239 0.480 6 (83; 97] 103.6 ± 27.8 6.4 31 122 3.3.2. Results by Disease
Finally, we processed the ECG and EEG sensor data to identify the different variables. In Table 5, the average values are presented for the heart rate, linear heart rate variability, the average of QRS interval, the average of R-R interval, and the average of R-S interval variables obtained with the ECG sensor, and the frequency, and variability obtained with the EEG sensor of the individuals separated by disease. This analysis was performed with the disorders present in more than one person. Following the results by illness, there are no homogeneous groups found in the sample.
Table 5. Descriptive statistics of the ECG and EEG sensors by disease for the 14 studied participants.
Parameter Disease N Mean ± Standard Deviation Standard Error of Mean 95% Confidence Interval for
Mean Minimum Maximum Lower Bound Upper Bound Heart Rate Arterial hypertension 12 93.5 ± 7.2 2.1 89.0 98.1 84 107 Cardiac arrhythmia 2 86.5 ± 0.7 0.5 80.2 92.9 86 87 Heart failure 6 90.7 ± 6.0 2.5 84.4 97.0 84 97
Diabetes mellitus Type II 5 93.2 ± 5.7 2.6 86.1 100.3 86 100
Depression 3 89.0 ± 7.0 4.0 71.6 106.4 84 97 Vertigo syndrome 2 94.0 ± 0.0 0.0 94.0 94.0 94 94 Osteoarthritis 2 89.0 ± 7.1 5.0 25.5 152.5 84 94 Osteoporosis 2 89.0 ± 7.1 5.0 25.5 152.5 84 94 Hyperuricemia 2 92.0 ± 7.1 5.0 28.5 155.5 87 97 Bilateral gonarthrosis 2 97.0 ± 0.0 0.0 97.0 97.0 97 97 Chronic obstructive pulmonary disease 1 92.0 ± 7.1 5.0 28.5 155.5 87 97 Linear Heart Rate Variability (%) Arterial hypertension 12 98.4 ± 20.9 6.0 85.1 111.7 58.00 122.00 Cardiac arrhythmia 2 100.0 ± 22.6 16.0 −103.3 303.3 84.00 116.00 Heart failure 6 117.4 ± 4.4 1.8 112.7 122.1 110.00 122.00 Diabetes mellitus Type II 5 104.0 ± 21.8 9.7 77.0 131.0 73.00 122.00 Depression 3 119.4± 3.4 2.0 111.0 127.8 115.60 122.00 Vertigo syndrome 2 103.7 ± 23.1 16.4 −104.1 311.4 87.30 120.00 Osteoarthritis 2 120.4 ± 0.5 0.4 115.9 124.8 120.00 120.70 Osteoporosis 2 120.4 ± 0.5 0.4 115.9 124.8 120.00 120.70 Hyperuricemia 2 103.0 ± 26.9 19.0 −138.4 344.4 84.00 122.00 Bilateral gonarthrosis 2 116.0 ± 8.5 6.0 39.8 192.2 110.00 122.00 Chronic obstructive pulmonary disease 1 97.0 ± 18.4 13.0 −68.2 262.2 84.00 110.00 Average of QRS interval (ms) Arterial hypertension 12 634.2 ± 33.0 9.5 613.2 655.1 579.6 686.1 Cardiac arrhythmia 2 644.1 ± 42.4 30.0 262.9 1025.3 614.1 674.1 Heart failure 6 647.4 ± 39.6 16.2 605.9 688.9 614.1 713.5 Diabetes mellitus Type II 5 637.0 ± 29.3 13.1 600.6 673.4 617.3 686.1 Depression 3 645.9 ± 27.8 16.0 577.0 714.9 620.0 675.2 Vertigo syndrome 2 637.7 ± 26.5 18.7 400.1 875.3 619.0 656.4 Osteoarthritis 2 647.1 ± 39.7 28.1 290.1 1004.1 619.0 675.2 Osteoporosis 2 647.1 ± 39.7 28.1 290.1 1004.1 619.0 675.2 Hyperuricemia 2 647.1 ± 38.3 27.1 303.4 990.8 620.0 674.1 Bilateral gonarthrosis 2 666.8 ± 66.1 46.8 72.7 1260.8 620.0 713.5 Chronic obstructive pulmonary disease 1 693.8 ± 27.9 19.7 443.5 944.1 674.1 713.5 Average of R-R interval (ms) Arterial hypertension 12 1419.1 ± 285.1 82.3 1238.0 1600.2 899 1725 Cardiac arrhythmia 2 1507.0± 203.7 144.0 −322.7 3336.7 1363 1651
Heart failure 6 1433.8 ±
415.2 169.5 998.1 1869.6 1018 2169 Diabetes mellitus Type II 5 1385.2 ±
282.5 126.3 1034.5 1735.9 1018 1678 Depression 3 1255.0 ± 52.7 30.4 1124.1 1386.0 1198 1302 Vertigo syndrome 2 1371.5 ± 499.9 353.5 −3120.1 5863.1 1018 1725 Osteoarthritis 2 1108.0 ± 127.3 90.0 −35.6 2251.6 1018 1198 Osteoporosis 2 1108.0 ± 127.3 90.0 −35.6 2251.6 1018 1198 Hyperuricemia 2 1314.0 ± 69.3 49.0 691.4 1936.6 1265 1363 Bilateral gonarthrosis 2 1717.0 ± 639.2 452.0 −4026.2 7460.2 1265 2169 Chronic obstructive pulmonary disease 1 1766.0 ± 569.9 403.0 −3354.6 6886.6 1363 2169 Average of R-S interval (ms) Arterial hypertension 12 336.1 ± 147.3 42.5 242.5 429.6 15.77 683.00 Cardiac arrhythmia 2 336.0 ± 21.2 15.0 145.4 526.6 321.00 351.00 Heart failure 6 314.3 ± 214.7 87.6 89.0 539.6 15.77 683.00 Diabetes mellitus Type II 5 405.4 ±
160.3 71.7 206.4 604.4 277.00 683.00 Depression 3 208.9 ± 169.7 98.0 -212.6 630.5 15.77 334.00 Vertigo syndrome 2 515.5 ± 236.9 167.5 −1612.8 2643.8 348.00 683.00 Osteoarthritis 2 349.4 ± 471.8 333.6 −3889.6 4588.4 15.77 683.00 Osteoporosis 2 349.4 ± 471.8 333.6 −3889.6 4588.4 15.77 683.00 Hyperuricemia 2 314.0 ± 52.3 37.0 −156.1 784.1 277.00 351.00 Bilateral gonarthrosis 2 266.0 ± 15.6 11.0 126.2 405.8 255.00 277.00 Chronic obstructive pulmonary disease 1 303.0 ± 67.9 48.0 −306.9 912.9 255.00 351.00 Frequency of EEG Arterial hypertension 12 249.7 ± 88.9 25.7 193.2 306.1 111 434 Cardiac arrhythmia 2 225.5 ± 24.7 17.5 3.1 447.9 208 243 Heart failure 6 301.5 ± 67.5 27.6 230.7 372.3 243 434 Diabetes mellitus Type II 5 283.8 ±
115.5 51.6 140.4 427.2 111 434 Depression 3 277.7 ± 6.0 3.5 262.7 292.6 272 284 Vertigo syndrome 2 381.0 ± 75.0 53.0 −292.4 1054.4 328 434 Osteoarthritis 2 353.0 ± 114.6 81.0 −676.2 1382.2 272 434 Osteoporosis 2 353.0 ± 114.6 81.0 −676.2 1382.2 272 434 Hyperuricemia 2 246.0 ± 53.7 38.0 −236.8 728.8 208 284 Bilateral gonarthrosis 2 291.5 ± 10.6 7.5 196.2 386.8 284 299 Chronic obstructive pulmonary disease 1 253.5 ± 64.4 45.5 −324.6 831.6 208 299 Variability of EEG (%) Arterial hypertension 12 90.7 ± 25.6 7.4 74.4 107.0 31.00 122.00 Cardiac arrhythmia 2 93.5 ± 23.3 16.5 −116.2 303.2 77.00 110.00 Heart failure 6 108.8 ± 10.8 4.4 97.5 120.2 89.00 122.00 Diabetes mellitus Type II 5 96.0 ± 13.38 6.0 79.4 112.6 85.00 112.00 Depression 3 114.3 ± 6.8 3.9 97.4 131.2 109.00 122.00 Vertigo syndrome 2 84.0 ± 7.1 5.0 20.5 147.5 79.00 89.00 Osteoarthritis 2 105.5 ± 23.3 16.5 −104.2 315.2 89.00 122.00 Osteoporosis 2 105.5 ± 23.3 16.5 −104.2 315.2 89.00 122.00 Hyperuricemia 2 94.5 ± 24.75 17.5 −127.9 316.9 77.00 112.00 Bilateral gonarthrosis 2 111.5 ± 0.7 0.5 105.2 117.9 111.00 112.00 Chronic obstructive pulmonary disease 1 94.0 ± 24.0 17.0 −122.0 310.0 77.00 111.00
4. Discussion 4.1. Main Findings
During the performance of the Timed-Up and Go test, we used ECG and EEG sensors to acquire the data and correlate the presence of mental and cardiac diseases. The sample of this study includes a diversity of people with different disorders. Thus, the experimental set was composed of sensors available in the off-the-shelf mobile device, i.e., accelerometer and magnetometer, and a pressure, ECG, and EEG sensors connected to a BITalino device. These sensors are practical to use and non-invasive, allowing the acquisition of different types of data. The data were acquired since the individual gets up from the chair and returns to the initial position.
This test was applied to older adults, who anonymously provided their age and information about their diseases for further analysis of the data acquired. The study of the data was performed considering three viewpoints: the viewpoint by age, by the institution, and by diseases related to cardiac and neurological problems. Between the persons analyzed, none of them reported neurological disorders. They reported illnesses that can be detected with ECG and EEG sensors, including arterial hypertension, arrhythmia, heart failure, coronary artery disease, Parkinson’s disease, and others. By the end, the environmental conditions may have also affected the results of the test. The ECG values for the arrhythmia and heart failure are similar, and the values for identifying Parkinson’s disease, and bilateral gonarthrosis are identical.
Therefore, we performed two types of analysis. These are the relation of the data acquired by the different sensors and the diseases reported by the individuals. After that, the statistical correlation between the data obtained and the disorders said.
Starting with the analysis of the data reported by the individuals, and based on the information related to the previous works, arterial hypertension may be identified with the amplitude of QRS interval lower than 700 ms, where most of the analyzed individuals reported this disease, except the persons 4 and 11.
In continuation, the identification of persons with arrhythmia or heart rate failure is identified by the irregularities of the heartbeat. Thus, the linear heart rate variability may be used to recognize these types of diseases, verifying if it is higher than 100%. Most of the persons reported these diseases, such as the persons 2, 6, 7, 8, 10, and 11.
Finally, the identification of Parkinson’s disease and Bilateral gonarthrosis can be performed with the high average of QRS interval and an average R-R interval of more than 2000 ms, allowing the easy recognition of persons 4 and 11. However, person 10 also has bilateral gonarthrosis, but it is not very well recognized because other diseases are present in this person. In this case, the differences in the data related to the Bilateral gonarthrosis and other diseases are minored.
Due to the different conditions of the test’s performance, arterial hypertension is more verified in persons of different ages, except the persons with 76 and 97 years old. Additionally, comparing the different ages, arrhythmia, or heart rate failure is only verified with the increasing, where the persons with age equal to 81, 83, 84, 89, and 97 years old. A pattern of persons with coronary artery disease cannot be identified with the comparison of the different ages. In addition, analyzing the different ages, Parkinson’s disease, and Bilateral gonarthrosis can be verified in persons aged 76 and 97.
Generally, the difference is correctly identified with the various parameters and constraints during the data acquisition. There are no diseases related to the EEG reported by the population, but it is verified that the variability of brain activity increases with age. Additionally, brain activity is lower in people with Parkinson’s disease.
For the diseases and parameters, the two-way analysis of variance test (two-way ANOVA) was performed with the aim of verifying the interaction between the two factors, in order to understand the presence of a disease affected by the values recorded by ECG and EEG sensors.
The model that includes the sources of disease variation and the interaction parameters vs. diseases is highly significant (Pr (F > F test) = 0 for both sources of variation), which means that there is an interaction between both parameters and disease factors.
Through the analysis of the confidence intervals for the mean of interaction between Heart Rate with Diseases, it is possible to conclude that there are no significant differences between the mean values of this interaction (Figure 2)
Figure 2. The 95% confidence interval for mean of interaction between Heart Rate with Diseases.
Through the analysis of the confidence intervals for the mean of interaction between Linear Heart Rate Variability with Diseases, it is possible to conclude that there are no significant differences between the mean values of this interaction (Figure 3).
Figure 3. The 95% confidence interval for mean of interaction between Linear Heart Rate Variability
with Diseases.
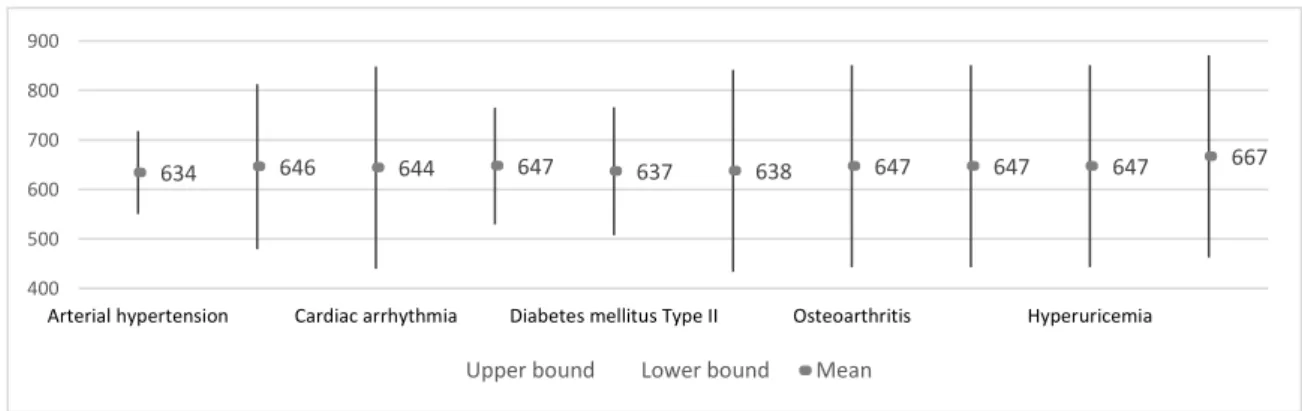
Through the analysis of the confidence intervals for the mean of interaction between Average of QRS interval with Diseases, it is possible to conclude that there are no significant differences between the average values of this interaction (Figure 4)
Figure 4. The 95% confidence interval for mean of interaction between Average of QRS interval with
Diseases.
Through the analysis of the confidence intervals for the mean of interaction between Average of R-R interval with Diseases, it is possible to conclude that there are significant differences between the average values of this interaction. In fact, the average values recorded in patients with Bilateral gonarthrosis is statistically higher than the values recorded in patients with arterial hypertension, depression, Diabetes mellitus Type II, Osteoarthritis and Osteoporosis (Figure 5). On the other hand,
94 89 87 91 93 94 89 89 92 97 -200 -100 100 200 300 400
Arterial hypertension Cardiac arrhythmia Diabetes mellitus Type II Osteoarthritis Hyperuricemia
Upper bound Lower bound Mean
98 119 100 117 104 104 120 120 103 116 -200 -100 0 100 200 300 400
Arterial hypertension Cardiac arrhythmia Diabetes mellitus Type II Osteoarthritis Hyperuricemia
Upper bound Lower bound Mean
634 646 644 647 637 638 647 647 647 667 400 500 600 700 800 900
Arterial hypertension Cardiac arrhythmia Diabetes mellitus Type II Osteoarthritis Hyperuricemia
in the case of these last two diseases, the averages of QRS interval values are expected to be statistically equal but lower, followed by depression.
Figure 5. The 95% confidence interval for mean of interaction between Average of R-R interval with
Diseases.
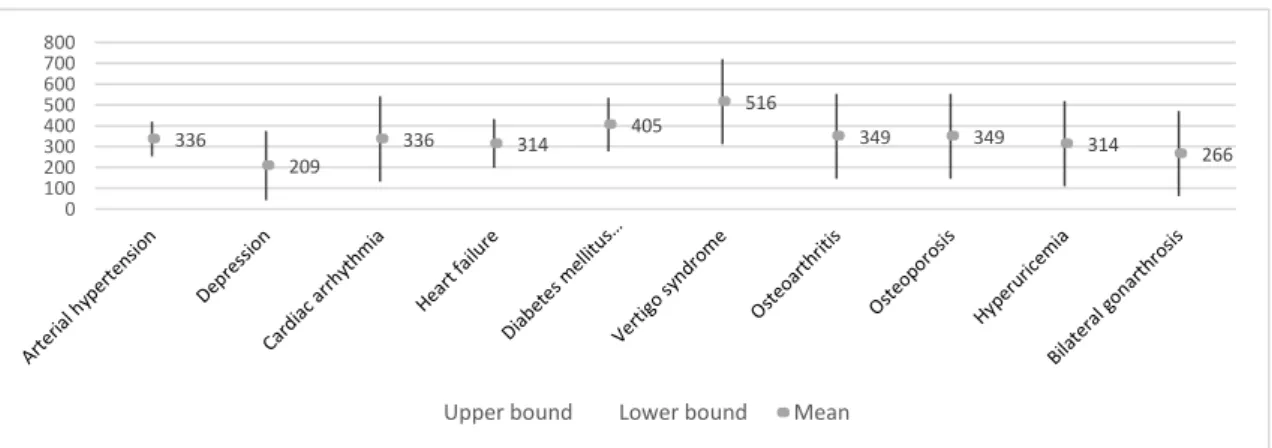
Through the analysis of the confidence intervals for the mean of interaction between Average of R-S interval with Diseases, it is possible to conclude that there are no significant differences between the average values of this interaction (Figure 6). Even so, the average value of this parametron in vertigo syndrome is highlighted. On the other hand, we highlight similar intermediate values for arterial hypertension, cardiac arrhythmia, heart failure, osteoarthritis, osteoporosis and hyperuricemia, as opposed to depression with a lower value.
Figure 6. The 95% confidence interval for mean of interaction between Average of R-S interval with
Diseases.
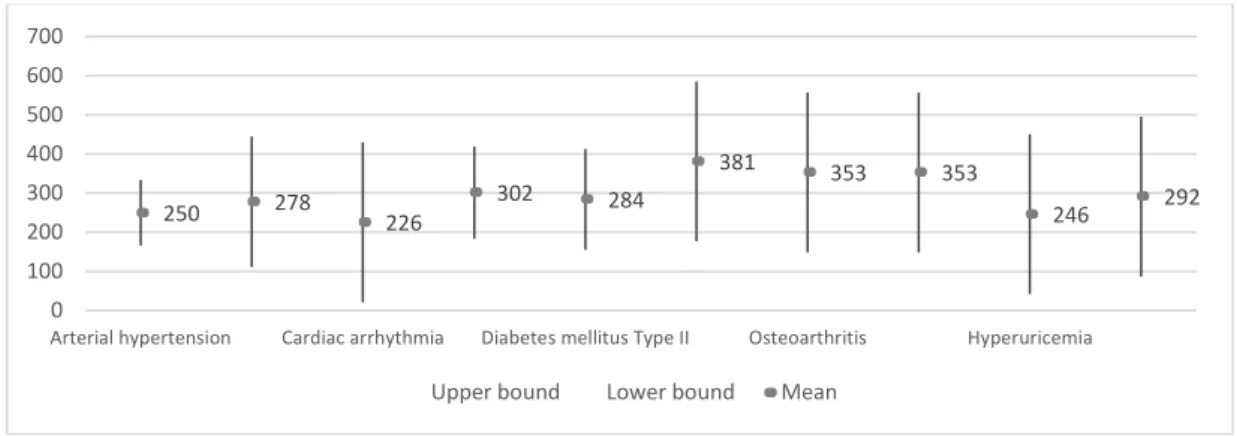
Through the analysis of the confidence intervals for the mean of interaction between Frequency of EEG with Diseases, it is possible to conclude that there are no significant differences between the average values of this interaction (Figure 7). Even so, the average value of this parametron n in vertigo syndrome disease stands out with higher values, followed by osteoarthritis and osteoporosis. In contrast, cardiac arrhythmia, hyperuricemia, and arterial hypertension.
1419 1255 1507 1434 1385 1372 1108 1108 1314 1717 800 1300 1800 2300
Arterial hypertension Cardiac arrhythmia Diabetes mellitus Type II Osteoarthritis Hyperuricemia
Upper bound Lower bound Mean
336 209 336 314 405 516 349 349 314 266 0 100 200 300 400 500 600 700 800
Figure 7. The 95% confidence interval for mean of interaction between Frequency of EEG with
Diseases.
Through the analysis of the confidence intervals for the mean of interaction between Variability of EEG with Diseases, it is possible to conclude that there are no significant differences between the mean values of this interaction (Figure 8).
Figure 8. The 95% confidence interval for mean of interaction between Variability of EEG with
Diseases.
In Figure 9, we can verify the estimated marginal averages resulting from the interaction between parameters and diseases. The parameters of heart rate, linear heart rate variability, average of QRS amplitude, and EEG variability are practically constant for the diseases analyzed.
In the case of arterial hypertension, cardiac arrhythmia, Diabetes mellitus Type II, Vertigo Syndrome and Hyperuricemia, the values of Average of R-S interval are higher than the values of Frequency EEG. For depression and Bilateral gonarthrosis, the reverse is true.
We can also verify that when these two parameters are the same, we are in the presence of heart failure, osteoarthritis or osteoporosis.
Following the Average of R-R interval, we observed that a large difference between this parameter and the Average of R-S interval can mean the presence of Bilateral gonarthrosis disease, cardiac arrhythmia or arterial hypertension. Lower differences can mean the presence of osteoporosis, osteoarthritis, depression or hyperuricemia.
250 278 226 302 284 381 353 353 246 292 0 100 200 300 400 500 600 700
Arterial hypertension Cardiac arrhythmia Diabetes mellitus Type II Osteoarthritis Hyperuricemia
Upper bound Lower bound Mean
90.667 114.333 93.500 108.833 96.000 84.000 105.500 105.500 94.500 111.500 -150 -100 -50 0 50 100 150 200 250 300 350
Arterial hypertension Cardiac arrhythmia Diabetes mellitus Type II Osteoarthritis Hyperuricemia
Figure 9. Marginal estimated means of the interaction between diseases and parameters.
4.2. Limitations
In carrying out the experiments, the capture and calculation of the different features posed some challenges. Thus, the elderly had very different health states, which meant that the acquired values showed high heterogeneity. The environment for the performance of the test also varies, causing different variations on the data.
As the acquired data were stored in the FireBase service, which needs an available Internet connection that sometimes is not possible in real-time. Additionally, as we were using the BITalino device to acquire the data from pressure, ECG, and EEG sensors, the use of the over-the-air connection, i.e., Bluetooth, failed sometimes, causing some inconsistencies in the data. If detected, the individuals repeated the experiments to obtain reliable data. Commonly, all participants performed the experiments three consecutive times.
Finally, another limitation present in the different experiments was related to data processing and storage, which may be difficult to perform in real-time on the mobile device. The BITalino device does not include the timestamps, but it includes a control bit every 10 ms, where we consider its capture after the start of the data acquisition. The data acquisition was started with an acoustic signal, where the data started to acquire. The major challenge was related to the synchronization of the data acquisition, which was sometimes not possible.
4.3. Comparison With Prior Work
Based on the studies analyzed in Section 1.3, 24 diseases were recognized in the 17 research studies, but the majority lack the presentation of detailed parameters for the detection. Still, the majority (20 diseases) does not present the details about the recognition, providing only information about the use of artificial intelligence. Between the diseases reported in the literature, Cardiovascular death [47] is detected by the measurement of the P-R interval, and the amplitude of QRS complex. Next, the Primary and secondary pulmonary hypertension [48] is detected with the Frontal mid-axis of the QRS complex. Coronary artery disease [51] is detected by the Amplitude of QRS complex, and
depressions of S-T and T-wave. A couple of diseases, i.e., Left and right bundle branch block, premature ventricular contraction, Wolff–Parkinson–White syndrome, myocardial ischemia, and myocardial injury are detected by the authors of [53] with durations of P-wave, S-wave, T-wave, QRS interval, P-R interval, Q-T interval, and S-T segment, and the amplitudes of P-wave, R-wave, and T-wave. Parkinson’s disease and Bilateral gonarthrosis are detected by the authors of [54] with the duration of R-R interval, P-R interval, QRS interval, and Q-T interval. In [55], left and right ventricular hypertrophies are detected with the measurement of heart rate, amplitudes of P-wave, T-wave, and QRS interval, and durations of P-wave, P-R interval, QRS interval, Q-T interval, and corrected Q-T interval. In continuation, Alzheimer’s disease [56,57,62] is commonly detected with statistical, amplitude and frequency-based features, and signal strength, window strength, and sample entropy. Acute ischemic stroke [63] is detected with densities of the power spectrum. Finally, Epilepsy [58–61] is detected with the 2nd order cumulants (mean ± standard deviation), asymmetry, kurtosis, spectral, Renvi, Kolmogorov–Sinai, variance, energy, and the maximum and minimum values of the power spectral density. Between the four diseases that have details about the recognition, i.e., Bradycardia, Tachycardia, Premature ventricular contraction, and Premature atrial contraction, one of them was available in our dataset as presented in Table 6. We also verified the normal values of the different parameters for further comparison [67–69].
However, the diseases highlighted in Table 6 were present in our dataset, which verified different conditions for its recognition.
Table 6. Values of the different features measured by different studies.
Study Diseases Parameters Values in the Literature Average Values Obtained in our Study Normal Values in Healthy Adults
[45] Bradycardia Heart rate <60 bpm N/A >60 bpm
<92 bpm
[45] Tachycardia Heart rate >100 bpm N/A >60 bpm
<92 bpm [45] Premature ventricular contraction Duration of QRS interval >120ms N/A >75.5 ms <108.0 ms [45] Premature atrial
contraction Heart rate
>60 bpm <100 bpm N/A >60 bpm <92 bpm [49] Atrial fibrillation Duration of P-wave N/D N/A >80 ms <120 ms
Heart rate Irregular N/A >60 bpm
<92 bpm
[50] Arrhythmia Heart rate
variability N/D >100% N/A
- Heart rate failure Heart rate
variability N/A >100% N/A
- Arterial hypertension Duration of
QRS interval N/A <700 ms >75.5 ms <108.0 ms [54] Parkinson’s disease; Bilateral Gonarthrosis Duration of R-R interval N/A >2000 ms >600 ms <1200 ms Duration of QRS interval N/A >700 ms >75.5 ms <108.0 ms N/A: Not Available. N/D: Not Defined.
Considering the values available in Table 6, it is possible to verify the effects of different diseases and the age of people analyzed in the different studies. The values presented by the authors of [45] are correlated between older adults and healthy adults. The values presented by the authors of [49] are not comparable as the authors did not present the values obtained. The authors of [50] also did not present the values of heart rate variability, but a pattern was verified with our study. Comparing the values reported in other studies to the ones reported in our study, it is evident that the durations of R-R and QRS intervals are higher in older adults. This is an interesting observation that could have
policy implications. For example, some policies might be enhanced to include additional analysis with ECG and EEG during Timed Up and Go tests to hopefully detect some emerging medical conditions before they become too serious. However, in some cases, our dataset may not be enough for the identification of the right patterns, as verified in the recognition of Coronary artery disease. To do that, more individuals with different disorders are needed. Likewise, if some medical condition is identified with the proposed approach, it should be validated with a more traditional clinical method to avoid false positives.
5. Conclusions
The use of functional tests with systems that allow the acquisition of biological signals presents an optimal combination when we want to conclude investigations of this type, and the main goals of this study were to design and develop a method for the acquisition, analysis, and identification of different patterns of diseases with low-cost sensors.
As it was included in research on the results of the Timed-Up and Go test, it was only possible to collect the ECG and EEG signals from a small number of individuals. In the future, this study should be extended to a larger sample to investigate other dependencies. The reported values are in line with other studies in the literature.
In this sense, the Timed-Up and Go test, with all its phases and aspects, presents itself as a great example because it allows the analysis of data related to movement and therefore applied to physiotherapy. On the other hand, the measurement of physical effort and the measurement of signals related to the cardiac and neurological systems can also be calculated and analyzed.
The ECG and EEG data allow us to know and analyze the functioning of the heart and brain during the effort. The use of statistical methods of analysis based on the variance in each individual, considering their physical state, allows us to know and build a set of relationships and patterns for each of the diseases related to the cardiac and neurological system.
The presented results show that it is possible to find correlations between existing diseases and different features extracted from ECG and EEG signals collected during Timed-Up and Go tests. The applied statistical methods suggest that investigation of this type can be critical in helping doctors and in the first analysis of a patient. It shows patterns in the analyzed diseases, showing that people with the same diseases have very similar values, which is very encouraging considering the aim of the study—to detect emerging medical conditions early on. The main contribution of this paper is that the proposed solution was developed end-to-end and uses affordable sensors and devices, and computational methods that are easily deployed on mobile devices with limited computing power and battery capacity.
In the future, and as the development of this research, it will be important to apply artificial intelligence and machine learning methods to allow the calculation and identification of diseases automatically.
Author Contributions: Conceptualization, methodology, software, validation, formal analysis, investigation,
writing—original draft preparation, writing—review, and editing: V.P., I.M.P., F.R.R., M.V.V., M.C.T., and E.Z. All authors have read and agreed to the published version of the manuscript.
Funding: This work is funded by FCT/MEC through national funds and co-funded by FEDER-PT2020
partnership agreement under the project UIDB/EEA/50008/2020.
Acknowledgments: This work is funded by FCT/MEC through national funds and when applicable co-funded
by FEDER-PT2020 partnership agreement under the project UIDB/EEA/50008/2020. (Este trabalho é financiado pela
FCT/MEC através de fundos nacionais e cofinanciado pelo FEDER, no âmbito do Acordo de Parceria PT2020 no âmbito do projeto UIDB/EEA/50008/2020). This article is based upon work from COST Action IC1303-AAPELE—
Architectures, Algorithms and Protocols for Enhanced Living Environments and COST Action CA16226– SHELD-ON—Indoor living space improvement: Smart Habitat for the Elderly, supported by COST (European Cooperation in Science and Technology). More information in www.cost.eu.
References
1. Pires, I.M.; Andrade, M.; Garcia, N.M.; Crisóstomo, R.; Florez-Revuelta, F. Measurement of heel-rise test results using a mobile device. In Proceedings of the Doctoral Consortium—DCPhyCS, (PhyCS 2015), Angers, France, 11–13 February 2015; pp. 9–18.
2. World Health Organization. Ageing and Health. Available online: https://www.who.int/news-room/fact-sheets/detail/ageing-and-health (accessed on 27 December 2019).
3. Blackman, S.; Matlo, C.; Bobrovitskiy, C.; Waldoch, A.; Fang, M.L.; Jackson, P.; Mihailidis, A.; Nygård, L.; Astell, A.; Sixsmith, A. Ambient assisted living technologies for aging well: A scoping review. J. Intell. Syst.
2015, 25, 55–69.
4. Lutz, W.; Sanderson, W.; Scherbov, S. The coming acceleration of global population ageing. Nature 2008,
451, 716–719.
5. Długosz, Z. Population ageing in Europe. Procedia Soc. Behav. Sci. 2011, 19, 47–55.
6. Wu, F.; Li, X.; Sangaiah, A.K.; Xu, L.; Kumari, S.; Wu, L.; Shen, J. A lightweight and robust two-factor authentication scheme for personalized healthcare systems using wireless medical sensor networks. Future
Gener. Comput. Syst. 2018, 82, 727–737.
7. Jagadeeswari, V.; Subramaniyaswamy, V.; Logesh, R.; Vijayakumar, V. A study on medical Internet of Things and Big Data in personalized healthcare system. Health Inf. Sci. Syst. 2018, 6, 14.
8. Piper, A.M.; Garcia, R.C.; Brewer, R.N. Understanding the challenges and opportunities of smart mobile devices among the oldest old: Int. J. Mob. Hum. Comput. Interact. 2016, 8, 83–98.
9. Kim, S.; Gajos, K.Z.; Muller, M.; Grosz, B.J. Acceptance of mobile technology by older adults: A preliminary study. In Proceedings of the 18th International Conference on Human-Computer Interaction with Mobile Devices and Services, Florence, Italy, 6–9 September, 2016; pp. 147–157.
10. Christensen, L.; Vøllestad, N.K.; Veierød, M.B.; Stuge, B.; Cabri, J.; Robinson, H.S. The Timed Up & Go test in pregnant women with pelvic girdle pain compared to asymptomatic pregnant and non-pregnant women. Musculoskelet. Sci. Pract. 2019, 43, 110–116.
11. Åhman, H.B.; Giedraitis, V.; Cedervall, Y.; Lennhed, B.; Berglund, L.; McKee, K.; Kilander, L.; Rosendahl, E.; Ingelsson, M.; Åberg, A.C. Dual-task performance and neurodegeneration: Correlations between timed up-and-go dual-task test outcomes and alzheimer’s disease cerebrospinal fluid biomarkers. JAD 2019, 71, S75–S83.
12. Bustam, I.G.; Suriyaamarit, D.; Boonyong, S. Timed up and go test in typically developing children: Protocol choice influences the outcome. Gait Posture 2019, 73, 258–261.
13. Langeard, A.; Houdeib, R.; Saillant, K.; Kaushal, N.; Lussier, M.; Bherer, L. Switching ability mediates the age-related difference in timed up and go performance. JAD 2019, 71, S23–S28.
14. Jakobsson, M.; Brisby, H.; Gutke, A.; Lundberg, M.; Smeets, R. One-minute stair climbing, 50-foot walk, and timed up-and-go were responsive measures for patients with chronic low back pain undergoing lumbar fusion surgery. BMC Musculoskelet. Disord. 2019, 20, 137.
15. Hatch, J.; Veneri, D. The effect of rolling walker use on interpretation of timed up and go test scores: A preliminary study. Int. J. Rehabil. Res. 2020, 43, 95–98..
16. Marques, G.; Pitarma, R.; M. Garcia, N.; Pombo, N. Internet of things architectures, technologies, applications, challenges, and future directions for enhanced living environments and healthcare systems: A review. Electronics 2019, 8, 1081.
17. Marques, G. Ambient assisted living and internet of things. In Harnessing the Internet of Everything (IoE) for
Accelerated Innovation Opportunities; Cardoso, P.J.S., Monteiro, J., Semião, J., Rodrigues, J.M.F., Eds.; IGI
Global: Hershey, PA, USA, 2019; pp. 100–115, ISBN 9781522573326.
18. Majumder, S.; Deen, M.J. Smartphone sensors for health monitoring and diagnosis. Sensors 2019, 19, 2164. 19. Pires, I.M.; Teixeira, M.C.; Pombo, N.; Garcia, N.M.; Flórez-Revuelta, F.; Spinsante, S.; Goleva, R.;
Zdravevski, E. Android library for recognition of activities of daily living: Implementation considerations, challenges, and solutions. Open Bioinform. J. 2018, 11, 61–88.
20. Kakria, P.; Tripathi, N.K.; Kitipawang, P. A real-time health monitoring system for remote cardiac patients using smartphone and wearable sensors. Int. J. Telemed. Appl. 2015, 2015, 1–11.
21. Higgins, J.P. Smartphone applications for patients’ health and fitness. Am. J. Med. 2016, 129, 11–19. 22. Ben-Zeev, D.; Scherer, E.A.; Wang, R.; Xie, H.; Campbell, A.T. Next-generation psychiatric assessment:
23. Gautschi, O.P.; Stienen, M.N.; Corniola, M.V.; Joswig, H.; Schaller, K.; Hildebrandt, G.; Smoll, N.R. Assessment of the minimum clinically important difference in the timed up and go test after surgery for lumbar degenerative disc disease. Neurosurgery 2017, 80, 380–385.
24. Whitney, J.C.; Lord, S.R.; Close, J.C.T. Streamlining assessment and intervention in a falls clinic using the timed up and go test and physiological profile assessments. Age Ageing 2005, 34, 567–571.
25. Haghi, M.; Thurow, K.; Stoll, R. Wearable devices in medical internet of things: scientific research and commercially available devices. Healthc. Inform. Res. 2017, 23, 4.
26. Andrews, R.G. Mobile Sensor Data Measurements and Analysis for Fall Detection in Elderly Health Care. Available online: https://pdfs.semanticscholar.org/0c71/1db20d7a1449a4dda7e0f4a27b10d8fe9801.pdf (accessed on 20 June 2020).
27. Guo, J.; Zhou, X.; Sun, Y.; Ping, G.; Zhao, G.; Li, Z. Smartphone-based patients’ activity recognition by using a self-learning scheme for medical monitoring. J. Med. Syst. 2016, 40, 140.
28. Dziak, D.; Jachimczyk, B.; Kulesza, W. IoT-based information system for healthcare application: Design methodology approach. Appl. Sci. 2017, 7, 596.
29. Mellone, S.; Tacconi, C.; Schwickert, L.; Klenk, J.; Becker, C.; Chiari, L. Smartphone-based solutions for fall detection and prevention: The FARSEEING approach. Z. Gerontol. Geriatr. 2012, 45, 722–727.
30. Herman, T.; Giladi, N.; Hausdorff, J.M. Properties of the ‘timed up and go’ test: More than meets the eye.
Gerontology 2011, 57, 203–210.
31. Kotagal, V.; Albin, R.L.; Muller, M.L.T.M.; Koeppe, R.A.; Studenski, S.; Frey, K.A.; Bohnen, N.I. Advanced age, cardiovascular risk burden, and timed up and go test performance in parkinson disease. J. Gerontol.
Ser. A Biol. Sci. Med. Sci. 2014, 69, 1569–1575.
32. Montes, J.; Cheng, B.; Diamond, B.; Doorish, C.; Mitsumoto, H.; Gordon, P.H. The timed up and go test: Predicting falls in ALS. Amyotroph. Lateral Scler. 2007, 8, 292–295.
33. Joshua, A.M.; Karnad, S.D.; Nayak, A.; Suresh, B.V.; Mithra, P.; Unnikrishnan, B. Effect of foot placements during sit to stand transition on timed up and go test in stroke subjects: A cross sectional study. NRE 2017,
40, 355–362.
34. Givens, D.L.; Eskildsen, S.; Taylor, K.E.; Faldowski, R.A.; Del Gaizo, D.J. Timed up and go test is predictive of patient-reported outcomes measurement information System physical function in patients awaiting total knee arthroplasty. Arthroplast. Today 2018, 4, 505–509.
35. Son, K.Y.; Shin, D.W.; Lee, J.E.; Kim, S.H.; Yun, J.M.; Cho, B. Association of timed up and go test outcomes with future incidence of cardiovascular disease and mortality in adults aged 66 years: Korean national representative longitudinal study over 5.7 years. BMC Geriatr. 2020, 20, 111.
36. Batista, D.; Silva, H.; Fred, A. Experimental characterization and analysis of the BITalino platforms against a reference device. In Proceedings of the 2017 39th Annual International Conference of the IEEE Engineering in Medicine and Biology Society (EMBC), JeJu, Korea, 11–15 July 2017; IEEE: Piscataway, NJ, USA, 2017; pp. 2418–2421.
37. Ponciano, V.; Pires, I.M.; Ribeiro, F.R.; Garcia, N.M.; Pombo, N.; Spinsante, S.; Crisóstomo, R. Smartphone-based automatic measurement of the results of the timed-up and go test. In Proceedings of the 5th EAI International Conference on Smart Objects and Technologies for Social Good, Valencia, Spain, 25–27 September 2019; pp. 239–242.
38. Ponciano, V.; Pires, I.M.; Ribeiro, F.R.; Garcia, N.M.; Pombo, N. Non-invasive measurement of results of timed-up and go test: Preliminary results. In Proceedings of the Ageing Congress 2019, Coimbra, Portugal, 25–28 May 2019.
39. Williams, B.; Allen, B.; True, H.; Fell, N.; Levine, D.; Sartipi, M. A real-time, mobile timed up and go system. In Proceedings of the 2015 IEEE 12th International Conference on Wearable and Implantable Body Sensor Networks (BSN), Cambridge, MA, USA, 9–12 June 2015; pp. 1–6.
40. Pires, I.M.; Garcia, N.M.; Pombo, N.; Flórez-Revuelta, F. Limitations of the use of mobile devices and smart environments for the monitoring of ageing people. In Proceedings of the 4th International Conference on Information and Communication Technologies for Ageing Well and e-Health, Funchal, Madeira, Portugal, 22–23 March 2018; pp. 269–275.
41. Pires, I.; Felizardo, V.; Pombo, N.; Garcia, N.M. Limitations of energy expenditure calculation based on a mobile phone accelerometer. In Proceedings of the 2017 International Conference on High Performance Computing & Simulation (HPCS), Genoa, Italy, 17–21 July 2017; pp. 124–127.