Who’s who in global value chains? A weighted network
approach
Joao Amador˜ · Sonia Cabral´ ·
Rossana Mastrandrea · Franco Ruzzenenti
Abstract This paper represents global value chains (GVCs) as weighted networks of foreign value added in exports, which allows for the identification of the specific roles of countries and for the quantification of their relative importance over time. A major structural change occurred in the beginning of the century as GVCs steadily turned into global networks, amid an unprecedented growth of value-added flows and the rise of China as a major player. First-order network metrics highlight the vital but also distinct roles of Germany, the US, China and Japan in the international organisation of production. Germany is very relevant both as a user and as a supplier of foreign inputs, while the US acts mostly as a supplier of value added to other countries. Second-order properties of networks shed light on the complex architecture of GVCs, notably in terms of cyclical triangular relationships. Germany’s GVCs mostly root in direct relationships, while Japanese ones typically involve more than two countries. Keywords International trade · Global value chains · Network analysis · Fragmentation · Input-output tables
JEL Classification F14 C67
The authors thank Francesco Picciolo, the editor George S. Tavlas, and two anonymous referees for their helpful comments and suggestions. Any errors and omissions are the sole responsibility of the authors. The opinions expressed in the article are those of the authors and do not necessarily coincide with those of Banco de Portugal or the Eurosystem.
Joao Amador˜
Banco de Portugal
Nova School of Business and Economics, Portugal E-mail: [email protected] Sonia Cabral´
Banco de Portugal E-mail: [email protected] Rossana Mastrandrea
IMT School for Advanced Studies Lucca, Italy E-mail: [email protected] Franco Ruzzenenti
University of Groningen, the Netherlands
Parthenope University of Naples, Italy E-mail: [email protected]
1 Introduction
The international fragmentation of production led to the emergence of global value chains (GVCs) and contributed to deepen the structural interdependence of the world economy (Baldwin, 2013). Although the shape of GVCs is changing due to the increasing role of services and the progress in automation, it is likely that they remain as the paradigm for production in the world. In this context, important questions about the interconnections among countries arise, notably in relation to the impact and propagation of economic shocks (see Carvalho (2014) for a discussion). In particular, the significant role of specific countries in the functioning of GVCs can threaten the stability of the world trade system in case large shocks hit them. These aspects also have a bearing in terms of policy decisions, notably on the way trade agreements are designed and negotiated. Another important element emerging from the rise of GVCs is the need to focus trade analysis on value-added flows instead of gross flows. As foreign inputs are increasingly embodied in domestic production, gross trade flows no longer accurately describe countries’ roles in international trade.
In a growingly interconnected world, network analysis is a useful tool to examine the international flows of value added and countries’ positions in GVCs. Such analysis allows for studying the input-output relationship between any two countries in a structural way and not in isolation, i.e., taking into account the strong interdependence among all participants. Beyond the rich information conveyed by the measures that describe the topology of the networks, a powerful feature of this approach is the ability to visualise complex relationships. This makes it easier for policy-makers to grasp the idea that decisions regarding trade should not be taken on a strictly bilateral basis as strong feedback effects may result from indirect linkages (see Jackson (2014) for a comprehensive discussion on how networks can help to model and understand economic behaviours).
In this paper, we represent GVCs as a weighted directed network of value-added trade, with countries (nodes) linked by their value-added flows (edge weights). More specifically, we use the World Input-Output Database (WIOD) for the period 19952011 and compute the bilateral foreign value added in exports (FVAiX) to quantify the interactions among countries in GVCs. To the best of our knowledge, this is the first application of weighted network analysis to flows of bilateral FVAiX at the country level, which allows for the identification of the specific roles of different countries within GVCs and for the quantification of their relative importance over time. Since the FVAiX network is complete, we start by examining its backbone structure, keeping for each country only its strongest user and supplier connections. We also study higher-order network properties that can shed light on the complex architecture of GVCs, notably in terms of cyclical triangular relationships, and on their structural evolution over time.
We find that, even if the regional dimension of GVCs is still dominant, valueadded trade networks became more global, complex and strongly connected over time. This structural change took place in the beginning of the century, amid an unprecedented growth of value-added trade flows. Large countries, namely Germany, the US, China,
Japan, and Russia, play vital but distinct roles in the international organisation of production. The rise of China as a major player after 2001 is remarkable.
The country emerged first as a user of foreign inputs but gradually became an important supplier of value added to other countries: in 2011, the relevance of China as a user and as a supplier of FVAiX is similar. Germany and the US maintain a robust participation in GVCs over the period, notwithstanding the decline of the US as a supplier after 2000. In addition, these countries play different roles in GVCs: Germany is important as supplier but is also very relevant as a client of value added to be embodied in its exports, while the US acts mostly as a supplier of value added to other countries’ exports.
Our paper relates with several strands of the international trade and networks literatures. The so-called world trade web (WTW), where each country is a node and a bilateral trade flow defines an edge between two countries, has been extensively studied since the 2000s. In the area of econophysics, several aspects of the structural and topological properties of the WTW have been analysed by Serrano and Bogun˜a (2003), Garlaschelli and Loffredo (2005), Kali and Reyes (2007), Fagiolo´ et al. (2010), Reyes et al. (2010) and Fan et al. (2014), among others. Moreover, the empirical trade literature has applied network metrics to examine total world trade (e.g., De Benedictis and Tajoli (2011) and De Benedictis et al. (2014)) and trade in specific sectors (e.g., Akerman and Seim (2014) for arms trade and Amighini and Gorgoni (2014) for trade in auto parts and components).
Research on GVCs from a complex networks perspective is still scarce and can be divided into two main groups, according to the type of data used. Some studies apply network methods to disaggregated gross international trade statistics. Ferrarini (2013) quantifies and maps vertical trade using bilateral data on parts and components and network visualisation tools. More recently, Picciolo et al. (2017) examine cyclic paths of value in global trade and connect them to the evolution of oil prices. Cingolani, Panzarasa and Tajoli (2017) focus on three distinct industries (electronics, motor vehicles, and textiles and apparel) and propose a novel threefaceted measure of centrality aimed at capturing a country’s position at the upstream, midstream, and downstream stages of production. Other recent papers study linkages among countries obtained from global input-output matrices using network tools. Zhu et al. (2015) produce a detailed topological view of industry-level GVCs as global value trees for a large set of country-sector pairs, while Amador and Cabral (2017) examine the binary network of bilateral trade in value added and assess the role of goods and services as both inputs and outputs in GVCs. In addition, De Benedictis and Tajoli (2016) use network analysis to evaluate the position of Italy in total world trade and in two different sectors (leather and footwear, and machinery).
The paper is organised as follows. Section 2 briefly presents the methodology used to compute FVAiX, the definition of the weighted networks and the database used. In section 3, we extract the backbone of the FVAiX networks in 1995 and 2001, identifying five major players in GVCs (Germany, the US, China, Japan and Russia). In section 4, these countries are examined in more detail by computing first- and
second-order network metrics over time. Finally, section 5 presents some concluding remarks.
2 Data and methods
The analysis of this paper is based on the World Input-Output Database (WIOD), which links national supply and use tables with bilateral trade data in goods and services to produce a global input-output (I-O) table. The database covers 27 European countries and 13 other major world economies from 1995 to 2011. 1
Timmer et al. (2015) describe in detail the content of this database and illustrate its potential to improve the understanding of GVCs in several ways. Since its release, the WIOD has been used by various researchers to examine different aspects of the international fragmentation of production, as in Timmer et al. (2014) or FosterMcGregor et al. (2016). All value-added decompositions in this paper were made using the R package decompr (Quast and Kummritz, 2015).
2.1 Foreign value added in exports
This section describes the methodology used to compute the bilateral foreign value added content of gross exports (FVAiX), which is the measure taken to assess the interactions among countries in GVCs. This measure of fragmentation based on I-O tables focuses on the (direct and indirect) import content of exports and was introduced by Hummels et al. (2001) as “vertical specialisation”. This concept relates with the fact that domestic and foreign value added are combined to produce exports, which may be embodied as intermediates in other products or consumed as final goods and services. The calculation of this measure for all countries implies allocating the value added that is internationally traded to each producer along the GVC, thus requiring world I-O tables with information on bilateral flows of intermediate and final goods and services. In fact, the recent availability of global I-O matrices led to several methodological contributions on detailed metrics of valueadded trade (e.g., Johnson and Noguera (2012) and Koopman et al. (2014)).
As succinctly presented in Amador and Cabral (2017), the FVAiX indicator is based on the Leontief inverse matrix to capture the final foreign value-added flows embodied in exports after all stages of production have been concluded. The global Leontief inverse matrix is denoted as L = (I−A)−1, with dimension SN×SN, where S
stands for the number of sectors and N for the number of countries, I is the identity matrix and A is the SN ×SN global I-O matrix. The Leontief inverse matrix is the sum of a converging infinite geometric series with common ratio A, that is,
, when x → ∞. The elements of the Leontief
inverse matrix are often termed as output multipliers, because they take into account both the direct and all indirect rounds of consecutive effects due to the interdependence of sectors and countries in production.
The vector of value added created per unit of gross output in country i is denoted by vi. This 1×SN vector contains the value-added coefficients for country i and zeros
otherwise. The vector ej is of dimension SN ×1 and reports the exports of country j as
positive elements and zeros in the remaining rows.
The FVAiXij provides the value added directly and indirectly created in the country
from which intermediates are imported (source country i) for production of exports
of country j. It is computed by pre-multiplying the Leontief inverse by the vector of value-added coefficients of country i, and post-multiplying by the vector of exports of country j. In other words, the FVAiXij basically takes the off-diagonal blocks of the
global Leontief inverse for country j, pre-multiplies by country i valueadded coefficients and post-multiplies by the vector of country j exports. Formally, this is written as:
FVAiXij = viLej (1)
The total foreign value added embodied in exports of country j is obtained by summing over all partner countries, i.e., FVAiXj = ∑
i6=j FVAiXij.
2.2 The FVAiX network
The construction of a network requires the identification of a set of nodes and a criterion for the interactions between them, which defines the edges and the respective weights. The nodes in the weighted network of value-added trade are the 40 individual countries that are present in the WIOD (N = 40).2
The edges are defined by the size of bilateral value-added trade flows among countries, as shown in equation 1. More precisely, a link of weight fij is defined by the
total value added from source country i that is embodied in exports of country j. Ft
=[fij(t)] is the N×N weighted adjacency matrix at time t, with t = 1995,...,2011, which
fully describes the evolution of the weighted networks of FVAiX over time.
The existence of a clear interpretation for the orientation of the edges, i.e., directed from supplier to user of value added, makes this network directed. In each year, the FVAiX network is fully connected. The formal definition of all network methods used is given in Appendix B and the textbooks by Wasserman and Faust
2 For the remaining non-covered countries, the WIOD estimates an input–output model and obtains a
residual aggregate, the “rest of the world” (ROW) region. We opted to exclude this residual aggregate from the FVAiX networks so that it does not distort the analysis, in particular in terms of the regional versus global organisation of GVCs. Hence, our FVAiX networks can be interpreted as a giant component containing 40 of the 41 nodes available in WIOD.
(1994) and Newman (2010) provide an extensive review of the essential methods of network analysis.3
3 The backbone of the FVAiX network
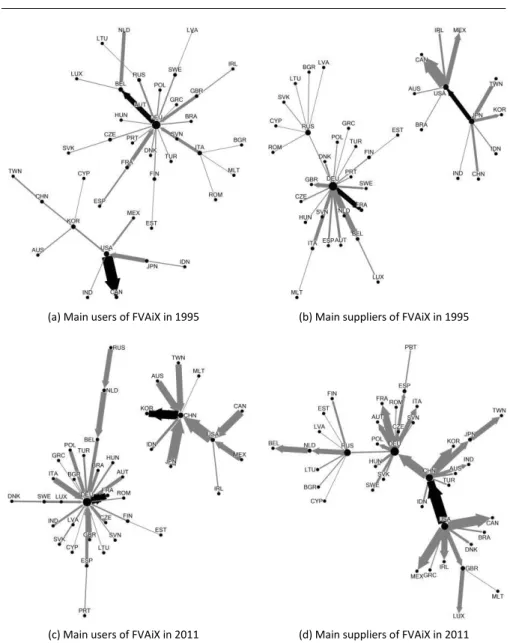
This section examines the skeleton of the FVAiX network by graphically representing the strongest connections among countries (Figure 1). Starting from the complete weighted FVAiX network in each year, two new sub-graphs are built by keeping, for each country, the maximum incoming (its main supplier) and the maximum outgoing (its main user) links.
In 1995, the networks of both users and suppliers are characterised by two main blocks centred around the US and Germany (panels a and b). Hence, the strong I-O linkages are mostly visible at the regional level, with the US exerting its influence on the value added traded in the Asian region. Within each component, important secondary relations are also visible on the supply-side: in Asia, centred in Japan as a supplier and linking countries like China, Korea and Taiwan; in Central and Eastern Europe, with Russia as the main supplier of value added to several other countries in the region.
As GVCs expanded and reshaped the international organisation of production, the architecture of the networks became more complex and intensely connected. The flows of foreign value added became larger from 1995 to 2011, leading to an increase in the width of most edges that connect countries in Figure 1. This increase in the average weight of the networks of value-added trade adds to the large empirical evidence on the rise of international fragmentation of production, which has based on distinct concepts and methodologies (see Baldwin (2013) for an overview). Evidence on the increasing vertical specialisation in trade using the broad concept of FVAiX is also presented by Hummels et al. (2001), Johnson (2014) and Timmer et al. (2014), among others.
As trade in intermediates intensified, new countries emerged as relevant players, thus further changing the FVAiX networks from 1995 to 2011. In 2011, the backbone clearly identifies the three major blocks described in Baldwin and Lopez-Gonzalez (2015): “Factory Europe”, “Factory North-America” and “Factory Asia”, with Germany, the US and China as hub suppliers in their respective regions. The development of these regional value-chains was mostly accomplished outside the World Trade Organisation (WTO), as countries lowered barriers to trade, investment, and services bilaterally, regionally and unilaterally. This international organisation of
3 Additional supporting information can be found in the online version of this paper at the publisher’s
web-site. The data appendix includes the matrices of all bilateral flows of foreign valued in exports in 1995 and 2011. In addition, the Excel file also includes the yearly levels of in-strength (= total foreign value added used in a country’s exports) and out-strength (= total domestic value added used in exports of other countries) of the 40 countries from 1995 to 2011.
production poses substantial challenges to the WTO’s global trade governance (see Baldwin (2016) for a discussion of the future of multilateral economic governance).
Within “Factory Europe”, the role of Russia as supplier of value added is one of the features visible in 1995 and 2011. This secondary relation highlights Russia’s role as a major exporter of energy products, which is also documented in other studies of trade in value added (see, for instance, Koopman et al. (2010)). In addition, Benkovskis et al. (2014) provide a detailed analysis of value-added trade flows between European countries and Russia. As also visible in Figure 1, this paper highlights the strong dependence of the Baltic States relatively to Russian intermediate goods.
Even if the relevance of regional linkages cannot be neglected, the evolution of the backbone of main suppliers from 1995 to 2011 also illustrates the increasingly global nature of GVCs. A single giant-component emerges, with China acting as the main supplier of value added to both Germany and the US, thus bridging the two formerly separated blocks. This result corroborates recent evidence on the gradual transition from regional production systems to a truly global organisation of production, leading to the emergence of the so-called “Factory World” (Los et al., 2015).
The analysis of the geography of GVCs can be enriched using information at the sectoral level, though this is beyond the scope of this paper. Recently, Cingolani, Iapadre and Tajoli (2017) apply tools of network analysis to study the topology of global and regional value chains in two distinct industries (textiles and apparel, and electronics) and conclude that trade regionalisation is still very important, especially in the electronics sector, but has declined over the last years.
Reciprocal linkages in the backbone of the FVAiX networks represent countries that are the main users (suppliers) of each other’s value added, pointing to intense back and forth transactions and to a joint participation in production chains. The edges representing flows that are reciprocated are black-shaded in Figure 1. Another indication of the deep transformations that occurred in world trade is the fact that there are no common reciprocal relations in 1995 and 2011. For instance, on the supply side (panels b and d), China and the US are the main suppliers of value added to each other’s exports in 2011, while in 1995 that feature was shared by the US and Japan. On the using side (panels a and c), a significant reciprocal linkage emerged between Germany and France, which stand as the main value-added receivers of each other in 2011. The close relation between China and Korea in production and trade networks in East Asia is also evident in panel c. This fact is line with the findings of Hyun and Hur (2014) on the increase of the international vertical integration of
Fig. 1: The backbone of the FVAiX networks in 1995 and 2011
(a) Main users of FVAiX in 1995 (b) Main suppliers of FVAiX in 1995
(c) Main users of FVAiX in 2011 (d) Main suppliers of FVAiX in 2011
Notes: The networks are directed and the arrows that represent the edges are oriented from supplier to receiver. The edge width is proportional to its weight. The edges representing flows that are reciprocated are black-shaded and the thicker (stronger) one is overlapping. In each panel, the size of each node is proportional to its share as user/supplier of value added in the respective backbone. The network graphs are based on the Harel-Koren fast multi-scale algorithm (Harel and Koren, 2002) and are drawn with the use of NodeXL (Hansen et al., 2011).
This section focuses on the five countries (Germany, the US, China, Japan, and Russia), whose relevance has been pinpointed in the previous section, and examines how their participation in GVCs has evolved over time.
We start by analysing the roles of these countries as users and suppliers of FVAiX over time using two types of centrality measures: the total value of direct outgoing and incoming connections of a node (out-strength and in-strength) and the Kleinberg (1999) centrality based on the concepts of hub and authority.4 The Kleinberg (1999)
centrality belongs to a class of measures that can be seen as a natural extension of strength centrality: since not all trading partners of a country are equivalent, this measure attributes to each country a score that is proportional to the sum of the scores of its partners. More precisely, a country is a central supplier in the FVAiX network (i.e., it will have a high “hub” score) if it provides significant amounts of value added to countries that are themselves important users. A country is an important user (i.e., it will have a high “authority” score) if it receives substantial amounts of value added from the more important suppliers of the FVAiX network. Overall, the out-strength and the hub centralities of a country reflect its relevance as a supplier in the FVAiX network, while the in-strength and the authority centralities signal its importance as a user of FVAiX.
The rise of China as a major participant in GVCs is clearly visible in all panels of Figure 2.5 After its accession to the WTO in 2001, China’s role as an assembly centre
soared and it quickly caught up with Germany as user of FVAiX. Chinese importance as a supplier did not accelerate around 2001, though it was equally impressive over the whole period. In the last two years, only the US prevails over China as supplier of value added to be incorporated in other countries’ exports. This fact confirms the recent evidence on the upgrading of Chinese exports (Ito and Vezina, 2016) and con´ tradicts the belief that products made in China have little Chinese value added.
There is a meaningful difference between the roles of Germany and the US in GVCs: the US acts mostly as a supplier, while Germany is also an important user of FVAiX. In fact, the strong reliance of the German manufacturing industry on foreign inputs has even led some authors to refer to it as a “bazaar effect” (Sinn, 2006). Moreover, their hub centralities differ more than their out-strengths, indicating that, not only the US supplies more than Germany, but it also supplies to relatively more important users. The dynamics of their centrality measures are also different. GerFig. 2: Centrality measures
4 Centrality measures, which aim at identifying the most important nodes, are the main node-specific
network metrics. Several definitions of centrality exist in the literature in line with the distinct meanings of the importance of a node. As discussed in Jackson (2010), node centrality measures can be broadly categorised into four groups: degree/strength (how connected a node is); closeness (how easily a node can reach other nodes); betweenness (how important a node is for connecting other nodes); and neighbours’ characteristics (how important a node’s neighbours are). In this latter class of measures, the centrality of a node is recursively related to the centralities of all nodes it is connected to, i.e., a node’s influence depends on how important its neighbours are. This latter category includes the Kleinberg (1999) centrality measure used herein and the popular measure of eigenvector centrality, among others. See, for instance, Iapadre and Tajoli (2014) for an application of these metrics to assess the roles of emerging countries in world trade over time.
5 See Bussiere and Schnatz (2009) for an evaluation of the integration of China in international trade`
(a) Out-strength centrality (b) In-strength centrality
(c) Hub centrality (out) (d) Authority centrality (in) Notes: The out-strength and the hub centralities of a country reflect its relevance as a supplier in the FVAiX network, while the in-strength and the authority centralities signal its importance as a user of FVAiX. Formal definitions are provided in Appendix B.
many broadly maintained its central position in the network, in particular as a user, while the importance of the US as a supplier strongly declined since 2000.
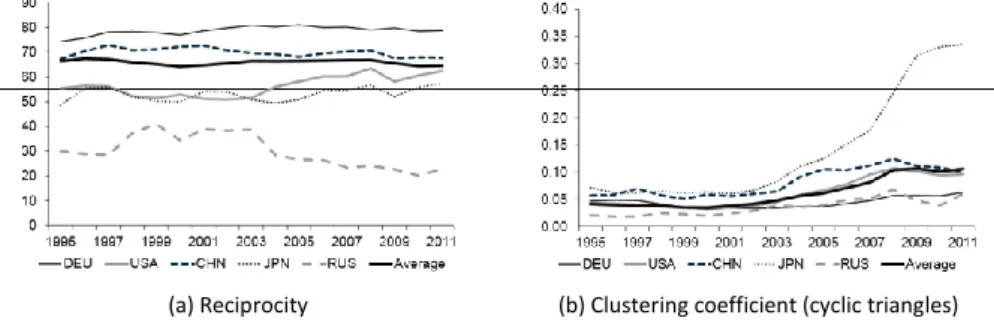
In directed networks, it is also relevant to examine the extent to which ties are reciprocated (Squartini et al., 2013). The network of FVAiX is highly reciprocated as the average of bilaterally balanced flows, i.e., those that are mutually exchanged, stands at around 65 per cent of total flows with no clear trend from 1995 to 2011 (Figure 3, panel a). Germany consistently presents the highest reciprocity among top players, while Russia stays in the last position of the reciprocity rank because it acts largely as a supplier, especially of energy products, and its relevance as a user of FVAiX is negligible.
Another important feature of real-world networks is how tightly clustered they are, reflecting the tendency of two nodes being connected if they share a neighbour. Panel b) of Figure 3 displays the clustering coefficient proposed by Mcassey and Bijma (2015) for complete weighted directed networks in terms of cyclic triangles, i.e., triplets of nodes strongly connected by edges clockwise (or counter-clockwise) oriented. The clustering coefficient of the top players is relatively stable up to the turn of the century, it increases in the early 2000s and flattens after 2008. This pattern reflects the entry of new players in GVCs and the inherent creation of valueadded linkages among all participants. The results for Germany and, mostly, Japan are worth menFig. 3: Reciprocity and clustering coefficient
(a) Reciprocity (b) Clustering coefficient (cyclic triangles) Notes: Reciprocity is the share of flows that are mutually exchanged. Clustering coefficient measures the interconnectivity among nodes. Formal definitions are provided in Appendix B.
tioning. Germany records small increases in the clustering coefficient, signalling that its GVCs root in direct relationships. Conversely, the increase in Japan’s coefficient is particularly striking. It mirrors the role of Japanese affiliates in East Asian production networks (Kimura, 2006 and Urata, 2014), which typically involve more than two countries, thus increasing the prevalence of cyclical triangles.
Until 2001, there is a strong positive correlation between the in-strength of a node and its clustering coefficient, meaning that the most important users of FVAiX were most likely to be involved in clusters (Figure 4). Afterwards, this nexus fades, which indicates that the average increase in the clustering coefficient is only marginally explained by direct relations in the network. Overall, this fact suggests that secondorder properties are important to understand key organisational features of GVCs, such as the combination of intra-firm and arm’s-length transactions, which lead
to links between
several countries.
0.7 0.6
Fig. 4: Correlation between clustering and strength
Notes: Linear correlations measured by the Pearson correlation coefficient. The out-strength of a country reflect its relevance as a supplier in the FVAiX network, while the in-strength signals its importance as a user of FVAiX. Clustering coefficient measures the interconnectivity among nodes. Formal definitions are provided in Appendix B. 5 Conclusion 0.0 0.1 0.2 0.3 0.4 0.5 0.8 1995 1997 1999 2001 2003 2005 2007 2009 2011 Total strength In-strength Out-strength
The expansion of global value chains (GVCs) and the increasing interdependence of the world economy requires new tools for examining linkages among countries. Firstly, the growing import content of exports means that trade flows can no longer be properly measured with standard bilateral gross flows. Secondly, network analysis constitutes a useful methodology to understand the nature and dynamics of GVCs because it assumes the interdependence of observations and explores the entire pattern of connections, instead of focusing on the isolated characteristics of each element. Moreover, network graphs allow for the visualisation of the geographical/sectoral structure of GVCs in a informative and intuitive way. Such stylised representations of the networks make it easier to identify countries’ positions in GVCs and contribute to a better assessment of how they affect each national economy.
This paper is based on the World Input-Output Database (WIOD) and uses network metrics to illustrate the significant changes that occurred in international trade and production from 1995 to 2011. More specifically, we focus on the concept of foreign value added in exports (FVAiX) and, in each year, the GVC is represented as a weighted directed network of countries (nodes) and value-added flows between them (edges). These weighted networks enable us to quantitatively represent the architecture and the flows of value added in GVCs, taking into account both the extensive and intensive margins of value-added trade, while identifying the main players in GVCs over time.
The evolution of the value-added networks is consistent with the growing fragmentation of production and the deepening of GVCs. We find that the fundamental structure of GVCs is organised around major regional blocks, with Germany, the US and China acting as hub suppliers in their respective regions. Nonetheless, over time, GVCs became more global and the networks turned more complex and strongly connected. The change in the architecture of the networks of FVAiX highlights the rising importance of China since 2000, which developed into the largest supplier of value added after the US.
Furthermore, we identify the distinct roles played by Germany and the US in GVCs: Germany is very relevant both as a user and as a supplier of foreign inputs, while the US acts mostly as a supplier of value added to other countries. Our results also emphasise that second-order properties of the networks can shed light on complex organisational features of GVCs and inherent multi-country linkages. We find that Germany’s GVCs are mostly based on direct relationships, while Japanese ones typically include more than two countries. Additionally, the decrease of the correlation between a node’s strength and its clustering coefficient signals the existence of more complex patterns in GVCs over time.
The structure, in the words of Gregory Bateson (Bateson, 2008), is the “pattern which connects”, and indeed most of the salient features we have herein analysed would go undetected if the global architecture of connections was neglected. For instance, total gross trade of the US, which more than doubled over this period, would have failed to reveal the declining importance of the country as a supplier of valueadded as it is unravelled by the measures of network centrality. Furthermore, adequate measures of network centrality make it possible to identify the way a
country’s trade relationships shapes neighbours’ trade patterns, for example by enabling them to reach third-partners. However, network centrality is invisible if searched only on bilateral trade relationships, as it is clustering. Clusters involve (at least) three parties and, as production unfolds across more than two countries in GVCs, they become of paramount importance for understanding the unbundling of production and its impact on trade and the wealth of nations.
Our findings also point to some avenues for future research. For instance, the aggregate analysis does not take into account the impact of differences in sectoral specialisation. As discussed in Carvalho (2014) and estimated in Acemoglu et al. (2016), the network of sectoral input-output linkages in production plays an important role on the propagation of shocks and in the origins of aggregate fluctuations. Given the availability of global input-output matrices, an extension of this literature could deliver important insights on the international transmission of shocks. For example, Connell et al. (2017) take into account the international sectorlevel production linkages and the network centrality of sectors to investigate the potential effect of Brexit, showing that its impact varies across countries due to differences in sectoral composition. Another recent path of research is that of Korniyenko et al. (2017), which use network analysis tools to develop a methodology for quantifying the supply fragility of individual traded goods and create a measure of the vulnerability of a country’s trade basket.
A complex network perspective can also be useful to examine the negotiation of trade agreements, which depend on the entire network of trade relations. A promising application is the use of network formation models to ascertain if the proliferation of bilateral agreements can lead to global trade liberalisation, as in Daisaka and Furusawa (2014) and Lake (2017). In addition, Arpino et al. (2017) and Sopranzetti (2017) show that the position of a country in the network of world trade relations has a significant impact on the pro-trade effect of trade agreements. In a different vein, Xing et al. (2018) apply complex network methods to simulate different scenarios on the Trans-Pacific Partnership and find that an agreement including both the US and China would be mutually beneficial.
Overall, our results demonstrate the empirical relevance of network analysis to improve the understanding of GVCs and can be seen as a contribution to further research on the application of network methods for studying international trade.
14
Appendices
A Geographical breakdown in the World Input-Output Database (WIOD) (40countries)
ISO alpha-3 codes Country names
AUS Australia AUT Austria BEL Belgium BGR Bulgaria BRA Brazil CAN Canada CHN China CYP Cyprus CZE Czech Republic DEU Germany DNK Denmark ESP Spain EST Estonia FIN Finland FRA France GBR United Kingdom GRC Greece HUN Hungary IND India IDN Indonesia IRL Ireland ITA Italy JPN Japan KOR South Korea LTU Lithuania LUX Luxembourg LVA Latvia MEX Mexico MLT Malta NLD The Netherlands
15 POL Poland PRT Portugal ROM Romania RUS Russia SVK Slovak Republic SVN Slovenia SWE Sweden TUR Turkey TWN Taiwan
USA United States B Network metrics
Let G = (N,L) be a network with a set of N nodes and L links. It is fully characterised by its binary and weighted adjacency matrices: A ≡ (aij)1≤i,j≤N and W ≡ (wij)1≤i,j≤N. In its simplest binary form, aij = 1 if there
is a link from node i to node j and aij = 0 if not. Analogously, the weighted adjacency matrix is defined
such that the entry wij is equal to the weight of the link between i and j. In a directed network, the links
are oriented from node i to node j, so that aij 6= aji and wij 6= wji. By convention, the origin of the directed
edge (node i) are the rows, and the recipients of the edges (node j) are the columns of the adjacency matrices.
B.1 The backbone
The network of foreign value added in exports is fully connected, directed and weighted. A link of weight
fij is defined by the value added from source country i that is embodied in exports of country j, thus it is
oriented from the supplier to the receiver of the value added. F = [fij(t)] is the N×N weighted adjacency
matrix at time t, with t = 1995,...,2011 and N = 40, which fully describes the evolution of the weighted directed network of foreign value added in exports over time.
Given a graph, a subset of its edges obtained by removing some of the original links represents a subgraph. A backbone reduction aims at preserving only the most relevant part of a network. The resulting sub-graph can also be conveniently used for visualisation purposes. The procedure has been applied in several research fields with distinct algorithms and the results can differ substantially from network to network. Recently, Mastrandrea et al. (2017) use a maximum spanning tree approach similar to the one of this paper to analyse the human functional brain network.
The backbone structure is extracted from the complete FVAiX network by selecting for each country only its strongest supplier and user connections. Starting from the complete weighted network in a given year, two new sub-graphs are built: one uses only the maximum incoming link of each node (maximum value of each column of F), i.e., for each country the graph includes only its main supplier of foreign value added in exports; another uses only the maximum outgoing link of each country (maximum of each row of F), i.e., the graph includes only the main receiver of the value added of each country. Each new subgraph has the same number of nodes and links (N = 40).
Figure 1 in the main text displays the network representations of the backbone of users and suppliers in 1995 and 2011. Each country is represented by a circle and the arrows that represent the edges are oriented from supplier to receiver of value added. The size of each node is proportional to its share as a user/supplier of value added in the respective backbone. The edge width is proportional to its weight (value-added flows). The edges representing flows that are reciprocated, i.e., countries that are the main users (suppliers) of the value added of each other are black-shaded. The network graphs are based on the Harel-Koren fast multi-scale algorithm (Harel and Koren, 2002) and are drawn with the use of NodeXL (Hansen et al., 2011).
16
B.2 Centrality measures
We define a node’s out-strength (in-strength) as the sum of all its outgoing (incoming) link weights (Barrat et al., 2004). Then, it is normalised by the total weight of the network:
N ∑ wij
souti= Nj=1N (1) ∑ ∑ wij j=1i6=jN ∑ wji sini = Nj=1N (2) ∑ ∑ wijj=1i6=j
In directed networks, the hub and authority centralities are measures based on the centrality of nodes’ neighbours and they are computed iteratively. Kleinberg (1999) was the first to introduce these concepts developing an algorithm called hyperlink-induced topic search (HITS). To each node i, it assigns a hub centrality yi, defined to be proportional to the sum of the authority centralities of the vertices that
it points to; and an authority centrality xi, proportional to the sum of the hub centralities of the vertices
that point to it:
N
yi = β
∑
wijxj (3) j=1 Nxi = α
∑
wjiyj (4) j=1where β and α are constants. In the network of foreign value added in exports, a hub is a country that supplies a high amount of value added to countries that are themselves important users and an authority is a country that largely uses value added from countries that are themselves important suppliers.
Hence, the out-strength and the hub centralities of a country reflect its relevance as a supplier of foreign value added to other countries’ exports, while the in-strength and the authority centralities signal its importance as a user of foreign value added in its own exports.
B.3 Reciprocity
In a binary network, if there is a directed edge from node i to node j and a link in the opposite direction, we say that the link from i to j (and obviously from j to i) is reciprocated (Garlaschelli and Loffredo, 2004). Network reciprocity is a global measure of directed networks counting the fraction of reciprocated edges (Newman et al., 2002). That is:
L↔
rb ≡ (5)
17 where L=∑j ∑i6=j aij is the total number of links, L↔ =∑j ∑i6=j aijaji is the total number of links pointing in both
directions, and aij = 1 if there is a link from i to j and aij = 0 if not.
The definition of reciprocity for weighted networks involves the amount of reciprocated flows between any pair of nodes. If there exists a reciprocated link between nodes i and j, Squartini et al. (2013) define the reciprocated strength s↔
i of node i as:
s↔
i (6)
i6=j i6=j i6=j
where w↔ij is the reciprocated weight between i and j (the symmetric part).
For the network-wide level, Squartini et al. (2013) proposed the following global measure:↔
∑j ∑i6=j w↔ij
W
r ≡ = (7)
W ∑j ∑i6=j wij
where W is the total weight of the network and and W↔ represents the total reciprocated weight.
Figure 3 panel a) in the main text depicts the values of the reciprocated strength for the main players, as well as the global measure for the network as whole from 1995 to 2011.
B.4 Clustering
In a binary network, the clustering coefficient of a node i is the ratio between the number of pairs of its neighbours that are connected and the total number of pairs of neighbours of i. In other words, it counts the number of closed triangles with respect to the total number of connected triples passing through node i (Watts and Strogatz, 1998).
The extension of the clustering coefficient to the weighted case is not trivial. In fact, there are alternative definitions for the weighted clustering coefficient in undirected networks (Barrat et al., 2004, Saramaki¨ et al., 2007, Kalna and Higham, 2007) and for the directed case (Fagiolo, 2007). Here, we consider the definition introduced recently by Mcassey and Bijma (2015) for complete networks.
In a weighted directed network, triangles with edges pointing in distinct directions account for different network motifs. As illustrated in Fagiolo (2007), there are four different patterns of directed triangles from the perspective of a node i: cycle, when there is a cyclic relation between i and two of its neighbours; middleman, when one of the neighbours uses i to reach the third neighbour in two steps; in, when node i has two inward edges; and out, when node i has two outward edges. Thus, for each node in a complete directed network there are eight possible triangles according to all combinations of link directions and a node can be involved in triadic structures in one direction more than in another. One can define the clustering coefficient in terms of all eight triangles and in terms of the two cyclic triangles.
Mcassey and Bijma (2015) normalise the complete weighted adjacency matrix W so that the weights
wij ∈ [0,1]. The closer wij is to one, the more nodes i and j are considered strong neighbours, while the
nearer wij is to zero the more these nodes are regarded as weak neighbours. Intuitively, the clustering
coefficient for node i is large if the set of strong neighbours of i are themselves strong neighbours of each other; the clustering coefficient for node i is small if it has mostly weak neighbours. A threshold t is introduced such that:
Wt = {wij|wij ≥ t} and At = [1|wij ≥ t] (8)
where Wt is the weighted adjacency matrix of the thresholded network and At is the corresponding binary
adjacency matrix with entries atij.
Let γi(t) denote the number of closed triangles passing through node i and let Γi(t) denote the
18 γi(t) =
∑∑
2 (9) 2 2 j6=ik6=i,j (atik +atki) Γi(t) =∑
j6=ik∑
6=i,j2 2 (10)The weighted clustering coefficient of node i in the weighted thresholded network represented by
Wt is given by:
calli (t) = γi (11)
Γi
Then, the weighted clustering coefficient for each node considering all triangles in the complete weighted network represented by W is given by:
Z 1
calli = calli (t)dt (12)
0
If we focus on cyclic triangles, we have: cyc
∑j6=i ∑k6=i,j atijatjkatki
ci (t) = ∑ ∑ at atki (13) j6=i k6=i,j ij
and the weighted clustering coefficient for node i in the complete network is given by:
cyc Z 1 cyc
ci = ci (t)dt (14)
0
For each typology, the global clustering coefficient of a network is simply the average of the clustering coefficient of all nodes.
Figure 3 panel b) in the main text depicts the values of the clustering coefficient computed for cyclic triangles for the main players, as well as the average for the network as whole from 1995 to 2011. The clustering indicator computed for all triangles presents a very similar pattern. The main difference between the two measures of clustering regards Russia, where the values are higher if all triangles are considered. This difference results from the fact that Russia is a large supplier of energy products in Europe but its importance as a user of foreign value added in exports is negligible. Hence, the edges pointing to Russia are mostly weak ties, leading to a coefficient based on cyclic paths that is smaller than the one considering all patterns of directed triangles.
References
Acemoglu, D., Akcigit, U. and Kerr, W. (2016), Networks and the Macroeconomy: An Empirical Exploration, in M. Eichenbaum and J. Parker, eds, ‘NBER Macroeconomics Annual 2015, Volume 30’, University of Chicago Press, chapter 4, pp. 273–335.
Akerman, A. and Seim, A. L. (2014), ‘The global arms trade network 1950–2007’, Journal of Comparative
Economics 42(3), 535–551.
Amador, J. and Cabral, S. (2017), ‘Networks of value-added trade’, The World Economy 40(7), 1291–1313.
19 Amighini, A. and Gorgoni, S. (2014), ‘The international reorganisation of auto production’, The World
Economy 37(7), 923–952.
Arpino, B., De Benedictis, L. and Mattei, A. (2017), ‘Implementing propensity score matching with network data: the effect of the General Agreement on Tariffs and Trade on bilateral trade’, Journal of
the Royal Statistical Society: Series C (Applied Statistics) 66(3), 537–554.
Baldwin, R. (2013), Global supply chains: why they emerged, why they matter, and where they are going,
in D. K. Elms and P. Low, eds, ‘Global value chains in a changing world’, World Trade Organization/Fung
Global Institute, chapter 1, pp. 13–59.
Baldwin, R. (2016), ‘The World Trade Organization and the Future of Multilateralism’, Journal of Economic
Perspectives 30(1), 95–116.
Baldwin, R. and Lopez-Gonzalez, J. (2015), ‘Supply-chain trade: A portrait of global patterns and several testable hypotheses’, The World Economy 38(11), 1682–1721.
Barrat, A., Barthelemy, M., Pastor-Satorras, R. and Vespignani, A. (2004), ‘The architecture of complex weighted networks’, Proceedings of the National Academy of Sciences of the United States of America 101(11), 3747–3752.
Bateson, M. C. (2008), Angels Fear Revisited: Gregory Bateson’s Cybernetic Theory of Mind Applied to Religion-Science Debates, in J. Hoffmeyer, ed., ‘A Legacy for Living Systems: Gregory Bateson as Precursor to Biosemiotics’, Springer Netherlands, Dordrecht, chapter 1, pp. 15–25.
Benkovskis, K., Pastusenko, J. and Wˇ orz, J. (2014), ‘Assessing the full extent of trade integration between¨ the EU and Russia – A global value chain perspective’, Focus on European Economic
Integration (3), 31–47.
Bussiere, M. and Schnatz, B. (2009), ‘Evaluating China’s Integration in World Trade with a Gravity Model` Based Benchmark’, Open Economies Review 20(1), 85–111.
Carvalho, V. M. (2014), ‘From micro to macro via production networks’, Journal of Economic Perspectives 28(4), 23–48.
Cingolani, I., Iapadre, L. and Tajoli, L. (2017), ‘International production networks and the world trade structure’, International Economics (Forthcoming), 1–25.
Cingolani, I., Panzarasa, P. and Tajoli, L. (2017), ‘Countries’ positions in the international global value networks: Centrality and economic performance’, Applied Network Science 2(1), 21.
Connell, W., Simons, W. and Vandenbussche, H. (2017), Global Value Chains, Trade Shocks and Jobs: An Application to Brexit, CEPR Discussion Papers 12303, Centre for Economic Policy Research (CEPR). Daisaka, H. and Furusawa, T. (2014), ‘Dynamic free trade networks: Some numerical results’, Review of
International Economics 22(3), 469–487.
De Benedictis, L., Nenci, S., Santoni, G., Tajoli, L. and Vicarelli, C. (2014), ‘Network analysis of world trade using the BACI-CEPII dataset’, Global Economy Journal 14(3-4), 287–343.
De Benedictis, L. and Tajoli, L. (2011), ‘The world trade network’, The World Economy 34(8), 1417–1454. De Benedictis, L. and Tajoli, L. (2016), ‘Comparative Advantage and Centrality in the World Network of
Trade and Value Added: An Analysis of the Italian Position’, Rivista di Politica Economica VII-IX, 1– 36. Fagiolo, G. (2007), ‘Clustering in complex directed networks’, Physical Review E 76, 026107.
Fagiolo, G., Reyes, J. and Schiavo, S. (2010), ‘The evolution of the world trade web: a weighted-network analysis’, Journal of Evolutionary Economics 20(4), 479–514.
Fan, Y., Ren, S., Cai, H. and Cui, X. (2014), ‘The state’s role and position in international trade: A complex network perspective’, Economic Modelling 39, 71–81.
Ferrarini, B. (2013), ‘Vertical trade maps’, Asian Economic Journal 27(2), 105–123.
Foster-McGregor, N., Poeschl, J. and Stehrer, R. (2016), ‘Offshoring and the elasticity of labour demand’,
Open Economies Review 27(3), 515–540.
Garlaschelli, D. and Loffredo, M. I. (2004), ‘Patterns of link reciprocity in directed networks’, Physycal
Review Letters 93, 268701.
Garlaschelli, D. and Loffredo, M. I. (2005), ‘Structure and evolution of the world trade network’, Physica
A: Statistical Mechanics and its Applications 355(1), 138–144.
Hansen, D. L., Shneiderman, B. and Smith, M. A. (2011), Analyzing Social Media Networks with NodeXL:
Insights from a Connected World, Morgan Kaufmann, Burlington, MA, USA.
Harel, D. and Koren, Y. (2002), ‘A fast multi-scale method for drawing large graphs’, Journal of Graph
20
Hummels, D., Ishii, J. and Yi, K.-M. (2001), ‘The nature and growth of vertical specialization in world trade’,
Journal of International Economics 54(1), 75–96.
Hyun, H.-J. and Hur, J. (2014), ‘Trade openness and vertical structure: Evidence from Korean firm-level data’, Open Economies Review 25(4), 701–720.
Iapadre, P. L. and Tajoli, L. (2014), ‘Emerging countries and trade regionalization. a network analysis’,
Journal of Policy Modeling 36, S89–S110.
Ito, T. and Vezina, P.-L. (2016), ‘Production fragmentation, upstreamness, and value added: Evidence from´ Factory Asia 1990–2005’, Journal of the Japanese and International Economies 42, 1–9. Jackson, M. O. (2010), Social and Economic Networks, Princeton University Press, Princeton, NJ, USA. Jackson, M. O. (2014), ‘Networks in the understanding of economic behaviors’, Journal of Economic
Perspectives 28(4), 3–22.
Johnson, R. C. (2014), ‘Five facts about value-added exports and implications for macroeconomics and trade research’, Journal of Economic Perspectives 28(2), 119–142.
Johnson, R. C. and Noguera, G. (2012), ‘Accounting for intermediates: Production sharing and trade in value added’, Journal of International Economics 86(2), 224–236.
Kali, R. and Reyes, J. (2007), ‘The architecture of globalization: a network approach to international economic integration’, Journal of International Business Studies 38(4), 595–620.
Kalna, G. and Higham, D. J. (2007), ‘A clustering coefficient for weighted networks, with application to gene expression data’, AI Communications 20(4), 263–271.
Kimura, F. (2006), ‘International production and distribution networks in East Asia: Eighteen facts, mechanics, and policy implications’, Asian Economic Policy Review 1(2), 326–344.
Kleinberg, J. M. (1999), ‘Authoritative sources in a hyperlinked environment’, Journal of the ACM 46(5), 604–632.
Koopman, R., Powers, W., Wang, Z. and Wei, S.-J. (2010), Give credit where credit is due: Tracing value added in global production chains, NBER Working Paper 16426, National Bureau of Economic Research.
Koopman, R., Wang, Z. and Wei, S.-J. (2014), ‘Tracing value-added and double counting in gross exports’,
American Economic Review 104(2), 459–494.
Korniyenko, Y., Pinat, M. and Dew, B. (2017), Assessing the Fragility of Global Trade; The Impact of Localized Supply Shocks Using Network Analysis, IMF Working Papers 17/30, International Monetary Fund (IMF).
Lake, J. (2017), ‘Free trade agreements as dynamic farsighted networks’, Economic Inquiry 55(1), 31–50. Los, B., Timmer, M. P. and de Vries, G. J. (2015), ‘How global are global value chains? A new approach to
measure international fragmentation’, Journal of Regional Science 55(1), 66–92.
Mastrandrea, R., Gabrielli, A., Piras, F., Spalletta, G., Caldarelli, G. and Gili, T. (2017), ‘Organization and hierarchy of the human functional brain network lead to a chain-like core’, Scientific Reports 7(4888). Mcassey, M. P. and Bijma, F. (2015), ‘A clustering coefficient for complete weighted networks’, Network
Science 3(2), 183–195.
Newman, M. E. J. (2010), Networks: An introduction, Oxford University Press, New York, USA. Newman, M. E. J., Forrest, S. and Balthrop, J. (2002), ‘Email networks and the spread of computer viruses’,
Physycal Review E 66, 035101.
Picciolo, F., Papandreou, A., Hubacek, K. and Ruzzenenti, F. (2017), ‘How crude oil prices shape the global division of labor’, Applied Energy 189, 753–761.
Quast, B. and Kummritz, V. (2015), ‘decompr: Global value chain decomposition in R’, CTEI Working
Papers (1).
Reyes, J., Schiavo, S. and Fagiolo, G. (2010), ‘Using complex networks analysis to assess the evolution of international economic integration: The cases of East Asia and Latin America’, The Journal of
International Trade & Economic Development 19(2), 215–239.
Saramaki, J., Kivel¨ a, M., Onnela, J.-P., Kaski, K. and Kertesz, J. (2007), ‘Generalizations of the clustering¨ coefficient to weighted complex networks’, Physical Review E 75(2), 027105.
Serrano, M. A. and Bogun˜a, M. (2003), ‘Topology of the world trade web’,´ Physical Review E 68, 015101. Sinn, H.-W. (2006), ‘The Pathological Export Boom and the Bazaar Effect: How to Solve the German
Puzzle’, The World Economy 29(9), 1157–1175.
Sopranzetti, S. (2017), ‘Overlapping free trade agreements and international trade: A network approach’,
21 Squartini, T., Picciolo, F., Ruzzenenti, F. and Garlaschelli, D. (2013), ‘Reciprocity of weighted networks’,
Scientific Reports 3(2729), 1–9.
Timmer, M. P., Dietzenbacher, E., Los, B., Stehrer, R. and de Vries, G. J. (2015), ‘An Illustrated User Guide to the World Input–Output Database: The Case of Global Automotive Production’, Review of
International Economics 23(3), 575–605.
Timmer, M. P., Erumban, A. A., Los, B., Stehrer, R. and de Vries, G. J. (2014), ‘Slicing up global value chains’,
Journal of Economic Perspectives 28(2), 99–118.
Urata, S. (2014), ‘Japan’s trade policy with Asia’, Public Policy Review 10(1), 1–31.
Wasserman, S. and Faust, K. (1994), Social network analysis: Methods and applications, Cambridge University Press.
Watts, D. J. and Strogatz, S. H. (1998), ‘Collective dynamics of ‘small-world’ networks’, Nature 393(6684), 440–442.
Xing, L., Guan, J., Dong, X. and Wu, S. (2018), ‘Understanding the competitive advantage of TPP-related nations from an econophysics perspective: Influence caused by China and the United States’, Physica
A: Statistical Mechanics and its Applications (Forthcoming), 1–31.
Zhu, Z., Puliga, M., Cerina, F., Chessa, A. and Riccaboni, M. (2015), ‘Global value trees’, PLoS ONE 10(5), 1–17.