Contribution of carbonyl compounds to IAQ in schools: a field study
109
0
0
Texto
(2) University of Aveiro 2011. ENOW FRIEDA BATEEPEY. Department of Environment and Planning. CONTRIBUTION OF CARBONYL COMPOUNDS TO IAQ IN SCHOOLS-A FIELD STUDY.. Master thesis presented to the University of Aveiro (UA) to fullfil the requirements for the Master degree in Environmental Studies (Joint European Master Programm in Environmental Science – JEMES). It was done under the scientific supervision of Doctor Teresa Filomena Vieira Nunes, Professor of the Department of Environment and Planning of the UA and co-supervision of Doctor Wolfgang Calmano, Professor of the Institute of Environmental Technology and Energy Economy of the Technische Universitat HamburgHarburg (TUHH).. Financial support of the European Commission Mundus. through. Program,. for. scholarship.. ii. the the. Erasmus Master.
(3) dedication. I dedicate this work to God almighty for the strength and knowledge to carry out this research, to my parents, Chief and Mrs Bate-Epey for their love, care and commitment shown towards my education and my family, I love you.. iii.
(4) o júri Presidente. Profa. Doutora Ana Isabel Couto Neto Da Silver Miranda Professora da Universidade de Aveiro. Profa. Doutora Gabriela Ventura Alves Da Silva Professora da Faculdade de Engenharia da Universidade do Porto. Profa. Doutora Teresa Filomena Vieira Nunes Professora da Universidade de Aveiro. iv.
(5) Acknowledgments. I would like to thank Professors Teresa Nunes and Ana Miranda for inspiring me to do this work and especially Prof. Teresa for her academic guidance to enable me complete this research. Profound gratitude goes to my professors of the Department of Environment and Planning for the knowledge and skills I acquired throughout my studies. Sincere thanks to Professor Mario Cerqueira for his academic guidance and knowledge on HPLC systems and analysis. I also wish to thank Priscilla Nascimento for her support and knowledge on research work which enabled me to complete this work. Special thanks to Alvin Etang for the support and advice throughout my studies, my friends Binh Vu, Diogo Lemos and Iryna Lanko for their support. Lastly I thank my family for the financial and moral support and everyone who contributed in making this work a success.. v.
(6) keywords. Carbonyl compounds, Indoor air pollution, Indoor air quality, Primary schools. Abstract. With increasing awareness of indoor air pollution and the relation between outdoor and indoor ratios of contaminants, studies have been carried out to determine the concentrations of these pollutants in indoor air especially in schools, restaurants, residential areas and hospitals. Formaldehyde and acetaldehyde are important carbonyl compounds in chemical reactions in the troposphere. However due to their adverse effects on human health and their presence in indoor air, there is a need to monitor and determine their sources in indoor air quality and possible mitigation actions to implement in order to reduce their levels in occupational and living environments. A study was undertaken in a Portuguese school (Escola de Gloria) in Aveiro where indoor and outdoor air carbonyls were measured in order to gain information about child exposure in school environments. Carbonyl compounds were measured using passive samplers over a nine-week period. Active sampling of carbonyls was carried out for three days to determine the time weighted average (TWA) and diurnal variation. Results. show. the. presence. of. formaldehyde,. acetaldehyde,. propionaldehyde, butyraldehyde and benzaldehyde to be the most common carbonyls found during sampling. High levels of indoor carbon dioxide were found during occupation periods (2671ppm). The concentration of carbonyls obtained during occupation period in the first weeks is higher indoor than outdoor with highest concentrations of acrolein/acetone (2179 µg/m3) found, followed by butyraldehyde (38.51µg/m3),. formaldehyde. (26.70µg/m3). and. acetaldehyde. (22.85µg/m3). High I/O ratios were also reported and this suggest carbonyls being generated from indoors sources. vi. could.
(7) TABLE OF CO TE TS Dedication Acknowledgement Abstract TABLE OF CO TE TS………………………………………………………………...vii LIST OF FIGURES……………………………………………………………………….x LIST OF TABLES …………………………………………………………………….....xi LIST OF ABBREVIATIO S …..………………………………………………………xii. CHAPTER 1. I TRODUCTIO …………………………………….………….…1 1.1 Background…………………………………………………………….………………..1 1.2. Objectives ....................................................................................................................... 3. CHAPTER 2. LITERATURE REVIEW……........................................................5 2.1 Introduction to Indoor Air Pollution and some definitions……………………………..5 2.2 Carbonyl Compounds ...................................................................................................... 9 2.2.1 Occurrence.................................................................................................................... 9 2.2.2 Natural sources ........................................................................................................... 10 2.2.3 Anthropogenic sources ............................................................................................... 13 2.2.4 Secondary Pollutants .................................................................................................. 13 2.2.5 Formaldehyde ............................................................................................................. 14 2.2.6 Acetaldehyde .............................................................................................................. 16 2.2.8 Comparison of methods used to measure Carbonyls.................................................. 16. CHAPTER 3. METHODOLOGY ……………………………….………..……..22 3.1 School location and description ……..………………………………………….…….22 3.2 Sampling and Analysis ………………………………………………………………..23 3.2.1 Comfort Parameters.................................................................................................... 23. vii.
(8) 3.2.2 Passive Sampling........................................................................................................ 24 3.2. Quality Control ……………………………………………………………………….29. CHAPTER 4. RESULTS A D DISCUSSIO ……………………...…….…..31 4.1 Comfort Parameters....................................................................................................... 30 4.1.1. Temperature and Relative Humidity ......................................................................... 30 4.1.2. Carbon dioxide and Carbon monoxide...................................................................... 33 4.1.3. Total Volatile Organic Compounds (TVOC) ............................................................ 39 4.2. Carbonyl Compounds ................................................................................................... 41 4.2.2 Acetaldehyde............................................................................................................... 44 4.2.3 Acrolein/Acetone ........................................................................................................ 46 4.2.4 Butyraldehyde............................................................................................................. 48 4.2.5 Propionaldehyde and Benzaldehyde .......................................................................... 49 4.3 Active Sampling ............................................................................................................. 53 4.4 Outdoor contribution to Indoor source of Carbonyl compounds.................................. 57. CHAPTER 5. CO CLUSIO A D RECOMME DATIO S…....……...58 REFERE CES ………..……………………….......…………………………………61 APPE DIX………………..………………………………………………………...…71 APPENDIX A – Calibration Curves for Standards............................................................. 72 A.1 Week 1, 2 Indoors and Outdoors .................................................................................. 72 A.2 Week 3,4 Indoors (Passive and Active Sampling) ...................................................... 76 A.3 Week three and Four Outdoor Curves .......................................................................... 78 A.4 Week 5 Indoors and Outdoors .................................................................................... 81 A .5 Week 6 Indoors and Outdoors ...……………………………………...…...…………82 A.6. Week 7, Indoor and Outdoor ....................................................................................... 86 A.7 Week 8 and 9 (Passive Indoor/ Outdoor) ................................................................... 88. viii.
(9) A. 8 Week 9 Active Sampling (Indoor/ Outdoor) ……………………………….………..93. ix.
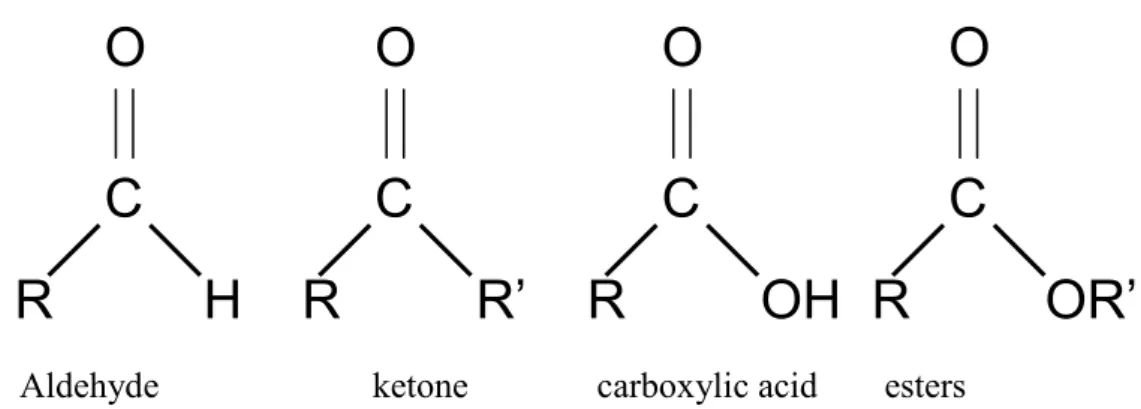
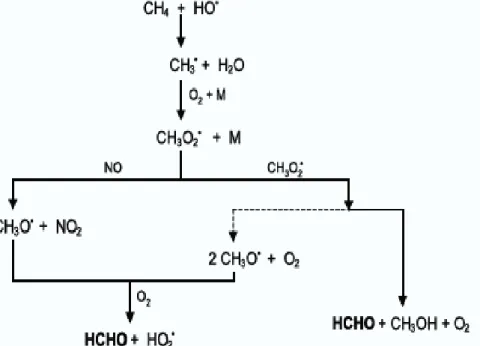
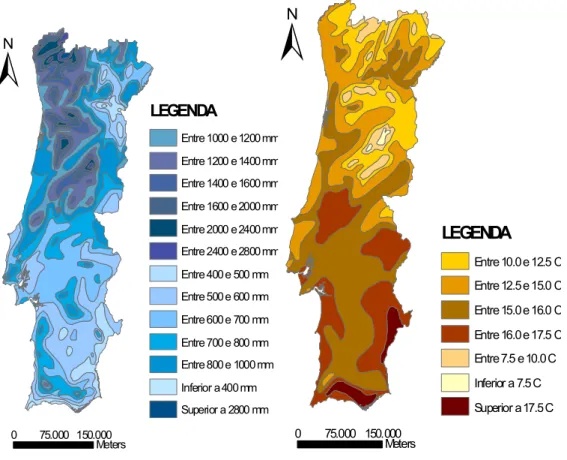
(10) LIST OF FIGURES Figure 2.1 Chemical structures of common carbonyl groups............................................. 10 Figure 2.2 Schematic equation showing the formation of formaldehyde from methane by reaction with OH-radical. (Adapted from Andrade et al, 2002). .................................. 13 Figure 3.1 (a) Rainfall Distribution (b) Temperature Distribution in Portugal (Adapted from Atlas Do Ambiente) …………………………………………...………………….…23 Figure 3.2 Google Earth map and photo of Escola de Gloria ...……………………....….24 Figure 3.3 Reaction of Carbonyl compounds with DNPH ……………….……..…..…...26 Figure 3.4 Photo showing HPLC-system set up ….………………………………...…….26 Figure 3.5 Schematic diagram representing Active sampling train set- up ...……….……27 Figure 3.6 Photot to show sampling set-up for Active sampling indoor………………….28 Figure 3.7 Calibration of DTM-Indoors ……………………………….…………..……..29 Figure 3.8 Calibration of DTM-Outdoors …..…………………………………...…….…29 Figure 4.1 Indoor average temperature and RH……………………..…….…………..….33 Figure 4.2 Outdoor average temperatue and RH………………………………..…...…....34 Figure 4.3 Indoor Carbon dioxide concentrations ...………………………………...……36 Figure 4.4 Outdoor carbon dioxide concentrations ...………………………………...…..36 Figure 4.5 CO concentration variations I/O……………………………………………....39 Figure 4.6 Indoor TVOC concentrations during week and occupation periods ………..40 Figure 4.7 Formaldehyde concentrations indoor …………………………………………41 Figure 4.8 Formaldehyde concentrations outdoor ………………………………………..42 Figure 4.9 Acetaldehyde concentrations indoor ………………………………………….44 Figure 4.10 Acetaldehyde concentrations outdoor ...……………...……………………..44 Figure 4.11 Indoor concentration of Acrolein/acetone ………….………………………..47 Figure 4.12 Outdoor concentration of Acrolein/acetone ………... ………………………47 Figure 4.13 Indoor concentration of Butyraldehyde ………... …………………………..51 Figure 4.14 Outdoor concentrations of Butyraldehyde ………..…………………………51 Figure 4.15 Indoor variations of Propionaldehyde ……………………………………….52 Figure 4.16 Outdoor variation of Propionaldehyde concentrations ……………….......…52 Figure 4.17 Variation of Benzaldehyde indoor concentrations ……………...…………...52 Figure 4.18 Outdoor variation of Benzaldehyde concentrations …………………………53. x.
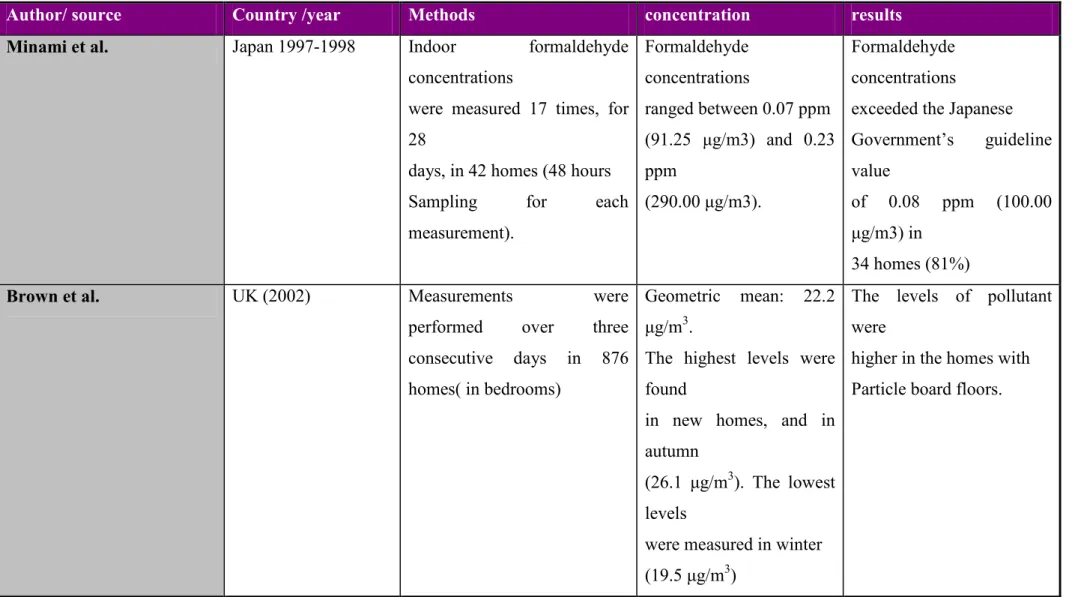
(11) LIST OF TABLES Table 2.1 Factors affecting Indoor air quality……………………………………………..9 Table 2.2 Sources of Odours and their symptoms………………………………………...10 Table 2.3 Examples of Criteria pollutants and some TAPs……………………………….11 Table 2.4 Studies on Carbonyl compounds and ther concentrations in different Indoor environments…………………………………………………………………………..14 Table 4.1 Daily weather observations…………………………………………………….32 Table 4.2 Indoor Temperature and Relative humidity…………………………………….33 Table 4.3 Indoor/Outdoor ratio of CO2…………………………………………………...35 Table 4.4 Indoor/Outdoor ratio of CO…………………………………………………….38 Table 4.5 Indoor TVOC concentrations …………………...………...…………………...40 Table 4.6 Indoor/Outdoor ratio of Formaldehyde………………….……………………..43 Table 4.7 Indoor/Outdoor ratio of Acetaldehyde ……………………………………...…46 Table 4.8 I/O ratios of Acrolein/acetone ……...………………………………………….48 Table 4.9 Indoor/Outdoor ratios of butyraldehyde, propionaldehyde and benzaldehyde concentrations during occupation …………………………………………………………50 Table 4.10 I/O ratios of butyraldehyde, propionaldehyde and benzaldehyde concentrations during week ……………………………………………………………………………….50 Table 4.11 Indoor concentrations of carbonyl compounds during 1st sampling (23rd-24th March 2011) at STP ………………………………………………………………...…….54 Table 4.12 Outdoor concentrations of carbonyl compounds during 1st sampling (23rd -24th March 2011) at STP ………………………………………………………………………55 Table 4.13 Indoor concentrations of carbonyl compounds during 2nd sampling (25th May) at STP …………………………………………………………………………………….56 Table 4.14 Outdoor concentrations of carbonyl compounds during 2nd sampling (25th May) at STP ……………………………………………………………………………………56. xi.
(12) LIST OF ABBREVIATIO S APA. Agencia Portuguesa do Ambiente. CARB. California Air Resources Board. CEPA. California Environmental Protection Agency. EFA. European Federation of Allergies and Asthma Association. IARC. International Agency for Research on Cancer. IAP. Indoor Air Pollution. IAQ. Indoor Air Quality. RSECE. Regulamento dos Sistemas Energeticos e de Climatizacao dos Edificios. STP. Standard temperature pressure (25 oC and 1atm). TVOC. Total Volatile Organic Compounds. VOC. Volatile Organic Compounds. WHO. World Health Organisation. xii.
(13) CHAPTER 1. I TRODUCTIO. 1.1 Background Until recently, most concerns regarding air quality were focused on outdoor pollution and its effects on human health. However, it is clear that exposure to indoor air pollutants is quite significant, given that people spend most of their time indoors. Human exposure occurs when an individual comes into contact with a pollutant of a certain concentration during a certain period of time. Previous scientific studies mostly focused on exposure to outdoor air pollutants. This is important as many human activities take place outdoors, but when we compare the time spent in outdoor environment, they assume a small contribution. Nevertheless, each micro-environment has unique characteristics, determined by local outdoor air, specific building characteristics and indoor activities. As a result, each individual’s personal exposure will be determined by the different indoor/outdoor microenvironments and pollutant levels to which they are exposed and the residence time, spent in each one (Stranger et al. 2007). Air pollution awareness has greatly improved by most measures with increasing attention on indoor air pollution. Over the last century, indoor air pollution has become a major environmental issue in Europe, with emphasis on indoor air quality in schools, work environments and personal dwellings. In Portugal, limited studies have been carried out regarding indoor air quality in schools (Pegas et al. 2010). Children are exposed to a complex mixture of air pollutants which include particulates, gaseous materials and microorganisms generated in different micro-environments. Consequently, they are more vulnerable to compromised indoor air quality because of their immature immune systems, high breath intake per unit mass and rapid growth (Faustman et al., 2000). Formaldehyde being the most abundant aldehyde in the atmosphere is amongst some of the pollutants found in indoor environments. Recent studies have shown that apart from formaldehyde, other carbonyl compounds have been detected in indoor environments as well (acetaldehyde, acrolein, propionaldehdye, benzaldehyde)(Wang et al. 2007, Pegas et al. 2010). Their presence could be accounted for by influence from outdoor environment or from other sources found in indoor environments. Indoor air quality has become a significant environmental health issue. Concerns about IAQ are driven mainly by human. 1.
(14) health problems (respiratory problems, dizziness, asthma, allergies etc) attributed to exposure to gaseous, particulate and microbial contaminants. A wide range of air pollutants are generated from indoor environments with most of them associated with particulate matter (PM2.5, PM10, polycyclic aromatic hydrocarbons PAHs), alongside carbonyl compounds (Slezakova et al., 2009). According to Slezakova et al., (2009), exposure levels to harmful indoor air pollutants are significant for the protection of human health given the amount of time people spend indoors and the activities they perform therein. Health problems such as irritation of eyes, nose and upper airway tracts have recently been associated with increase in indoor volatile chemicals, including formaldehyde. This is due to contaminant concentration and the ubiquitous nature of these volatile chemicals in the environment, derived from a variety of sources, such as building materials, furniture, paper products, cleaning products, arts and crafts materials as well as personal care (Sofuoglu et al. 2010).The World Health Organization (WHO) reports that indoor air pollution is the major killer in most developing and poor countries, with an estimated 1.6 million people killed annually due to inefficient and poorly ventilated stoves, burning of biomass fuels like wood, coal and crop waste (WHO,2010 ). Among the harmful pollutants in indoor air environments, volatile organic compounds (VOCs) and carbonyl compounds contribute to the most serious air pollution problems both in indoor and outdoor air, hence considered toxic air pollutants (TAPs). Although dangerous to human health, carbonyl compounds are common constituents of the atmosphere and major species of organic pollutants in the atmosphere (Granby et al.,1997; Zhang and Smith, 1999) and play an important role in atmospheric chemistry (Grosjean et al., 2002; Baez et al.,2003). Evaluation studies on carbonyl compounds (CEPA, 1993; Grimaldi et al., 1998; WHO, 2010) have reported that lower molecular weight carbonyl compounds like formaldehyde and acetaldehyde are toxic, carcinogenic and mutagenic; hence their presence in the environment is of great concern with regards to indoor air and public health. Limited studies have been carried out involving the impact of indoor air quality in schools as compared to studies involving indoor air quality in other buildings (residential, offices, hospitals). With the growing rate of children affected by allergies and asthma, IAQ in. 2.
(15) schools has become a major priority in Europe. According to EFA Thades report (2003), one out of every three children in Europe has allergy or asthma and this is associated with indoor allergens. Following these findings, the International Society of Indoor Air Quality and Climate change (ISIAQ) has developed guidelines towards IAQ in schools in partnership with the European Federation of Asthma and Allergy Associations (EFA). It has been suggested that poor indoor air quality in schools may interfere with learning activities and could cause short to long-term health effects (Mendell and Heath, 2005). Avigo et al., (2008) have stressed the need for good indoor air quality control in elementary schools, after observing from their studies that school children spend at least 30% of their time inside classrooms. Therefore, it is important to determine the sources of these pollutants in indoor air in order to enhance the air quality (IAQ) in schools. 1.2. Objectives. This study aims at assessing the contribution of carbonyl compounds to poor indoor air quality in a primary school, as well as evaluates which are the main emission sources responsible for this group of carbonyls in indoor environments. In this sense, the specific objectives developed for this study include: •. Identify and quantify the different carbonyl compounds, both indoor and outdoor alongside ambient parameters like temperature, humidity, carbon dioxide, carbon monoxide and TVOCs along two seasons (winter and spring).. •. Evaluate the impacts of different activities and ventilation on levels of carbonyl compounds in indoor air quality of the school.. •. Establish an inter-comparison between indoor/outdoor ratios of carbonyl compounds during occupation and non-occupation periods on a week-day basis.. •. Determine possible emission sources of these compounds in the classroom.. 3.
(16) CHAPTER 2. LITERATURE REVIEW 2.1 Introduction to Indoor Air Pollution and some Definitions Environmental agencies like US Environmental Protection Agency (EPA) and Health Canada have reported that levels of indoor pollutants may be significantly higher than outdoor levels. Stranger et al., (2007) reported that each indoor micro-environment is uniquely distinguished and determined by the local outdoor air, building characteristics and indoor activities. Consequently, each individual’s exposure will be determined by the different indoor micro- environment to which they are exposed and the time spent in each. Several studies have been conducted worldwide in order to evaluate indoor air pollutants and their sources in various indoor environments. Barnes et al (2009) studied the relationship between household energy, indoor pollution and child respiratory health in South Africa. Majority of the world’s population that rely on solid biomass fuel for domestic energy purposes are in poor and developing countries. Data showed that children (under 5years) living in households reliant on polluting fuels (for example wood, coal) are 2-4 times more susceptible to acute lower respiratory infections (ALRI) than those living in households that rely on electricity; resulting to an estimated 1400 deaths of under five year-olds annually in South Africa due to indoor pollution. Clarisse et al., (2003) studied and measured six aldehyde levels in Paris houses from different sources and identified their indoor determinants. The study was carried out in 61 houses in Paris and its suburbs in a two phase sampling period (from March 16 to June 1 and from September 3 to October 26 in 2001). Radiello Passive samplers were used to sample aldehydes. Results obtained showed that propionaldehyde and benzaldehyde were of minor importance compared to formaldehyde, acetaldehyde, pentanal and hexanal. Their findings also correlated mean carbon dioxide levels with high acetaldehyde, pentanal and hexanal concentrations. The authors also reported that formaldehyde concentration levels depended mainly on the age of the floor coverings. Moreover, they also found that pentanal and hexanal levels are correlated not only with floor and recent wall coverings but also with ambient parameters (carbon dioxide and temperature) and smoke.. 4.
(17) Marchand et al. (2006) measured concentrations of aldehydes indoor environments of different public area (railway station, airport, library etc) and 22 private homes in Strasbourg area (East of France). DNPH-derivitisation method was used to quantify aldehyde levels, followed by liquid chromatography coupled with UV detection. Results revealed high concentrations of formaldehyde and acetaldehyde at the airport and railway stations, in the range 1 to 10 µg.m-3. In homes, average indoor concentrations for formaldehyde were 46 µg.m-3(bedrooms), 37 µg.m-3(living rooms), for acetaldehyde, 1.2 µg.m-3(living room) and 1.6 µg.m-3(bedrooms), propionaldehyde 9µg.m-3(living rooms) and hexanal 10 µg.m-3(bedrooms). Highest concentrations of formaldehyde in public places, was found in the library (62 µg.m-3) and acetaldehyde (26 µg.m-3) in the shopping centre. Furthermore, results obtained by Lu et al. (2006) in sampling indoor concentration of carbonyl compounds in hospitals in China, showed high concentrations of acetone and of the 21carbonyls sampled in the various sites, acetaldehyde had the mean highest concentration in most sampling sites. Also the indoor/outdoor ratio for the sampled carbonyl and BTEX compounds was greater than 1 and this could be accounted for by the use of medical reagents in the hospitals, emissions from factories, weather conditions while sampling and also from indoor ozone chemistry in generating indoor aldehydes. Other studies conducted on indoor air quality and carbonyl compounds (for example, ; Williams et al., 1996; Lisa et al., 1998; Disdier et al., 2005; Feng et al., 2010) were included in this study. Prior to discussing these studies, some definitions are stated below. Indoor Air Pollution (IAP): Indoor air pollution refers to the chemical, biological and physical contamination of indoor air which may result in adverse health effects.. Indoor Air Quality (IAQ): IAQ refers to the air quality within and around buildings especially as it relates to the health and comfort of the occupants.. Pollution from particles and other organic substances may affect indoor air quality and lack of good ventilation may help increase their concentrations. Matos et al (2010) reported that increase in density of buildings, equipment of the building (heaters, photocopiers, and computers), cleaning has led to increase levels of indoor air pollution and a reduction in IAQ. IAQ in a building is affected by the interaction between the building’s location, the. 5.
(18) climate, the ventilation system, the number of occupants and the sources of contamination. Moreover the authors in their study identified some factors that affect IAQ and their possible sources of contamination (table 2.1). Table 2.1 Factors affecting Indoor air quality Factor. Source. Temperature and high values of moisture. Poor humidity control, inability of building to. compensate. for. extreme. weather. conditions, number of equipment installed Carbon dioxide. Number of occupants present, combustion sources (heaters). Carbon monoxide. Emissions. from. vehicles,. combustion,. tobacco smoke Formaldehyde. Glues, plywood, carpets, furniture, carbon paper. Particles. HVAC filters, smoke (tobacco), carpets. Organic compounds (VOCs). Copiers and printers, tobacco smoke, paints, adhesives, perfumes, cleaning products. Inadequate ventilation. Energy saving measures and maintenance, poor design of HVAC system, inadequate design of evaluation spaces.. Also the presence of odours could be an indicator of poor air quality in indoor/outdoor environments whether or not it causes symptoms. Their presence can be evaluated based on the concentration of the source (pollutant) and the amount of time an individual is exposed to this concentration. Matos et al.2012 classified some typical odours by means of their source pollutants and associated some symptoms observed during exposure, in indoor/outdoor environments (table 2.2).. 6.
(19) Table 2.2 Sources of odours and their symptoms Odour type. Source (pollutant source). symptom. Exhaust fumes (diesel). Carbon monoxide. Headaches,. nausea,. dizziness Body odour. High. levels. dioxide. due. ventilation. of. carbon Headaches, fatigue to. low rates,. overcrowding Damp and musty smell. Bacterial formation due to Allergic symptoms humidity. Solvents, perfume odours, VOCs and formaldehyde. Dizziness, allergic reactions,. chemicals, pesticides. irritation of eyes, nose and throat. Source: Adapted from Matos et al. 2010. Toxic Air Pollutants (TAP): Toxic air pollutants are defined as substances that have the potential to cause serious and adverse health effects and damage to the environment (Boubel et al., 1994).. They differ from other primary air pollutants like SO2, NO2, particulate matter (total suspended particulates and respiratory suspended particulates) in that even when they are present in relatively low concentrations in ambient environment, their health effects are typically carcinogenic in nature (Lee et al., 2001). Some TAPs can cause severe health problems if an individual is exposed for a long period of time. The extent to which TAPs affect human health is dependent on the concentration of the pollutant exposed to, frequency of exposure, duration of exposure, toxicity of the pollutant and the individual’s susceptibility and health state. Several toxic pollutants are released from various sources which may include natural sources (volcanic eruptions, forest fires), anthropogenic sources/ man-made sources (combustion fumes from vehicles, factories, power plants, refineries). In indoor environments, air toxics may be found from sources which may. 7.
(20) include cleaning solvents, volatile paints and other household activities. US EPA under Title III of the Clean Air Act 1990 has classified 189 pollutants as TAPs based on their ability to cause cancer or other serious health effects to humans1. US EPA, under the Clean Air Act regulation, classifies air toxics into two groups; TAPs and Criteria pollutants. Criteria pollutants involve those pollutants that are found in relatively large quantities in the lower atmosphere and in populated urban areas. They differ from TAPs due to their large concentrations in ambient air. Six main pollutants are classified under criteria pollutants and regulated under Title I of the Clean Air Act 1990. Table 2.3 summarizes examples of TAPs and criteria pollutants as defined by USEPA Table 2.3 Examples of Criteria pollutants and TAPs Criteria Pollutants. TAPs. Carbon monoxide. Acetaldehyde. Ozone. Benzene. itrogen dioxide. Perchloroethylene. Sulphur dioxide. formaldehyde. Lead. Toluene. Particulate matter. Methylene chloride Asbestos Dioxin cadmium. Source: Adapted from US EPA1 Sick Building Syndrome (SBS): SBS is a term which refers to buildings in which majority of the occupants experience acute health and comfort effects that seem to be linked to the time they spend in the buildings but in which no specific illness or cause can be identified. This is mostly caused by excessive indoor air pollution and common symptoms may include headache, fatigue, skin irritation, watery eyes, dizziness and nausea (EFA THADE report, 2003). Cases of such still occur in some countries like Japan (Harada et al., 2010),. 1. http://www.epa.gov/ttn/atw/allabout.html Accessed May 15 2011.. 8.
(21) and they are associated to poor buildings even though the Japanese government has implemented strict regulations on indoor chemical substances used in buildings.. 2.2 Carbonyl Compounds. 2.2.1 Occurrence Carbonyl compounds are reactive volatile substances, having the carbonyl group. They range from aldehydes, esters, carboxylic acids to ketones. They are present in ambient air and ambient carbonyls are mostly emitted in exhaust gases of vehicles and industrial machinery through incomplete combustion of hydro-carbon fuels (Liu et al., 2006), other sources include cigarette smoking, cook stoves, building and decorating materials, household commodities and furnishings. Another important source of carbonyl compounds is atmospheric photochemical reactions (photochemical oxidation of atmospheric hydrocarbons and precursors of free radicals, ozone and peroxyacyl nitrates (Bidleman et al., 1986; Baek et al., 1991; Baez et al., 1995; Granby et al., 1997). They are major contributors to urban photochemical smog as they are a source of free radicals in the atmosphere, acting as precursors to the formation of organic aerosols. They are of major importance in indoor air environments due to their irritant effects at relatively low concentrations (Godish, 2000). Examples of typical carbonyl compounds found in indoor environments. include. formaldehyde,. acetaldehyde,. acrolein,. benzaldehyde,. isovaleraldehyde and hexanal.(Table 2.4) The Clean Air Act Amendments of 1990 classifies formaldehyde, acetaldehyde and propionaldehyde as air toxics (USEPA, 1991). Graedal et al., (1986) listed 100 aldehydes that are present in urban atmosphere from sources which include industrial activities, fossil fuel combustion, sewage treatment microbiological processes etc. Atmospheric aldehydes are divided into three groups; saturated aliphatic, olefinic and cyclic aromatic aldehydes.. 9.
(22) O. O. O. O. C. C. C. C. R. H. Aldehyde. R. R’ ketone. R. OH R. carboxylic acid. OR’. esters. Fig 2.1 Chemical structures of common carbonyl groups. 2.2.2 $atural sources The occurrence of carbonyl compounds in the atmosphere range from natural sources to secondary formation through photochemical reactions in the atmosphere. Natural sources of carbonyls include mostly plants for example; acetaldehyde found in apples and also as a by-product of fermentation; olefinic and aromatic aldehydes found in essential oils of fruits and plants like citronella in rose oil, citral in oil of lemongrass and benzaldehyde in oil of bitter almonds. However, natural sources do not contribute much to the presence of carbonyls in ambient air (WHO, 2010) as some carbonyl compounds could arise from photochemical reactions involving biogenic VOC emissions like terpene compounds.. 10.
(23) Table 2.4 Studies on Carbonyl compounds and their concentrations in different Indoor environments Author/ source. Country /year. Methods. Minami et al.. Japan 1997-1998. Indoor. concentration. results. formaldehyde Formaldehyde. Formaldehyde. concentrations. concentrations. concentrations. were measured 17 times, for ranged between 0.07 ppm. exceeded the Japanese. 28. (91.25 µg/m3) and 0.23 Government’s. days, in 42 homes (48 hours. ppm. Sampling. for. guideline. value of. each (290.00 µg/m3).. 0.08. ppm. (100.00. µg/m3) in. measurement).. 34 homes (81%) Brown et al.. UK (2002). Measurements performed consecutive. were Geometric. homes( in bedrooms). 22.2 The levels of pollutant. three µg/m3.. over days. mean:. in. were. 876 The highest levels were higher in the homes with found. Particle board floors.. in new homes, and in autumn (26.1 µg/m3). The lowest levels were measured in winter (19.5 µg/m3). 11.
(24) Garrett et al.. Australia. Formaldehyde. levels. were The median indoor. Formaldehyde levels may. Latobe Valley 1994- measured I 80 dwellings on formaldehyde level was reach peak concentrations 1995. four occasions with passive 15.8. in. µg/m3 with a maximum of Australian dwellings.. samplers.. 139 µg/m3 Lemus et al.. USA. Gas. Southern. analyses were performed from concentrations. Louisana(1998). air. Indoor formaldehyde. chromatography Indoor formaldehyde. samples. collected. ranged concentrations generally exceeded the American. in from. 53homes.. non-detectable values to. Society of Heating,. 6.60µg/m3. Refrigeration, and Air Conditioning Engineers (ASHRAE) recommended levels. Liu et al.. USA (1991). Indoor. formaldehyde Indoor formaldehyde. concentrations were measured concentrations in. mobile. passive. homes. using from. monitors. values. Formaldehyde. ranged concentrations may be very. non-detectable high in mobile homes. (0.01. ppm. Formaldehyde concentrations (12.50µg/m3) to 0.46 ppm were. (575µg/m3).. Measured for 1 week in summer and 1 week in winter 12.
(25) . 2.2.3 Anthropogenic sources Motor vehicle exhausts emit hydrocarbons which undergo photochemical reactions to produce formaldehyde and other carbonyls in the atmosphere. Formaldehyde is the major aldehyde present in diesel and petrol vehicle exhausts; hence vehicle exhausts are primary sources of carbonyls in the atmosphere. Also industrial processes account as a source of carbonyls like manufacture of aldehydes by oxidation of hydrocarbons and hydroformulation of alkenes. 2.2.4 Secondary Pollutants Carbonyl compounds as secondary pollutants are formed in the atmosphere through complex photochemical reactions involving volatile organic compounds, ozone, nitrogen oxides (NOx radicals) and oxygen. The photochemical reactions are driven by sunlight and increase with temperatures. Fig. 2 illustrates the formation of carbonyls through a series of free-radical reactions, usually initiated through the reaction of a hydroxyl radical with a hydrocarbon (USEPA, 2003).. Fig 2.2 Schematic equation showing the formation of formaldehyde from methane by reaction with OH-radical. (Adapted from Andrade et al, 2002).. 13.
(26) Indoors, photo-oxidation reactions involving hydrocarbons and VOCs with ozone, can lead to the production of aldehydes in indoor environments. Singer et al. (2006) observed an increase in formaldehyde concentrations with the use of cleaning products in the presence of ozone in indoor environment, concentrations of 9-16 ppb and 5-10 ppb over periods of 0-4 hour and 4-12 hours after cleaning. Morrison and Nazaroff (2002) studied ozoneinduced production of aldehydes with carpets. Their results indicate that surface interactions of ozone with carpets produced C1-C13 n-aldehydes and several unsaturated aldehydes; marked increase in total aldehyde emission rates with ozone exposure, from 170µg m2 h-1 for unexposed samples, to 60-800µg m2 h-1 during exposure. Anthropogenic and biogenic emission sources account for in-situ formation of carbonyls especially formaldehyde (EPA, 1999). Aldehydes in particular are primary and secondary pollutants in the atmosphere. Their fate as photochemical reaction products, precursors in production of photochemical smog and source of free radicals, make it important to determine aldehyde concentrations in ambient air. 2.2.5 Formaldehyde Formaldehyde being the most abundant atmospheric aldehyde (Williams et al., 1996) is produced by natural sources and anthropogenic sources. It is released by natural sources from biomass combustion (forest and bush fires) and from anthropogenic sources by fuel combustion from traffic and on-site industrial activities (WHO guidelines 2010). Formaldehyde is flammable, colourless, and highly reactive both chemically and photochemically and is readily polymerized at ambient temperatures. Studies show that formaldehyde undergoes two primary reactions, photolysis and reaction with OH in the atmosphere with the production of carbon monoxide (CO) in both reactions and free radicals. Indoor sources of formaldehyde include combustion processes such as smoking, heating, burning of candles, incense and volatilization of formaldehyde from several household cleaning products (IARC, 2006; Salthammer et al., 2010). Apart from formaldehyde being the most abundant and most concerned airborne carbonyl, it is classified as carcinogenic to humans by the International Agency for Research on. 14.
(27) Cancer (IARC, 2004). Other sources may include furniture and wooden-based products with formaldehyde-based resins, insulating material, paints, textiles etc. With the indoor sources, it is difficult to ascertain the major sources of formaldehyde which contribute to high indoor levels. According to Uhde and Salthammer (2007), secondary formation of formaldehyde takes place indoors by chemical reactions between ozone and terpenes. Formaldehyde in indoor air quality has received considerable attention both from public and research institutes. Various papers have been published in relation to formaldehyde concentrations in indoor air quality and in different countries. (Refer to table 1). Harada et al. (2010), reported formaldehyde concentrations increase with summer temperature and hence correlates positively with indoor temperatures. WHO has set indoor air guideline for formaldehyde concentration limit at 0.1 mg/m3 for an average 30min concentration and should not be exceeded at any 30 min –interval during the day. Moreover, other international organizations such as the California Office of Environmental Health Hazard Assessment (OEHHA), recommends exposure levels to formaldehyde of 76ppb for a onehour exposure and 27 ppb for an eight-hour exposure in residential homes (CARB, 2004). Formaldehyde is the main aldehyde in petrol and diesel vehicle exhausts, but Ball et al. (1991) ascertain it is difficult to establish in urban areas if formaldehyde arises from atmospheric photochemistry or from exhaust emissions. Lee et al. (2001) obtained high concentrations of formaldehyde and acetaldehyde at the roadside station and ascertained that the major source of these carbonyl compounds and PAHs in urban atmosphere involved vehicle emissions. Also seasonal variations of formaldehyde were registered, with high concentrations in summer than in winter, due to evaporation of fuel or photochemical reactions under solar radiation. The data obtained agrees with those obtained by Harada et al. (2010) that formaldehyde concentrations increase with summer temperature. Up to 70-80 % of total aldehydes in urban atmosphere are assumed to be formaldehyde, from automotive sources (Grosjean 1982). Further studies by Lawson et al. (1990) reported a correlation between ambient concentrations of formaldehyde and primary pollutants from motor vehicles. Formaldehyde concentration peaks varied on a daily morning to afternoon peak; with the morning peak associated with the presence of nitrogen oxide and particulate elemental carbon (PEC) and the afternoon peak associated with the presence of photochemically produced ozone on site. This data clearly showed that automobile sources. 15.
(28) contribute significantly to aldehyde ambient concentrations. Health problems associated with formaldehyde exposures include irritation (mostly eyes, nose and throat), ability to cause sensitization, asthma and carcinogenicity. 2.2.6 Acetaldehyde. Acetaldehyde being the second most abundant carbonyl compound is found both naturally and in diesel exhausts. It is abundant in urban areas with a range of 2-39 ppb (Williams et al. 1996). Lu et al. (2006) reported high levels of acetone, acetaldehyde and formaldehyde in indoor air in hospitals in China. Their concentrations indoor were relatively higher than in the outdoor environment. This showed that indoor sources accounted for the increase in indoor concentrations of these carbonyl compounds. Also, Williams et al., (1996), reported that aldehyde concentrations are dependent on photochemical activity, with higher concentrations during the days with high photochemical activity while formaldehyde concentration decreased with decrease in motor vehicle traffic.. 2.2.7 Ketones. Graedel et al. (1986) identified over 220 individual ketones in the atmosphere. Among these are Aliphatic ketones; which are common atmospheric constituents and main sources of emission includes biological processes (sewage treatment), industrial use and fossil fuel combustion; Olefinic ketones and cyclic ketones, produced primarily by vegetation; Aromatic ketones resulting from fuel combustion (coal, petroleum and biomass). Although present in atmospheric air, little has been studied about their concentrations and chemistry in indoor environments. 2.2.8 Comparison of methods used to measure Carbonyls. Various sampling guidelines have been established for the sampling of carbonyl compounds both in indoor and outdoor environments. The United States Environment Protection Agency (EPA) and the European Union (EU) have guideline techniques for measurements of these compounds especially formaldehyde. The use of a specified method depends on the type of compounds to be sampled. The most common quantitative. 16.
(29) technique used in determining carbonyls active sampling with DNPH cartridges and derivatization by UV-HPLC analysis (mostly applied in determining C1-C5 aldehydes and ketones). One advantage to this method is that it detects almost all of the carbonyl compounds, with high sensitivity and detection limit of 0.002 mg/m3 (IARC, 1995) but due to limitations, solid-adsorbent technique is more convenient than the impinger method. Other techniques used for the detection of formaldehyde and other carbonyl compounds include spectrophotometry, colorimetry, fluorimetry, polarography, infrared detection and gas detector tubes (IARC, 1995). Williams et al. (1996) used the US EPA Method TO5 (10) wet chemical technique (one of the methods used in measurements of carbonyl compound concentration in ambient air and indoor air) in estimating the concentration of some carbonyl compounds. The concept behind this method involved air being drawn into a midget impinger containing acidified solution of 2, 4- dinitrophenylhydrazine (DNPH) by a peristaltic pump. Two 25cm3 jet inlet impingers (A and B) were loaded each with 10 cm3 of DNHP reagent and 10 cm3 of iso-octane. They were later on connected in series and placed in an insulated ice bath with a third impinger containing silica gel. Ambient air drawn by the peristaltic pump is sampled at a flow rate of ≈ 0.5 l/min for 2-3 hrs and the total sampled air volume recorded by a gas meter (maximum sampled volume 80L). They used the solid-phase extraction technique where air was drawn through a cartridge (Waters SEP-PAK DNPH-silica cartridge) containing chromatographic-grade silica coated with acidified 2, 4 DNPH (same volume of air and sample time as applied in the first method with the same flow rate.) In both techniques, sampled carbonyls reacted with the DNPH to form stable dinitrophenylhydrazones and the concentrations later were determined using reverse phase high performance liquid chromatography (HPLC) with UV diode array absorption detector. Comparing results from both methods, they reported that US EPA Method TO5 was more sensitive than the solid-phase extraction technique and more carbonyls were detected under same sampling conditions. Lee et al. (2001), Feng et al. (2004, 2005), Lu et al. (2006) also had similar results using the same method above. Other studies on sampling carbonyl compounds in ambient air involve DNPH derivatization and electro-spray ionization tandem mass spectrometry (LC-ESI-MS/MS) detection used by Chi et al. (2007) to sample low carbon carbonyl compounds. The method was applied to samples from a residential area in China and data obtained showed acetone. 17.
(30) to be the most abundant carbonyl compound, followed by formaldehyde, acetaldehyde and butyraldehdye/2-butanone. Moreover, they also demonstrated the effectiveness of the LCESI-MS analytical method in determining more carbonyl compounds in air samples than the LC-UV method (liquid chromatography with UV detection). Uchiyama et al. (2004) reported the presence of carbonyl compounds in indoor air using a diffusive sampling device (DSD-DNPH). The device was developed for the collection of 21 carbonyl compounds. It comprised of a silica gel coated with DNPH as the adsorbent, a porous sintered polyethylene tube, acting as a diffusive membrane and a small polypropylene syringe used for the elution of analytes from the adsorbent. A side by side comparison with active samplers, showed a good correlation (formaldehyde r2 = 0.992). Furthermore, they reported that the relative standard deviations of formaldehyde and acetaldehyde concentrations were 5.5 % and 8.6 % respectively, with a face velocity from 0 to 5.0 ms-1. Hak et al. (2005) intercompared four different in-situ techniques for ambient formaldehyde measurement in urban air. Six research groups employed eight instruments for four different techniques: Differential Optical Absorption Spectroscopy (DOAS), Fourier Transform Infrared (FTIR) interferometry, the fluorimetric Hantzsch reaction technique and a chromatographic technique involving C18-DNPH-cartridges.Results showed formaldehyde concentrations determined by DOAS, FTIR and the Hantzsch instruments, were found to agree within ±11%. Integrated samples by DNPH, sampled over a two hour period showed lower concentrations (up to 25%) than the continuous measuring instruments over the same time period. Masayuki et al.(2007) experimented sampling carbonyl compounds using passive samplers, made of porous polyethylene cylinders, uniformly packed with O- (-4-cyano-2ethoxybenzyl) hydroxylamine (CNET) coated silica gel as reactive adsorbent. This passive sampler was applied to field measurements and they obtained similar results when compared to 2,4-DNPH coated cartridges. Moreover, results stated that CNET was less degradable when exposed to ozone than DNPH hence a more suitable passive technique for sampling carbonyls.. 18.
(31) 2.3 Indoor Air Quality in Schools (IAQ). In the past, much attention was paid to studies related to outdoor air contaminants. With the increasing awareness of indoor air pollution and the relation between outdoor and indoor ratios of contaminants, studies are carried out to determine concentrations of pollutants in indoor air especially in schools, restaurants, residential areas and hospitals. IAQ in schools is of major importance as there is high occupant density, insufficient outdoor air supply, poor construction and high incidence of allergic and infectious diseases (Pegas et al. 2010). Sofuoglu et al. (2010) in their study of indoor air concentrations of volatile compounds in Turkish schools, ascertain that children aged 7-14 spend about 5-8 hours daily in the schools and this is important in terms of exposure and the amount of time spent indoors. Moreover, good IAQ contributes to favourable learning environment since poor IAQ affects the health of the students, staff, educational process as well as cost. The US EPA has set out guidelines (tools) on IAQ in schools to enable prevent, assess and identify major indoor air problems with minimal cost. The tools involve background information on IAQ and pollution strategies, checklists for different building systems and pollution control strategies, as poor buildings also affect IAQ. Studies carried out indicate high concentrations of indoor air pollutants indoors than outdoors. Norback et al. (1990) measured VOC and formaldehyde concentrations in six classrooms in Sweden and reported that concentrations of formaldehyde found were below the detection limit (<10 µg/m3) and the mean indoor total VOCs concentration, ranged from 70 to 80 µg/m3. Smedje et al. (1997) investigated the presence of VOCs and formaldehyde in 38 randomly selected schools and found concentrations of formaldehyde below the detection limit of 5 µg/m3 and the average sum of 14 identified VOCs to be 35µg/m3, with high concentrations of toluene, limonene, n-decane and xylene. Additional substances found apart from carbonyls in indoor air include benzene, toluene, ethylbenzene and the isomers of xylene commonly known as BTEX. They are VOCs emitted from fuel combustion by road traffic. They are mostly found in combination with carbonyls in indoor air. BTEX are known to cause haematological problems (benzene) and affect respiratory system and even cause cancer (Pearson et al. 2000).. 19.
(32) Lee et al. (2002) investigated VOCs and formaldehyde in 10 schools in Hong Kong, with air-conditioned classrooms and located urban, industrial and residential area. Results indicated average indoor formaldehyde concentrations did not exceed the standard (100 µg/m3) and the most abundant VOCs found were benzene (3.13 µg/m3), toluene (17.7 µg/m3), ethylbenzene (4.20 µg/m3), p/m xylene (3.30 µg/m3) and o-xylene (1.66 µg/m3). Godoi et al. (2009) reported BTEX concentrations in elementary schools in Curitiba were high and indoor/outdoor ratios larger than 1; indicating possible accumulation of these pollutants in classrooms and influence of outdoor environment on indoor air quality. Also similar results were obtained by Pegas et al. (2010) in schools in Lisbon with high benzene concentrations indoors (ranging from 0.2-0.9 µg/m3 than outdoors; although it was lower than the EU limit for mean annual benzene exposure (5 µg/m3).With respect to carbonyl compounds, mostly atmospheric aldehydes were present with concentrations of formaldehyde in particular much higher indoor (from 1.48- 42µg/m3) than outdoor, indicating indoor sources. For example composite wood, tobacco smoke, combustion processes all contribute to indoor levels of formaldehyde than outdoor sources (vehicle exhausts). It is therefore of high importance to monitor indoor air quality in school to create a healthy environment for studies which does not impair health. This study is part of an enlarged study that seeks to evaluate and characterise indoor air quality in Portuguese schools.. 20.
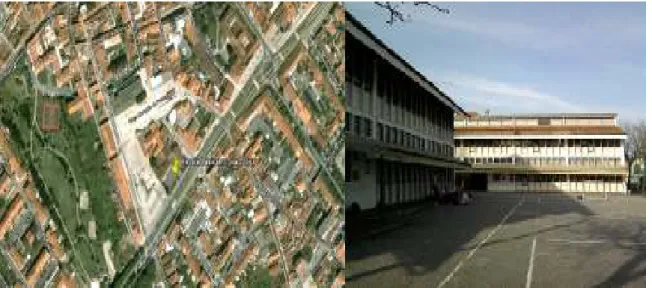
(33) CHAPTER 3. METHODOLOGY This study is part of an enlarged monitoring campaign of comfort parameters, particulate matter (PM10), carbonyl and volatile organic compounds. An intense sampling campaign was carried out for a period of nine weeks beginning from 28th February to 27th May 2011. Sampling of carbonyls was carried out alongside VOCs using passive samplers and particulate matter. Active sampling of carbonyls and VOCs was also carried out twice (once in the beginning of the campaign and another sampling in the end of the campaign). A total number of 40 samples were collected using passive sampling and 20 samples for active sampling. During the 4th week of sampling, plants were introduced into the classroom in order to determine their role in reducing concentration of air pollutants in indoor environments.. The study was carried out in a Portuguese school that is. representative of most characteristics found in schools in Portugal urban areas. The study focused more on carbonyl compounds and this chapter gives a detailed description of the methodology and analytical procedures used. 3.1 School location and Description The study was conducted in Escola de Gloria situated in Aveiro. Aveiro is a small urban city situated in the Centre Region of Portugal, with a total area of about 199.9km2, a population of about 73,559 inhabitants and it is located along the Atlantic coast. Mediterranean climate trends are observed in Aveiro, with hot summers (with an average maximum high temperature of about 30oC) and mild winters (average maximum daytime temperatures range from 13-18 oC and minimum temperature of about 5 oC in the mornings and at night). July and August are the warmest months. Annual rainfall in Aveiro ranges from about 700-800 mm (Fig 3.1 a and b) Escola de Gloria is located close to the Aveiro city centre, situated at Rua Gustava Ferreira Pinto Basto (40⁰ 38’ 16.76’’N; 8⁰ 39’ 09.85’’W) with an elevation of about 8 m. The establishment represents typical urban characteristics and it is located near a very intense traffic route. It consists of two main blocks; each having six classrooms, distributed on two. 21.
(34) floors. It also comprises of four offices, a gymnasium, a library and a multipurpose cafeteria. Indoor and outdoor air samples were collected at the school both during class periods and during the whole week. The class chosen for sampling, had an electric heater, with windows closed during the first two weeks of sampling due to cold weather. From the fifth week, two windows were usually left open all day for the remainder of the sampling campaign. The class was situated on the second floor and had a dimension of 7 m x 7.30 m, with height 4.5 m and a total surface area of 51.1 m2.. ±. ±. LEGENDA Entre 1000 e 1200 mm Entre 1200 e 1400 mm Entre 1400 e 1600 mm Entre 1600 e 2000 mm Entre 2000 e 2400 mm. LEGENDA. Entre 2400 e 2800 mm. Entre 10.0 e 12.5 C. Entre 400 e 500 mm. Entre 12.5 e 15.0 C. Entre 500 e 600 mm. Entre 15.0 e 16.0 C. Entre 600 e 700 mm. Entre 16.0 e 17.5 C. Entre 700 e 800 mm. Entre 7.5 e 10.0 C. Entre 800 e 1000 mm. 0. 75.000 150.000 Meters. Inferior a 400 mm. Inferior a 7.5 C. Superior a 2800 mm. Superior a 17.5 C 0. 75.000 150.000 Meters. Fig 3.1 a) Rainfall distribution b) Temperature distribution in Portugal. Source: Adapted from Atlas Do Ambiente.. 22.
(35) Fig 3.2: Google Earth map and photo of Escola de Gloria The room was equipped with a blackboard, a computer, a projector, and the floors were wooden. Cleaning was done at the end of each day, with the blackboard, tables and corridors cleaned with a water soluble cleaning product, LPT-HACCP with wild flower scent produced by SOLIS, a Portuguese company. Other cleaning products used in the school included AGISOL and hypochloride solution, produced by SOLIS as well for the cleaning of toilets. The number of students found in the class daily ranged from 13-15 pupils, with an age range of 7-11 years old.. 3.2 Sampling and Analysis. 3.2.1 Comfort Parameters. Sampling was carried out during a period of nine weeks, with pollutants and comfort parameters measured simultaneously both indoors and outdoors. Comfort parameters like temperature, carbon dioxide (CO2), relative humidity (RH), carbon monoxide (CO) and total VOCs were measured continuously with an automatic portable Indoor Air IQ-610 Quality probe (Gray Wolf® monitor ) in the classroom. The monitor includes a Pt probe to measure temperature, a capacitance probe to sense RH, a CO2 non-dispersive infrared sensor and a CO electrochemical sensor all of them with an extremely fast response. The monitor also includes a photo-ionisation detector to track total VOCs over time. It displays real time measurements and allows for logged data to be downloaded to WolfSense® PC. 23.
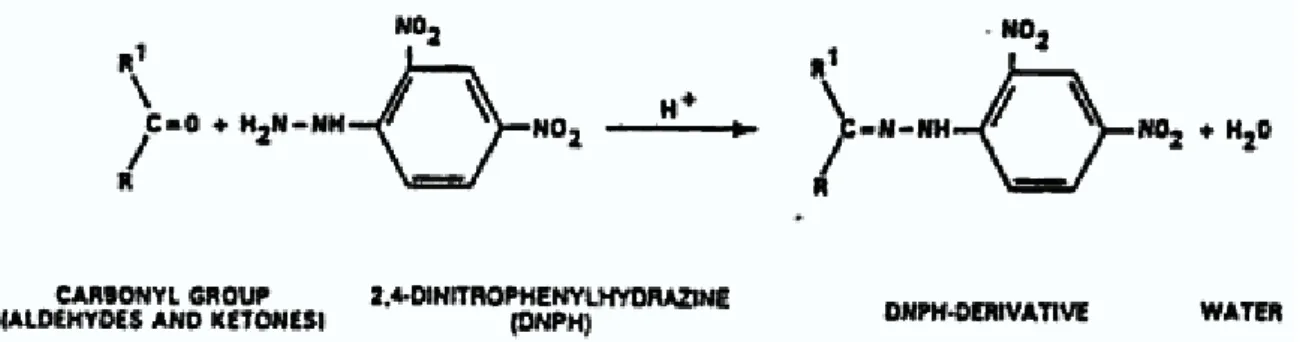
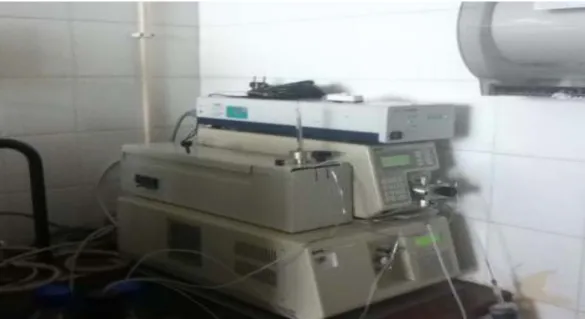
(36) software for analysis (Pegas et al. 2010). The equipment was supplied with a factory calibration certificate but it was further checked prior to its use with appropriate calibration kits. 3.2.2 Passive Sampling Passive samplers for carbonyl compounds from Radiello® were used to obtain a screening of heavy and light molecular weight compounds over the nine-week period. Indoor passive samples (classroom and corridor) were collected at a height of about 1.5 m above the floor. The samplers were positioned at a distance that should exceed 1m from a window or door. Outdoor samples were collected at heights of about 2m above the ground. Carbonyl compounds collected in the cartridges filled with 2,4-dinitrophenylhydrazine reacted to give the corresponding 2,4-dinitrophenylhydrazones (fig 3.3) where R and R1 are alkyl group or aromatic group (Ketones) or either aldehydes. The analytes were extracted with 2 ml of acetonitrile. The glass vials were shaken for approximately 30 mins and the extract filtered through a 0.45µm disc membrane filters (Filtration Kit RAD 174) and later analysed by high-performance liquid chromatography (HPLC)2. The analytical system consisted of a Jasco PU-980 pump, a Rheodyne manual injection valve (sample loop of 20µl), a Supelcosil LC-18 column (250 x 4.6 mm; 5µm; Supelco) and a Jasco MD-1510 diode array detector, all connected in series (fig 3.4). Isocratic elution at room temperature was performed using acetonitrile/water solution (60/40, v/v) as the mobile phase at a flow rate of 1.5 ml/min. The carbonyl concentrations were quantified with external calibration curves constructed from standard solutions of TO11/IP-6A carbonyl-DNPH mix purchased from Supelco (US EPA, 1997).(See Appendix A).. Fig 3.3 Reaction of carbonyl compounds with DNPH 2. http://www.radiello.com/english/ald_en.htm accessed April 17 2011. 24.
(37) Fig 3.4: Photo showing HPLC system set-up The average concentration of carbonyls in passive samples over the whole sampling period is derived using the equation below (3.3)2 C (µg.m-3 ) = M (µg) /. Where C – concentration. Q (ml.min-1) T(min) X 1000. of carbonyl compound in (µg. m-3). M – mass of carbonyl compound in µg. Q - Sampling rate T - Exposure time in minutes It should be noted that the sampling rate varies with temperature; the effect of temperature on the sampling rate is expressed by the following equation; 1 Q k = Q298 (K/ 298) 0.35. (3.4). Where Q k is the sampling rate at temperature K Q298 is the reference value at 298 K.. 25.
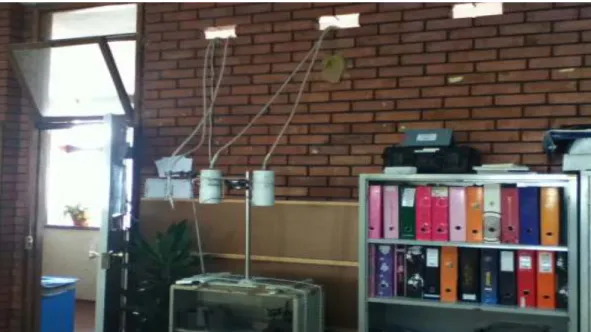
(38) 3.2.3 Active Sampling. Carbonyls were collected by drawing air through silica gel cartridges, impregnated with 2,4-dinitrophenylhydrazine reagent (Waters Sep-Pak DNPH-silica). Active sampling involved a sampling train which consisted of a Thomas Pump to draw in air through prepared sampling cartridges, a dry gas meter to measure the volume of air sampled and ozone scrubbers to limit ozone interference during sampling. Studies have shown negative interference of ozone at high concentrations on carbonyl sampling by reacting with both the DNPH and its carbonyl derivatives (hydrazones) in the cartridge (ASTM 1997). The dry gas meters were calibrated prior to use with a soap bubble meter and calibration curves were generated. Air was sampled at a flow rate of 2L/min for a sampling time of 1-2hours in agreement with the classroom cycles in order to get the time weighted average (TWA) of the samples, during occupational period. The volume of air sampled was measured at the beginning and end of each sample cycle. Sampling was done in parallel both indoors and outdoors, during which the cartridges were wrapped with aluminium foil to limit effect of sunlight (especially outdoors). After sampling, the cartridges were immediately removed from the sampling train, capped with their end caps and wrapped in aluminium pouches. The pouches were later transported to the lab in a cooler, filled with blue ice packs and stored in the refrigerator at temperatures below 0 oC until analysis. Carbonyl compounds collected in the cartridges react with the 2,4-dinitrophenylhydrazine to give corresponding stable derivatives of. 2,4-dinitrophenylhydrazones as described earlier for passive. sampling. The analytes were extracted with 5ml of acetonitrile by filtration through gravity feed elution and the extract collected in 3ml vials and later analysed by high-performance liquid chromatography HPLC with UV detection at absorption wavelength at 360nm. Figure 3.5 represents a typical set-up for an active sampling train for usage both indoor and outdoor.. 26.
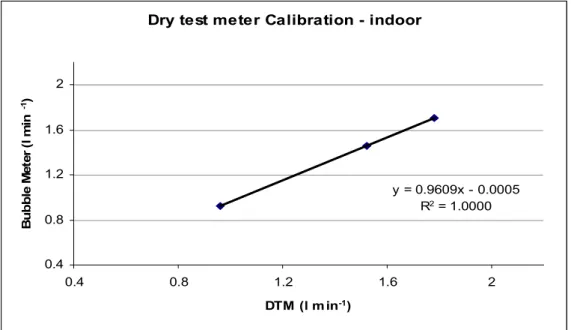
(39) Fig 3.5 Schematic diagram representing active sampling train.( A- ozone scrubber, Bsilica cartridge, C- valve, D- pump, E- dry test meter). (Adapted from JEMES-MAP Lectures 2011). Fig 3.6 Photo to show sampling set up for Active sampling indoors. Calibration was done using a primary calibrator (soap bubble meter) for both dry gas meters. The initial and final volumes of both dry gas meter and bubble meter were recorded and the calibration curves obtained as seen in figs 3.7 and 3.8.. 27.
(40) Dry test meter Calibration - indoor. Bubble Meter (l min -1). 2. 1.6. 1.2 y = 0.9609x - 0.0005 R2 = 1.0000 0.8. 0.4 0.4. 0.8. 1.2. 1.6. 2. -1. DTM (l m in ). Fig 3.7: Calibration curve of DTM-Indoors.. Dry test meter Calibration outdoor. -1. Bubble meter (l min ). 2.6. 2.2. 1.8 y = 0.9424x - 0.0123 2. R = 0.9999 1.4. 1 1. 1.4. 1.8. 2.2. 2.6. -1. DTM (l min ). Fig 3.8 Calibration curve DTM-Outdoors The concentration of carbonyl compounds for active samples is determined by calculating the total volume sampled under STP Vs = Vm ×PA / 760 × 273 / (273 +Ta). (3.1). Where Vs - total volume of sample at 250C and 760 mm Hg pressure. 28.
(41) Vm - total volume sampled at measured temperature and pressure PA - average ambient pressure during sampling. Ta - average ambient temperature.. Calculating the concentration of carbonyl, the equation below is used C (µg.m-3) = M (µg) / Vs (m3). (3.2). Where M is the mass of carbonyl compound and Vs the total volume sampled at 25 0C and 760 mmHg. 3.2.5 Quality Control. The calibration standard solution (DNPH-Aldehyde/Ketone mix), purchased from Supelco, contained over 15 carbonyl compounds. Analytical method could be satisfactorily optimized for all 15 compounds, with acrolein and acetone appearing as one peak, resulting to a 14-peak chromatograph. Calibration standards were prepared with different concentrations (0.25, 0.5, 1.0 and 3.0µg/ml). Each standard was analysed and the area response tabulated against the mass concentration injected. The calibration curves gave a satisfactory linear fit (close to 1, R2>0.99). Samples were injected twice and carbonyl compounds were identified based on the retention time. The relative error for more than 90% of the samples was less than 1.5%.. 29.
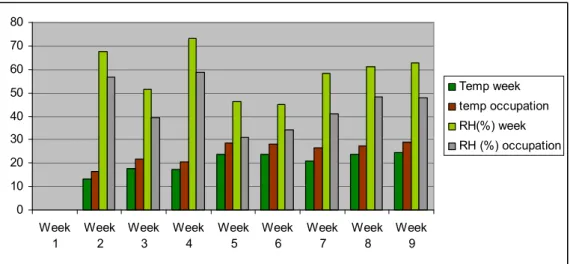
(42) CHAPTER 4. RESULTS A D DISCUSSIO. During nine weeks of sampling (28th February – 27th March), one representative classroom at Escola de Gloria was selected to perform the characterization of indoor air quality. The class was located on the second floor of the building. During the first two weeks of sampling, the weather was cold, with temperatures typical of a winter season. As from mid- March, the air temperature increases with change in season from winter to spring, reaching a maximum of about 30 oC. This chapter presents the results obtained after sampling and analysis using passive and active methods. Ambient parameters will be discussed as well as target carbonyl compounds identified. Samples were collected from the corridor adjacent to the classroom sampled in order to determine their contribution as a source to carbonyl compounds in the classroom.. 4.1 Comfort Parameters. 4.1.1. Temperature and Relative Humidity The daily variation of comfort parameters was recorded throughout the nine-week sampling period. The mean weekly average temperature values recorded at the school ranged from 16.6 ± 1.16 oC to 26.29 ± 1.34 oC and during class period (occupation), the values ranged from 17.13 ± 1.06 oC to 26.26 ± 1.56 oC, indoors (Fig 4.2). For outdoors, the values during the week and class periods ranged from 13.34 ± 3.83 oC to 24.47 ± 5.05 oC and 16.53 ± 3.10 oC to 28.93 ± 3.90 oC respectively. Temperature gradually increased from week 1-week 9 as the season changed from winter to spring. It is not uncommon for rain showers to be noticed during this period as the weather changed from warm and dry during the first two weeks to cold and wet around the fourth week and eight week and finally warm and hot conditions again in the last week (Table 4.1) Relative humidity mean average values indoors ranged from 47.56 ± 5.66% to 52.74 ± 3.66%, registered for the week and during class periods only (occupation), 50.98 ± 5.54 % to 54.23 ± 3.94 % respectively (Fig 4.2). According to the University of Aveiro Meteorological station, Aveiro region usually records humidity values between 50 to 80 %.. 30.
(43) Maximum values for relative humidity were recorded for week 2 and week 4 (72 and 79 % respectively). This could be accounted for by the wet and cloudy weather conditions observed during these weeks and minimum values were noted for week 5 and 7 (4.42 and 23 % respectively). Sunny weather conditions could account for these values obtained. Also from week 5, the windows were opened all day to allow for ventilation. The recommended values for temperature in indoor environments for comfort are 20-23 oC during winter and 23-26 oC during summer, and for relative humidity, 30-60 %. The results obtained from this study are consistent with results obtained by Pegas et al (2010) in their study in Lisbon. The values obtained for this study were within the recommended range for indoor environments. Table 4.2 summarizes the temperature and relative humidity values recorded during the sampling time. Table 4.1 Daily weather conditions in Escola de Gloria Monday. Tuesday. sunny. Week 1 Week 2. Wednesday Thursday Friday. rainy. Cloudy. Cloudy and cloudy. and. rainy. sunny. sunny sunny. Week 3 Week 4. Cold and cloudy. cloudy. cloudy. cloudy. sunny. sunny. rainy sunny. Week 5 Week 6. Sunny and cloudy Sunny. Week 7 Week 8 Week 9. sunny. Rainy and cloudy. sunny. Sunny. 31.
(44) Table 4.2 Temperature and Relative humidity values Indoor Temperature(oC). Relative Humidity (%). Average±STDEV. Average±STDEV. W. W. O. O. Week 1. 16.66±1.16 17.31±1.06. 47.56±5.66. 50.98±5.54. Week 2. 17.03±1.29. 17.82±1.25. 61.84±5.20. 65.52±3.61. Week 3. 20.59±0.95. 20.99±0.93. 49.70±6.23. 51.23±7.33. Week 4. 19.50±1.64. 20.23±1.18. 65.03±6.28. 65.47±9.06. Week 5. 23.75±2.74. 24.25±2.95. 44.92±8.65 44.47±10.95. Week 6. 24.41±1.53. 24.72±1.72. 42.25±5.00. 43.61±5.09. Week 7. 22.52±1.16. 22.91±1.26. 50.88±4.42. 52.77±4.49. Week 8. 25.70±0.98. 25.79±1.17. 49.25±7.26. 49.82±8.57. Week 9. 26.29±1.34. 26.36±1.56. 52.74±3.66. 54.23±3.94. W- Week, O-occupation.. 70.00 60.00 50.00 Temp week 40.00. Temp Occupation. 30.00. RH (%) week RH (%) Occupation. 20.00 10.00 0.00 week 1 week 2 week 3 week 4 week 5 week 6 week 7 week 8 week 9. Fig 4.1. Indoor average Temperature and Relative humidity.. 32.
Imagem
+7
Documentos relacionados
In the present study, children from private schools presented higher prevalence of overweight and obesity when compared with children from public schools, according to the
With respect to individual vulnerability, specifically related to knowledge, a study performed with 360 young people in the state public high schools, in the municipality of
In conclusion, the results of this study show that girls enrolled in private schools have higher respiratory muscle strength than girls in public schools. This fact seems to be
Este trabalho foi realizado através de pesquisas em livros das Faculdades Ingá-UNINGÁ, CESUMAR (Centro de Ensino Superior de Maringá) e UEM (Universidade Estadual de
A par de uma vida política particularmente ativa, José Maria ocupar-se-á de múltiplas e diversificadas tarefas de cariz económico, em que sobressaem as ligadas à terra e
On the one hand, a predictive control strategy relies on the initial observations of the ball in order to estimate a ballistic model of its trajectory, allowing the prediction of
- portadores de altas habilidades (superdotados). Durante muito tempo, as pessoas portadoras de deficiência eram ignoradas, renegadas e também sacrificadas. Somente no
LUIZ RICARDO PEREIRA e ERLEI MELO REIS 3 RESUMO No período de 1980 a 1985, foi avaliado, no Centro Nacionai de Pesquisa de Trigo (CNPT), o efeito de alguns sistemas de rotação
