www.atmos-chem-phys.net/11/1083/2011/ doi:10.5194/acp-11-1083-2011
© Author(s) 2011. CC Attribution 3.0 License.
Chemistry
and Physics
A secondary organic aerosol formation model considering successive
oxidation aging and kinetic condensation of organic compounds:
global scale implications
F. Yu
Atmospheric Sciences Research Center, State University of New York, Albany, New York, USA Received: 25 July 2010 – Published in Atmos. Chem. Phys. Discuss.: 23 August 2010
Revised: 20 January 2011 – Accepted: 29 January 2011 – Published: 8 February 2011
Abstract. The widely used two-product secondary organic aerosol (SOA) formation model has been extended in this study to consider the volatility changes of secondary organic gases (SOG) arising from the aging process as well as the kinetic condensation of low volatile SOG (LV-SOG). In ad-dition to semi-volatile SOG (SV-SOG) with saturation vapor pressure at 290 K (C∗
290) in the range of ∼3 ppt–3 ppb and medium-volatile SOG (MV-SOG) withC290∗ in the range of
∼0.3–300 ppb, we add a third component representing LV-SOG withC290∗ below∼3 ppt and design a scheme to trans-fer MV-SOG to SV-SOG and SV-SOG to LV-SOG associated with oxidation aging. This extended SOA formation model has been implemented in a global aerosol model (GEOS-Chem) and the co-condensation of H2SO4and LV-SOG on pre-existing particles is explicitly simulated. We show that, over many parts of the continents, LV-SOG concentrations are generally a factor of∼2–20 higher than those of H2SO4 and the kinetic condensation of LV-SOG significantly en-hances particle growth rates. Comparisons of the simulated and observed evolution of particle size distributions at a bo-real forest site (Hyyti¨al¨a, Finland) clearly show that LV-SOG condensation is critical in order to bring the simula-tions closer to the observasimula-tions. With the new SOA forma-tion scheme, annual mean SOA mass increases by a factor of 2–10 in many parts of the boundary layer and reaches above 0.5 µg m−3in most parts of the main continents, improving the agreement with aerosol mass spectrometer (AMS) SOA measurements. While the new scheme generally decreases the concentration of condensation nuclei larger than 10 nm by 3–30% in the lower boundary layer as a result of enhanced
Correspondence to:F. Yu ([email protected])
surface area and reduced nucleation rates, it substantially in-creases the concentration of cloud condensation nuclei at a water supersaturation ratio of 0.2%, ranging from∼5–20% over a large fraction of oceans and high latitude continents to more than 50% over some parts of South America, Aus-tralia, and Indonesia. Our study highlights the importance for global aerosol models to explicitly account for the oxida-tion aging of SOGs and their contribuoxida-tion to particle growth.
1 Introduction
particulate mass (Zhang et al., 2007) and SOA accounts for a large fraction (∼72±21%) of these OA masses at many locations around the globe (Jimenez et al., 2009). Atmo-spheric chemical transport models have been known to un-derestimate atmospheric OA and SOA mass, in some cases by a factor of 10 or more (Heald et al., 2005; Volkamer et al., 2006). In addition to uncertainties in the emission inventories of SOA precursors and laboratory data of SOA yields, the poor representation of SOA formation in the models could also lead to model under-prediction (Hallquist et al., 2009; Pankow and Barsanti, 2009).
The chemical and physical processes associated with SOA formation are very complex (Kroll and Seinfeld, 2008; Hal-lquist et al., 2009) because of the large amount of different organic compounds involved. Present model predictions of atmospheric SOA formation are largely built upon the theo-retical foundations on organic gas/particle partitioning devel-oped by Pankow in the 1990s (Pankow, 1994) and extended by Odum et al. to SOA formation (Odum et al., 1996). Ac-cording to the theory, partitioning of each semi-volatile com-pound between secondary organic gas (SOG) and aerosol (SOA) phases can be described by an equilibrium partition-ing coefficientKp (m3µg−1), or equivalently (Donahue et al., 2006) its inverse, the effective saturation vapor concen-tration,C∗(µg m−3),
CSOA CSOG=
KpMabsorb= Mabsorb
C∗ (1)
whereCSOAandCSOGare the mass concentration (µg m−3) of certain species in the aerosol and gas phases, respectively. Mabsorb is the mass concentration (µg m−3)of the total ab-sorbing particle phase and refers only to the particulate mat-ter participating in absorptive partitioning.
If the oxidation of a hydrocarbon (HC) leads ton semi-volatile products, Odum et al. (1996) showed that the SOA yieldY, defined as the mass of SOA produced (1MOA)per unit mass of hydrocarbon oxidized (1MHC), can be derived from Eq. (1) and expressed as:
Y=1MOA
1MHC=
n
X
k=1
αkKp,kMabsorb 1+Kp,kMabsorb=
n
X
k=1
αk
1+C∗ k/Mabsorb
(2) whereαk is the mass-based stoichiometric yield of product k, andnis total number of products.
Because of the large number of products formed in a given HC oxidation reaction and the difficulty in measuring indi-vidual semi-volatile compounds, two surrogate products (i.e., n=2) have been widely used to express the volatility distri-bution of the oxidation products (Odum et al., 1996) and are considered as the standard means of representing laboratory SOA yield data in many experimental studies (Seinfeld and Pankow, 2003). The two-product (2p) model of SOA forma-tion (i.e.,n=2 in Eq. 2), when applied to describe SOA for-mation from mixes ofNparent HCs, is referred as theN×2p model (Pankow and Barsanti, 2009). TheN×2p SOA for-mation model has been employed in a number of regional and
global models such as CMAQ (Carlton et al., 2010), CMAQ-MADRID (Zhang et al., 2004), GEOS-Chem (Chung and Se-infeld, 2002; Liao et al., 2007); GISS GCM II-prime (Chung and Seinfeld, 2002), and TM-3 with CBM-4 (Tsigaridis and Kanakidou, 2003).
It should be noted that the above describedN×2p SOA formation model has been derived based on laboratory mea-surements which generally last for several hours. As a result, theN×2p SOA formation model does not take into account the SOG aging process which has been observed in the at-mosphere and in the laboratory for the time beyond several hours of reactions (Donahue et al., 2006; Rudich et al., 2007; Kroll and Seinfeld, 2008; Hallquist et al., 2009; Jimenez et al., 2009). It has been found in these recent investigations that OA and OA precursor gases become increasingly oxi-dized, less volatile, and more hygroscopic as a result of con-tinuous aging in the atmosphere (e.g., Jimenez et al., 2009). Kroll and Seinfeld (2008) pointed out that, in order to gain a quantitative and predictive understanding of SOA formation, the volatility changes arising from the aging process must be parameterized and included in models.
The traditional equilibrium partitioning-based N×2p model does not model the kinetic growth of particles by con-densation, which is a kinetic rather than an equilibrium pro-cess. The equilibrium approach assumes that the secondary organics in the particle phase and gas phase are always in instantaneous equilibrium which is a good approximation for organics with relatively high saturation vapor pressure. Based on equilibrium, the gas concentrations of low volatile species (such as H2SO4and well aged SOGs with very low C∗) are very low. In the real atmosphere, it takes time for
low volatile condensable vapors produced in-situ to get into particles (i.e., diffusion limited) and thus substantial concen-trations of low volatile condensable species can build up in the atmosphere. As mentioned earlier, field measurements indicate that the growth rates of nucleated particles are com-monly a factor of∼2–20 higher than can be explained by the H2SO4vapor condensation alone, likely a result of SOA condensation (e.g., Kuang et al., 2010). Since the particle growth rates are essential to properly account for the con-tribution of nucleated particles to CCN and thus accurately predict the CCN concentrations, it is critical to understand the spatial-temporal variations of the concentrations of con-densable SOGs and properly represent their contribution to secondary particle growth in the aerosol models. In addi-tion, to explicitly resolve the growth of nucleated particles through the condensation (not partitioning) of aged SOGs is important in the sense that the condensation of low-volatile SOGs can enable additional more volatile organics to be up-taken through partitioning which further grow the secondary particles (Pankow and Barsanti, 2009).
the Multiphase Partitioning of Organics (CACM-MPMPO) considers more detailed information of semi-volatile organic compounds, and simultaneously treats the absorption of SOA into existing aerosol organic mass and dissolution of SOA into aerosol-phase water (Pun et al., 2002; Griffin et al., 2002, 2003). The semi-implicit CACM-MPMPO has been incorporated into the Community Multiscale Air Quality (CMAQ) model (Chen et al., 2006). Explicit models with de-tailed gas-phase oxidation schemes (thousands of reactions), based on Master Chemical Mechanism (Jenkin et al., 2004; Johnson et al., 2004, 2006) or NCAR Self-Generating Mech-anism (Aumont et al., 2005; Camredon et al., 2007) have also been developed to predict SOA mass and speciation on the basis of first principles. These semi-implicit and fully explicit schemes can take into account multiple generations of oxidation and the volatility changes associated with oxi-dation aging. By separating organic aerosol and vapor mass into multiple logarithmically spaced saturation concentration bins, Donahue et al. (2006) developed a volatility basis set (VBS) approach to account for the wide range of organic compounds in the atmosphere and the ongoing oxidation of semi-volatile organics in both the gas and particle phases. In terms of the level of the complexity, the VBS approach lies between the computationally simple empiricalN×2p model and the detailed explicit models. More recently, Pankow and Barsanti (2009) proposed to use a carbon number (nC) vs. polarity grid (with concentration bins) for tracking the vari-ous OA-relevant compounds and their time dependent con-centrations. The carbon number-polarity grid is aimed to en-hance the complexity of theN×2p approach by adding more products and to reduce the complexity of molecular kinetic models by using a set of chemical characteristics to lump products.
SOA formation models of different complexity have their own advantages and disadvantages. For 3-D application, one needs to balance the computational cost and the level of com-plexity. The current version of GEOS-Chem, which is a global 3-D chemical transport model developed and used by many research groups around the world to address a wide range of atmospheric composition problems, employs the simple but computationally efficient N×2p model to sim-ulate SOA formation (Chung and Seinfeld, 2002; Liao et al., 2007; Henze et al., 2008; Pye and Seinfeld, 2010). The main objectives of the present study are: (1) to extend theN×2p SOA formation model in GEOS-Chem to account for suc-cessive oxidation aging of SOGs and to represent the kinetic condensation of low-volatile SOGs on atmospheric particles (referred to as “N×2p + A/C” model), without adding sub-stantially to the computational burden of the model; (2) to investigate the impacts of the new scheme on simulated par-ticle properties and global scale implications.
2 SOA formation model considering successive oxidation aging and kinetic condensation (N×2p + A/C)
In GEOS-Chem v8-2-3 on which this study is based, reactive biogenic volatile organic compounds (VOCs) are grouped into six categories (VOCi,i=1–6), with VOC1=α-pinene +β-pinene + sabinene + careen + terpenoid ketones; VOC2= limonene; VOC3=α-terpinene +γ-terpinene + terpinolene; VOC4= myrcene + terpenoid alcohols + ocimene; VOC5= sesquiterpenes; and VOC6 = isoprene. Grouping is based on rate constants and aerosol yield parameters determined from laboratory chamber studies (Griffin et al., 1999; Se-infeld and Pankow, 2003; Henze and SeSe-infeld, 2006), and schemes used to represent SOA formation from the oxida-tion of these VOCs have been described in Chung and Sein-feld (2002) and Liao et al. (2007). For each of the first four VOC categories (VOC1−4), there are three oxidation prod-ucts, two for combined O3 and OH oxidation and one for NO3 oxidation. There are only two products for sesquiter-penes (i.e., VOC5: one for combined O3and OH oxidation and one for NO3 oxidation) and for isoprene (i.e., VOC6: two for combined O3and OH oxidation and no NO3 oxida-tion). In brief, the oxidation reactions of VOCiwith O3+ OH (OX1)and NO3(OX2)produce 16 groups of SOGs which then lead to the formation of 16 groups of SOAs through equilibrium partitioning (Chung and Seinfeld, 2002; Liao et al., 2007),
VOCi+OX1→αi,1,1SOGi,1,1+αi,1,2SOGi,1,2←→SOAs(3)
VOCi+OX2→αi,2,3SOGi,2,3←→SOAs (4) whereαi,j,k(i=1–6;j=1–2;k=1–3) are the mass-based Stoichiometric yields. i,j,kare the indices for VOCs, oxi-dants, and oxidation products, respectively. Theαi,j,kvalues along with the equilibrium partition coefficientsKi,j,kat ref-erence temperatures (Tref)for each SOGi,j,kcan be found in Griffin et al. (1999) and Kroll et al. (2006).
The fractions of total secondary organic products (SOG + SOA) in gaseous and particulate phase depend on the products’ effective saturation concentrationsC∗ (in µg/m3) which is the inverse ofKi,j,k (Donahue et al., 2006). The temperature dependence of C∗ can be determined by the Clausius-Clapeyron equation:
CT∗=CT∗
ref
Tref T exp
1H
R
1
Tref− 1 T
(5) where1H (in kJ mol−1)is the enthalpy of vaporization and Ris the gas constant.
∼180 kJ mol−1 (e.g., Bilde and Pandis, 2001; Chattopad-hyay and Ziemann, 2005; Offenberg et al., 2006; Don-ahue et al., 2006; Pathak et al., 2007; Stanier et al., 2007; Svendby et al., 2008; Saathoff et al., 2009; Epstein et al., 2010). It has been well recognized that a discrepancy ex-ists in the derived 1H values for complex SOA systems (or lumped organics) and for single component systems (or individual surrogates) (e.g., Offenberg et al., 2006; Don-ahue et al., 2006; Saathoff et al., et al., 2009; Epstein et al., 2010). Offenberg et al. (2006) showed that 1H values for single component organic aerosols generated by nebulization of aqueous solutions are in the range of 13– 140 kJ mol−1but those for photochemically produced SOA (lumped organics) are in the range of 11–44 kJ mol−1, de-pending on types of organics in the solution (13, 27, 65, 89, 112, and 140 kJ mol−1 for glyoxal, methylglyoxal, glu-taric acid, malonic acid, succinic acid, and pimelic acid, re-spectively) or reactant hydrocarbons (33–44 kJ mol−1for α-pinene and 14–18 kJ mol−1for toluene/propene). Based on their analysis of experimental data from a collection of dif-ferent smog chambers, Pathak et al. (2007) derived an ef-fective1H of∼30 kJ mol−1forα-pinene SOA. Svendby et al. (2008) examined a large number of smog chamber exper-iments for monoterpenes (α-pinene andβ-pinene) and aro-matics (toluene and m-xylene) and found that 1H values for relatively volatile SOAs from monoterpene oxidation are in the range of 40–60 kJ mol−1 but can reach 100 kJ mol−1 for low volatile oxidation products. In the work of Svendby et al. (2008), 1H was estimated to be 31 and 48 kJ mol−1 for toluene and m-xylene, respectively. A recent chamber study reported in Saathoff et al. (2009) provides a substan-tial amount of new data on the temperature dependence of aerosol yields from the ozonolysis ofα-pinene and limonene under a wide temperature range (243–313 K). Using a two-product modeling framework, Saathoff et al. (2009) derived 1H values for two more and less volatile product proxies of α-pinene: (24±9) kJ mol−1and (59±8) kJ mol−1, and limonene: (25±12) kJ mol−1and (55±14) kJ mol−1.
Both Svendby et al. (2008) and Saathoff et al. (2009) showed that less volatile components of lumped SOA prod-ucts have a notably high enthalpy of vaporization. Large and oxidized organic compounds generally have lowC∗and high 1Hvalues because of their chemical structure and bonding, and1H appears to correlate well with C∗ (Epstein et al., 2010). Based on published experimental vapor pressure data for over 800 organic compounds, Epstein et al. (2010) de-veloped a semi-empirical correlation between C∗ at 300 K
(C300∗ , in µg m−3)and1H(in kJ mol−1):
1H=129−11log10C300∗ (6)
Equation (9) gives a 1H value of 129 kJ mol−1 for C300∗ =1 µg m−3, with a slope of−11 kJ mol−1per decade and is an update of a similar parameterization given in Don-ahue et al. (2006) which assumed a1Hof 100 kJ mol−1for C300∗ =1 µg m−3, with a slope of−5.8 kJ mol−1per decade
ofC∗
300 change. Equation (6) is derived for simple compo-nent systems and may not be appropriate for lumped organics in the 2p SOA formation model which generally have a lower effective1H(Donahue et al., 2006; Epstein et al., 2010; Pye and Seinfeld, 2010).
Poorly defined1H is a significant source of uncertainty in global modeling of SOA formation (Tsigaridis and Kanaki-dou, 2003). 1H of 156 kJ mol−1 has been assumed in CMAQ version 4.3 (v4.3) through v4.6 but has recently been reduced to 40 kJ mol−1 for all biogenic SOA species in CMAQv4.7 (Carlton et al., 2010). 1H is assumed to be 42 kJ mol−1for all organic species in GEOS-Chem (Chung and Seinfeld, 2002; Henze and Seinfeld, 2006; Pye and Sein-feld, 2010). In these modeling studies,1H was assumed to be same for all organic compounds. In order to take into ac-count the dependence of1HonC∗which has been observed
for both simple component systems (Epstein et al., 2010) and lumped organics in the 2p SOA formation model (Svendby et al. 2008; Saathoff et al. 2009),1His parameterized as the following:
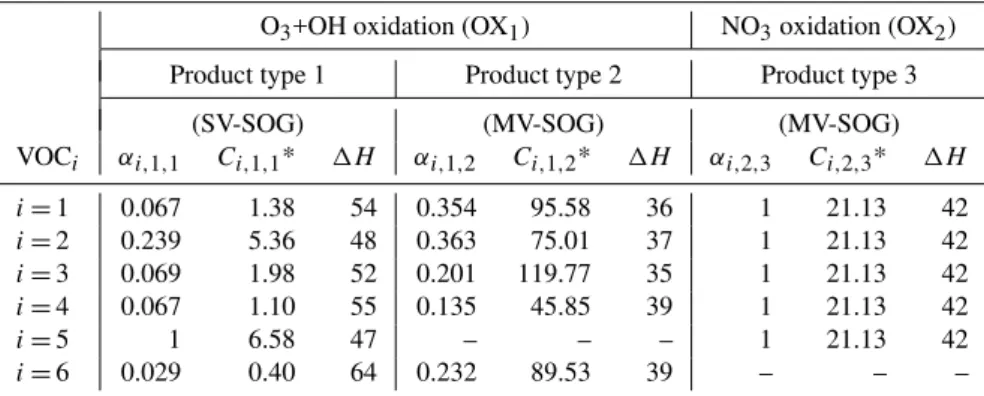
1H=1Href−A(log10C∗−log10Cref∗ ) (7) where 1Href is the reference enthalpy of evaporation at reference C∗ and A=d(1H)/dlog10C∗ is the slope. In the present study, 1Href is assumed to be 40 kJ mol−1 at Cref∗ =100 µg m−3 at data reference temperature (310 K for VOC1−5 and 295 K for VOC6). Based on Epstein et al. (2010), A is chosen to be −11 kJ mol−1 per decade. Table 1 gives αi,j,k value for each SOGi,j,k and their C∗ and1H values atT =290 K. Compared to the uncertainty in 1H, the effect of temperature on 1H is small (Ep-stein et al., 2010) and is not considered here. Based on the parameterization given in Eq. (7), 1H values range from ∼35–42 kJ mol−1 for MV-SOGs to ∼47–64 kJ mol−1 for SV-SOGs, consistent with notably higher1Hvalues for less volatile components of lumped SOA products shown in chamber data (Svendby et al., 2008; Saathoff et al., 2009).
Table 1.Mass-based Stoichiometric yield (αi,j,k)for semi-volatile products (k=1–3) from the oxidation of major types of reactive biogenic volatile organic compounds (VOCi,i=1–6) by different oxidants (j=1, 2), and the effective saturation concentrations (C∗in µg/m3, inverse of equilibrium partition coefficientKi,j,k)and the enthalpy of vaporization (1H, in kJ mol−1)of these products atT=290 K.i,j,kare the indices for VOCs, oxidants, and oxidation products, respectively.αi,j,kvalue along with equilibrium partition coefficientKi,j,kat reference temperature (Tref)for each SOGi,j,kcan be found in Griffin et al. (1999a, b) and Kroll et al. (2006).1H is based on the parameterization given in Eq. (7).
O3+OH oxidation (OX1) NO3oxidation (OX2)
Product type 1 Product type 2 Product type 3
(SV-SOG) (MV-SOG) (MV-SOG)
VOCi αi,1,1 Ci,1,1* 1H αi,1,2 Ci,1,2* 1H αi,2,3 Ci,2,3* 1H
i=1 0.067 1.38 54 0.354 95.58 36 1 21.13 42 i=2 0.239 5.36 48 0.363 75.01 37 1 21.13 42 i=3 0.069 1.98 52 0.201 119.77 35 1 21.13 42 i=4 0.067 1.10 55 0.135 45.85 39 1 21.13 42
i=5 1 6.58 47 – – – 1 21.13 42
i=6 0.029 0.40 64 0.232 89.53 39 – – –
Figure 1 is a schematic illustration of particle formation and growth processes as well as the oxidation aging process considered in the present global size-resolved aerosol simu-lation. H2SO4gas is well recognized to be involved in nu-cleation and also contributes to particle growth through con-densation. NH3and HNO3can be uptaken by sulfate par-ticles through thermodynamic equilibrium and contribute to aerosol growth and mass. Particles of various sizes are gen-erally in equilibrium with H2O vapor and the hygroscopic growth factor depends on particle compositions. We extend the N×2p model by adding a third component represent-ing low-volatile secondary organic gases (LV-SOG) result-ing from oxidation agresult-ing. The saturation vapor pressure of this LV-SOG is in the range of∼0.01–3 ppt and thus is low enough to condense on pre-existing particles. LV-SOG is im-portant for particle growth because it not only directly con-tributes to the condensation growth but also acts as an ab-sorbing mass and enables the particles to uptake SV-SOG and MV-SOG via absorptive partition. The saturation vapor pressures of SV-SOG and MV-SOG are typically in the range of 3 ppt–3 ppb and 0.3 ppb–300 ppb, respectively.
The saturation vapor pressure of sulfuric acid gas over the flat surface of a H2SO4-H2O binary solution at T =290 K and RH=50% is ∼0.001 ppt. It is clear that CH∗
2SO4<
CLV∗ −SOG< C∗SV−SOG< CMV∗ −SOG. H2SO4saturation vapor pressure is low enough to enable it to be involved in the nu-cleation process. LV-SOG generally has a substantial contri-bution to the growth of nucleated particles larger than∼3 nm, but their contribution to the growth of sub-3 nm particles is likely limited as a result of the Kelvin effect (Yu and Turco, 2008; Wang et al., 2010). LV-SOA on secondary particles resulting from the condensation of LV-SOG serves as the ab-sorbing mass (Mabsorb)and allow SV-SOGs and MV-SOGs to be uptaken through partitioning which further grow the secondary particles.
Fig. 1. Schematic illustration of particle formation and growth as well as oxidation aging processes in the atmosphere. See text for details.
The equations governing the changes of LV-, SV-, and MV-SOG concentrations (CLV−SOG, CSV−SOG, CMV−SOG) at a given grid box associated with chemical and microphys-ical processes are,
dCMV−SOG/dt=PVOC−Kag[OH]ξMV−>SV
CMV−SOG−Lpar (8)
dCSV−SOG/dt=PVOC+Kag[OH]ξMV−>SVCMV−SOG
formation model, there are 6 SV-SOGs and 10 MV-SOGs considered (see Table 1). The transfer of mass from MV-SOG to SV-MV-SOG is based on the category of the parent VOCi (i.e, from MV-SOGi,1,2 and MV-SOGi,2,3 to SV-SOGi,1,1, i=1–6). All the oxidation products of SV-SOGs are lumped into one LV-SOG. Following Jimenez et al. (2009), we use a Kagvalue of 3×10⁻¹¹cm3s−1in this study.ξMV−>SVis the fraction of each MV-SOG that can be oxidized to become the corresponding SV-SOG, andξSV−>LVis the fraction of each SV-SOG that can be oxidized to become LV-SOG. It should be noted that transport and deposition of LV-, SV-, and MV-SOGs, which are not included in Eqs. (8–10), are considered in the GEOS-Chem model. In the present study, Eqs. (8–10) are solved by operator splitting (partitioning, then oxidation, and then condensation) while the consumption of OH radi-cals by oxidation aging reactions is ignored. The loss rate to condensation is calculated via condensation growth equation (e.g., Yu, 2006) and to partitioning is based on the scheme described in Chung and Seinfeld (2002).
In the real atmosphere, all SOGs should react but only a fraction of SOGs in the category (MV-SOG, SV-SOG) has saturation vapor pressure lower enough to be moved to the next category (i.e, MV-SOG to SV-SOG, SV-SOG to LV-SOG). The values ofξMV−>SV(orξSV−>LV)depend on the decrease of SOG saturation vapor pressure due to oxidation and the ratios ofCMV∗ toCSV∗ (orCSV∗ toCLV∗ )which differ for different SOGs and vary with temperature. To determine ξMV−>SVandξSV−>LVis a challenging task. In the standard N×2p SOA model and the VBS model, only one mean sat-uration vapor pressure is given for each SOG group/bin. In the real atmosphere, each SOG group/bin may contain hun-dreds of different organic species with saturation vapor pres-sures distributed around the mean value. To account for the spreading of saturation vapor pressures around the averaged values, we represent each SV-SOG or MV-SOG group with a normalized distribution in theN×2p + A/C model,
fSOG(C∗)=
dFSOG(C∗) dlogC∗ =
1
√
2πlogσg
e
(logC∗−logC∗SOG)2
2log2σg
(11)
wheredFSOG(C∗)=fSOG(C∗)×dlogC∗ is the fraction of
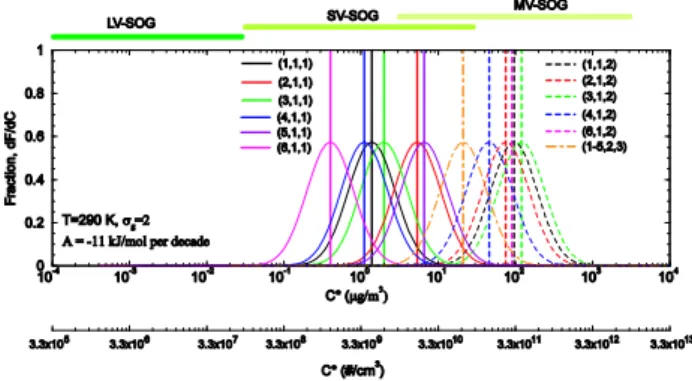
SOG havingC∗withindlogC∗.σgis the geometric standard deviation andC∗SOG is the medianC∗. In this study,σg is assumed to be 2 for baseline case and sensitivity studies for two additionalσg values (1.6 and 2.5) are presented. Log-normal distribution is a logical approach to approximate the spreading ofC∗around the mean value for each SOG group.
The volatility change within each group is taken into account by assuming that the log-normal distribution of each SOG category is always maintained after a faction of the SOG in the left-tail (lowest C∗)of the log-normal distribution has been moved down to the next category. Therefore, the same material will have chance to be moved down after being ox-idized multiple times. This approximation enables us to rep-resent theC∗changes associated with oxidation aging in the
Fig. 2. Normalized distributions (fSOG(C∗), with geometric stan-dard deviationσg=2) of SOGi,j,katT=290 K. The vertical lines are the medianC∗. Second x-axis ofC∗in #/cm3is calculated from C∗in µg/m3based on molecular weight of 181 g/mol. The numbers inside the parenthesis in the figure legend are (i,j,k)of each prod-uct. See text for more information.
global model while keep the computational cost at a reason-able level. Further research is needed to reduce uncertainty associated with this approximation.
Figure 2 shows the normalized distributions (fSOG(C∗)) of various SOGs at T =290 K. The saturation vapor pres-sure ranges of LV-, SV-, and MV-SOGs are also indicated in the figure. One benefit of normalized distribution is that it al-lows the integrated fraction of SOG below certain saturation vapor pressure values to change smoothly with temperature, which should be the case in the real atmosphere. It is clear from Fig. 2 thatCMV∗ /C∗
SV andCSV∗ /CLV∗ vary substantially for different SOGs. To account for the effect of such vari-ations on oxidation aging rates, we parameterizeξMV−>SV andξSV−>LVvalues as,
ξSV−>LV=
Z ϕCLVupp
0
fSV−SOGdlogC (12)
ξMV−>SV=
Z ϕC∗SV
0
fMV−SOGdlogC (13)
described by Pankow and Asher (2008), added -OH func-tionality decreases theC∗of an organic backbone by a factor
of∼102, while added = O functionality decreases C∗ by a
factor of 10. Following the value suggested in Jimenez et al. (2009), we assume that each generation of oxidation by OH adds one oxygen atom and reducesC∗ by 1.5 decades (i.e.,φ=101.5).
TheN×2p + A/C approach presented in this manuscript can be considered as an alternative to the VBS approach (Donahue et al., 2006) to simulate the SOA formation in 3-D models. BothN×2p + A/C and VBS approaches can cover a wide range of organic compounds and their successive ox-idation in the atmosphere. One major difference between the two approaches is that the VBS employs logarithmically spacedC∗“bins” while theN×2p + A/C uses multiple
log-normalC∗ distributions. In the VBS approach, the widely
used N×2p model is completely replaced with a selected number ofC∗“bins” and various smog chamber data of SOA formation have to be re-analyzed to obtain the mass yields of products in eachC∗bin. In theN×2p + A/C approach, the N×2p component (including all experimentally derived key yield parameters, equilibrium partitioning coefficients, etc.) is fully retained and is extended to account for the oxidation aging and kinetic condensation. To our knowledge, the ki-netic condensation of low volatile SOGs is not considered in the present version of VBS model.
3 Global SOA formation and particle growth modeling with GEOS-Chem + APM
The model employed in this study is the GEOS-Chem model with an advanced particle microphysics (APM) model incor-porated (Yu and Luo, 2009). The GEOS-Chem model is a global 3-D model of atmospheric composition driven by as-similated meteorological data from the NASA Goddard Earth Observing System 5 (GEOS-5), has been developed and used by many research groups, and contains a number of state-of-the-art modules treating various chemical and physical pro-cesses (e.g., Bey et al., 2001; Martin et al., 2003; Park et al., 2004; Evans and Jacob, 2005; Liao et al., 2007) with up-to-date key emission inventories (e.g., Guenther et al., 2006; Bond et al., 2007; Zhang et al., 2009). A detailed description of the GEOS-Chem (including various emission sources, chemistry and aerosol schemes) can be found in the model webpage (http://acmg.seas.harvard.edu/geos). The APM model will be incorporated into the standard version of GEOS-Chem in the near future. The details of aerosol repre-sentation and processes in GEOS-Chem + APM can be found in Yu and Luo (2009).
In this work, we implement theN×2p + A/C SOA forma-tion scheme described in Sect. 2 in GEOS-Chem+APM and use the updated model to study the effect of oxidation ag-ing and LV-SOG explicit condensation on simulated particle properties in the global scale. The co-condensation of H2SO4
and LV-SOG on size-resolved secondary particles (repre-sented by 40 bins: 30 bins for dry diameter of 1.2 nm–120 nm and 10 bins for dry diameter of 0.12 µm –12 µm) is explic-itly simulated (Yu and Turco, 2008), along with the scaveng-ing of these precursors by primary particles. To reduce the number of tracers in the model, we lump all LV-SOA on sec-ondary particle (SP) of different sizes into one tracer (SP LV) and redistribute SP LV into different sizes according to SP surface area when needed. Similar to the amount of sulfate coated on various primary particles (Yu and Luo, 2009), we use four additional tracers (dust LV, BC LV, POC LV, and salt LV) to track the amount of LV-SOA coated on various primary particles (i.e., dust, black carbon, primary organic carbon, and sea salt) as a result of condensation and coagu-lation. We assume that LV-SOG has similar deposition and scavenging parameters as H2SO4. The deposition and scav-enging parameters for SP LV, BC LV, POC LV, and salt LV follow those of sulfate in these different types of particles. The deposition and scavenging parameters for SV-SOGs and MV-SOGs follow the original GEOS-Chem scheme for these species (Chung and Seinfeld, 2002; Liao et al., 2007). The implementation of theN×2p + A/C SOA formation scheme adds 6 additional tracers (5 for LV-SOA on different types of particles and 1 for LV-SOG), with a small increase in the computing cost (<5%). The schemes within APM are de-signed with special emphasis on capturing the main proper-ties of atmospheric particles important for their direct and indirect radiative forcing while keeping computational costs low.
The GEOS-Chem v8-01-03 used in Yu and Luo (2009) has been updated to v8-02-03 for the present simulation. All the annual mean results given below are based on simula-tions for year 2005 (2-month spin up time) with a horizontal resolution of 4◦×5◦ and 47 vertical layers up to 0.01 hpa (GEOS-5 meteorological fields). We also run the model at a horizontal resolution of 2◦×2.5◦from 1 March 2005– 31 May 2005 while the output for May 2005 was saved every 30 min for comparisons with size distribution measurements at Hyyti¨al¨a, Findland. New particle formation is calculated based on an ion-mediated nucleation mechanism (Yu, 2010) which is based on state-of-the-art thermodynamic and labo-ratory data (Yu, 2010) and has been validated against well constrained case studies of nucleation events observed in bo-real forests (Yu and Turco, 2008). Previous global model-ing studies indicate that the IMN mechanism appears to rea-sonably account for total number concentrations of particles larger than∼4 nm and∼10 nm observed in different parts of the troposphere (Yu and Luo, 2009, 2010; Yu et al., 2010).
middle and southern Europe, and the eastern United States where anthropogenic SO2 sources are strong. It should be noted that direct emissions or evaporation of low volatile an-thropogenic VOCs and the aging of anan-thropogenic VOCs are not included in the present SOA formation model de-scribed in Sect. 2. There exists evidence that primary an-thropogenic organic compounds can evaporate, age and con-tribute to SOA formation in source regions (Volkamer et al., 2006; Robinson et al., 2007; Henze et al., 2008; Pye and Se-infeld, 2010). Further research is needed to investigate how the processing and oxidation aging of anthropogenic VOCs may affect [LV-SOG] in their source regions. It is clear from Fig. 3 that the high [LV-SOG] is limited to continents and [LV-SOG] over oceans is generally much lower than [H2SO4]. This is a result of the short life of biogenic VOCs and lack of LV-SOG production over oceans. It is noteworthy that a number of recent studies indicate the oceanic sources of isoprene and alpha-pinene (Meskhidze and Nenes, 2006; Roelofs, 2008; Yassaa et al., 2008; Luo and Yu, 2010), which are not included in this study because of the large difference in the source strength estimated from “bottom-up” and “top-down” methods (Arnold et al., 2009; Gantt et al., 2009; Luo and Yu, 2010). Depending on the source strength of oceanic VOC emission, [LV-SOG] over oceans could increase sub-stantially. Further research is needed to characterize the con-tributions of the aging of anthropogenic VOCs and oceanic VOC emissions to the LV-SOG concentration and the associ-ated impact on particle properties.
As pointed out in Sect. 2, the saturation vapor pressure of LV-SOG (∼0.01–3 ppt) is low enough for explicit con-densation. In this study, we assume that LV-SOG has an average saturation vapor pressure of 0.15 ppt (equivalent to
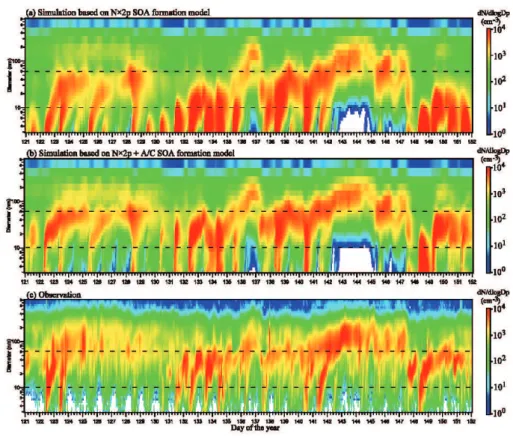
∼5×106cm3) and the co-condensing of H2SO4 and LV-SOG is explicitly resolved in the model. Figure 4 shows the simulated particle size distribution evolution based on the originalN×2p SOA formation model (i.e., no oxidation ag-ing and explicit condensation of LV-SOG) and the extended N×2p + A/C SOA formation model described in Sect. 2 at a boreal forest site (Hyyti¨al¨a, Finland) during May, 2005. For comparison, the observed size distribution evolution for the same location during the same period is also given (data from the CREATE Aerosol Database). The long-term continuous particle size distribution measurements in Hyyti¨al¨a by Kul-mala and colleagues provide excellent data illustrating the formation and growth of atmospheric particles and have been analyzed in a number of previous publications (Laakso et al., 2004; Kulmala et al., 2004; Ehn et al., 2007; Laaksonen et al., 2008). The monthly mean size distributions (of those shown in Fig. 4) along with the size-dependent correlation coefficient (r) and normalized mean bias (NMB) are given in Fig. 5, showing quantitatively the ability of the model in capturing the diurnal variation of particle size distributions during a period of one month and the impact of SOG oxida-tion aging/kinetic condensaoxida-tion.
Fig. 3. Horizontal distributions (averaged over first seven model layers above Earth’s surface: 0–1 km) of annual mean values of (a)H2SO4gas concentration ([H2SO4]), (b)LV-SOG concentra-tion [LV-SOG], and(c)ratio of [LV-SOG] to [H2SO4]. The simu-lation was carried out with GEOS-Chem + APM for year 2005 with a horizontal resolution of 4◦×5◦and 47 vertical layers up to 0.01 hpa (GEOS-5 meteorological fields).
Fig. 4. A comparison of the simulated particle size distribution evolution based on(a)previousN×2p SOA formation model (i.e., no oxidation aging and explicit condensation of LV-SOG) and(b)presentN×2p + A/C SOA formation model described in Sect. 2, with(c) those observed in a boreal forest site (Hyyti¨al¨a, Finland) during May, 2005. The simulations are the results for the surface layer. The observation data are from the CREATE Aerosol Database at NILU and Markku Kulmala is the PI of the data. Further information of the size distribution measurements can be found in Laakso et al. (2004) and Ehn et al. (2007). The horizontal lines at 10 nm and 60 nm are added to guide the visual comparison of particle size distributions.
and generate fewer new particles. This is a result of in-creased particle surface area and reduced [H2SO4] associated with enhanced growth rates. A comparison of Fig. 4b with Fig. 4c shows that the overall agreement between simulated (with LV-SOG condensation) and observed size distributions is reasonable, indicating that theN×2p + A/C SOA forma-tion model may be able to capture some major processes of SOG oxidation aging and particle growth. The model re-produces a large fraction of strong nucleation events (days 122–123, 131–134, 140, 148) and weak or non-nucleation periods (days 124–130, 142–147, 150–152). The weak or non-nucleation periods appear to follow previous strong nu-cleation and growth events, suggesting some kind of particle number self-limiting process in the atmosphere.
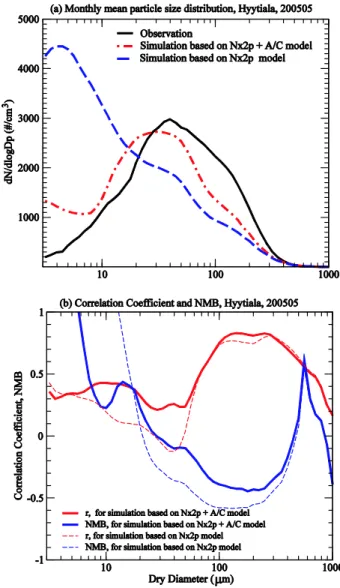
There exist some differences in the simulated and observed nucleation and growth rates on some days (days 125, 128, 135, 138). A comparison of the monthly mean size distribu-tions (Fig. 5) indicates that theN×2p + A/C scheme, while significantly improves the model performance, still under-predicts the number concentrations of particles in the size range of∼40–400 nm by 10–40%. The correlation coeffi-cients (r) given in Fig. 5b show the ability of the model in
capturing the concentration diurnal variations of particles of different sizes.rvalues are high for accumulation mode par-ticles because of relatively small diurnal variations of these particles. TheN×2p + A/C scheme substantially improves the model performance for particles of ∼6–60 nm, with r values above 0.3 for particles <∼25 nm and between 0.2 and 0.3 for particles of∼25–50 nm. The relatively lowerr values for particles of∼25–50 nm combined with the nega-tive NMB values for particles of∼25–300 nm and the posi-tive NMB values for particles of<∼25 nm suggest that the model may still under-predict the growth rate of nucleated particles in this boreal forest site. The differences in the pre-dicted and observed evolution of particle size distributions may also be associated with the coarse model horizontal res-olution (2◦×2.5◦grid box versus a fixed site) and
uncertain-ties in various processes (emissions, meteorology, chemistry, microphysics, cloud processing, etc.).
Fig. 5. (a)Same as Fig. 4 except for the monthly mean particle size distributions,(b)size-dependent correlation coefficient (r) between simulated and observed number concentrations of particles of dif-ferent sizes and the corresponding normalized mean bias (NMB).
consistent with various observations (Kulmala et al., 2004; Kuang et al., 2010), the consideration of LV-SOG condensa-tion is critical and the extended SOA formacondensa-tion model may significantly advance the model’s ability to simulate particle formation and growth in the troposphere.
The effect of theN×2p + A/C scheme on simulated total SOA mass in the boundary layer is given in Fig. 6. For the simulation based on original N×2p model (Fig. 6a), SOA can only form via absorptive partitioning with primary or-ganic carbon (POC) and the annual mean SOA mass is gener-ally<0.3 µg/m3in most parts of the boundary layer except in the eastern United States (0.3–0.7 µg/m3), eastern Asia (0.3– 2 µg/m3), Australia (0.3–0.5), Southern Africa and Southern America (up to 5 µg/m3). With theN×2p + A/C scheme that takes into account SOG oxidation aging and LV-SOG
con-Fig. 6. Horizontal distributions of annual mean SOA mass con-centrations in the boundary layer (0–1 km above surface) simu-lated(a)with originalN×2p SOA formation model,(b)with the N×2p + A/C SOA formation model described in this paper, and(c) percentage increase in SOA mass when SOG oxidation aging and LV-SOG condensation are considered.
densation, annual mean SOA mass in the boundary layer over the whole globe increases significantly, by a factor of 2–10 in many parts of the boundary layer (Fig. 6c). Annual mean SOA mass reaches above 0.5 µg/m3in most parts of the main continents, except in the high latitude Arctic and Antarctic regions (<0.3 µg/m3). The enhancement over the oceans is also significant although the absolute SOA mass is still quite low (<∼0.1 µg/m3).
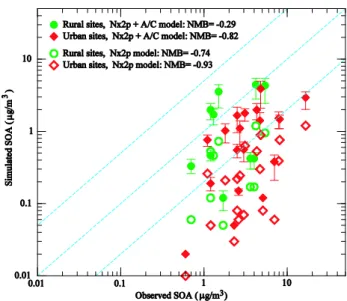
Jimenez et al., 2009 and references therein) with simulated values in the lower boundary layer (0–0.4 km) corresponding to the seasons (spring, summer, fall, or winter, as specified in Jimenez et al., 2009) when the observations were made. We would like to emphasize that the simulated SOA mass con-centrations given in Fig. 7 are seasonally averaged values for year 2005 based on the GEOS-Chem simulation with a hori-zontal resolution of 4◦×5◦while the observed values are av-eraged values during the measurement periods which lasted from 7 days to 127 days and were in different years for differ-ent sites (Jimenez et al., 2009). With these limitations kept in mind, one can conclude from Fig. 7 thatN×2p scheme significantly under-predicts the SOA mass (NMB= −0.74 and−0.93 for rural and urban sites, respectively) and the N×2p + A/C scheme substantially improves the agreement between predicted and observed SOA concentrations (NMB values change from−0.74 to−0.29 for rural sites and−0.93 to−0.82 for urban sites). The low horizontal resolution of the model simulations is likely to contribute to a large frac-tion of the deviafrac-tions shown in Fig. 7, especially for those sites in the urban areas and elevated mountains. Some of the deviations can be attributed to the uncertainties in the SOA formation models, which can be seen from the vertical bars overlapped on filled symbols which present the simulated SOA mass concentrations whenσgvalue is changed from 2.0 (baseline value, filled symbols) to 1.6 (lower end) and to 2.5 (upper end). It should be noted that recent efforts to improve the SOA formation treatment in GEOS-Chem by adding aro-matic species toluene, xylene, and, benzene (Henze et al., 2008) and emissions of semivolatile and intermediate volatil-ity organic compounds (Pye and Seinfeld, 2010) are not in-corporated in the present version of GEOS-Chem. These ad-ditional SOA formation pathways may account for some of the model under-predictions, especially in the source regions of these species. Further detailed comparisons of simulated SOA mass (at higher horizontal model resolution and during the specific periods of various observations, and with addi-tional SOA formation pathways included) with AMS obser-vations are needed to assess more confidently the ability of the model in capturing the SOA formation in various regions during different seasons.
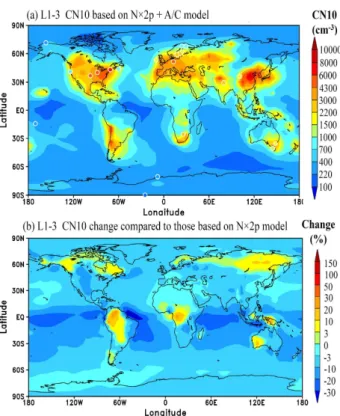
Figure 8a shows the horizontal distributions of annual mean number concentrations of condensation nuclei larger than 10 nm (CN10) in the lower boundary layer (0–0.4 km) simulated with the new SOA formation model described in this paper. Overlaid on Fig. 8a for comparison (symbols) are the annual or multiple-year averaged CN10 values ob-served at 21 surface sites around the globe, with a more spe-cific comparison of simulated CN10 with observed values given in Fig. 9. The sources of CN10 data include CREATE Aerosol Database at NILU (tarantula.nilu.no/projects/ccc/ create/index.htm), World Data Centre for Aerosols (wdca.jrc. ec.europa.eu), NOAA ESRL/GMD Aerosol Database (www. cmdl.noaa.gov/aero), Dal Maso et al. (2008), Ziemba et al. (2006), Laakso et al. (2008), Suni et al. (2008), Venzac et
Figure 7
Fig. 7. Comparison of seasonally averaged SOA mass concentra-tions observed at 25 sites around the globe (Jimenez et al., 2009 and references therein) with those in the lower boundary layer (0– 0.4 km) simulated withN×2p (unfilled symbols) andN×2p + A/C (filled symbols) SOA formation models. The vertical bars over-lapped on filled symbols present the simulated SOA mass concen-trations when the value of geometric standard deviation (σg)in log-normalC∗distribution (Eq. 11) is changed from 2.0 (baseline value, filled symbols) to 1.6 (lower end) and to 2.5 (upper end). The solid line shows a 1:1 ratio, and the dashed lines show ratios of 5:1 and 1:5.
al. (2008), Komppula et al. (2009), and Kivek¨as et al. (2009). More details of these data can be found in Yu and Luo (2009). The impact of including LV-SOG condensation on the annual mean CN10 in the lower boundary layer (0–0.4 km) is pre-sented in Fig. 8b. Enhanced growth rate associated with LV-SOG condensation has two effects on CN10: (1) it increases the fraction of nucleated particles growing beyond 10 nm; (2) it increases the surface area of particles (or condensa-tion sink) which leads to a reduccondensa-tion in [H2SO4] and nucle-ation rates. Our simulnucle-ations indicate that, in most parts of the lower boundary layer, the second effect exceeds the first effect and the inclusion of LV-SOG condensation decreases CN10 by 3–30% (Fig. 8b). In terms of comparison with ob-served CN10 values, the inclusion of LV-SOG condensation slightly increases the normalized mean error (NME) (from 0.3 to 0.32) and absolute value of NMB (from −0.055 to
−0.116). Both cases (with and without LV-SOG condensa-tion) appear to capture the annual mean CN10 values within a factor of∼2. The results presented in Figs. 4 and 8 high-light the necessity to use aerosol measurements in addition to CN10 data (such as size distributions, etc.) to validate global aerosol models.
Fig. 8. (a)Horizontal distributions of annual mean number con-centrations of condensation nuclei larger than 10 nm (CN10) in the lower boundary layer (0–0.4 km) simulated with theN×2p + A/C model described in this paper. The observed annual or multiple year averaged CN10 values from 21 sites are also overlapped on the plots for comparison. See text for the sources of the data.(b)Percentage change in CN10 compared to the case without oxidation aging and LV-SOG condensation (i.e., originalN×2p model).
layers) for the case with LV-SOG condensation, and percent-age changes in CCN0.2 when compared to the case with-out SOG oxidation aging and LV-SOG condensation. In our model we calculate CCN concentrations at a given su-persaturation from the simulated particle size distributions and compositions, using the scheme of Petters and Kreiden-weis (2007). As can be seen from Fig. 10a, annual mean CCN0.2 values in the lower troposphere over major conti-nents generally exceed∼200 cm−3with the highest values reaching above 1000 cm−3, while those over oceans are gen-erally below 100 cm−3with the lowest values dipping under 40 cm−3. It is clear from Fig. 10b that SOG oxidation ag-ing and LV-SOG condensation substantially increases annual mean CCN0.2 values in most parts of the lower troposphere, ranging from 5–20% over a large fraction of oceans and high latitude continents to more than 50% over some parts of South America, Australia, and Indonesia. The enhancement is relatively lower over southern oceans and over northern pacific. Over the major continents, the enhancement is rel-atively low (<∼10%) in the regions of high CCN0.2 values
Fig. 9.Comparison of annually averaged number concentrations of CN10 observed at 21 sites shown in Fig. 8a with those simulated withN×2p andN×2p + A/C SOA formation models. The solid line shows a 1:1 ratio, and the dashed lines show ratios of 2:1 and 1:2.
(>∼450 cm−3)such as the Eastern United States, Eastern Asian, and Europe. The regions of the highest CCN0.2 en-hancement (>50%) include Northwest America, Indonesia, Australia, Southern Africa and America and their associated outflows, where the CCN0.2 values are in the range of sev-eral tens to sevsev-eral hundreds per cm3. We also see a slight decrease (<∼5%) of CCN0.2 in the Middle East and North-ern Africa, most likely a result of the reduction of secondary particles transported to these regions (Fig. 8) and the absence of LV-SOG in the area (Fig. 3).
CCN concentrations are well known to be important for aerosol indirect radiative forcing. Based on the relation-ship between cloud albedo (A) and CCN concentration (N) given in Platnick and Twomey (1994) (1A/A=(1−A)/3× 1N/N), a 10% increase in CCN concentrations can lead to
Fig. 10. (a)Horizontal distributions of annual mean number con-centrations of cloud condensation nuclei at a water supersaturation ratio of 0.2% (CCN0.2) in the lower troposphere (0–2 km above sur-face) simulated with theN×2p + A/C new SOA formation model described in this paper.(b)Percentage change in CCN0.2 compared to the case without oxidation aging and LV-SOG condensation (i.e., originalN×2p model).
4 Summary and discussion
The contribution of secondary organic aerosol (SOA) to par-ticle growth, size, and mass is one of the major uncertain-ties in current regional and global aerosol simulations. The volatility changes of secondary organic gases (SOGs) aris-ing from the agaris-ing process as well as the contribution of low volatile SOGs to the condensational growth of secondary particles have been found to be important in recent labora-tory and field measurements but are poorly represented in global aerosol models. In this study, we extend the widely used N×2p SOA formation model so that it can consider the aging process as well as the kinetic condensation of low-volatile SOGs (i.e.,N×2p + A/C). According to their effec-tive saturation vapor pressure, we group SOGs from bio-genic VOC oxidation into two classes: semi-volatile SOG (SV-SOG) and medium-volatile SOG (MV-SOG). There-after, we extend theN×2p model by adding a third com-ponent representing low-volatile SOG (LV-SOG) and design a scheme to transfer MV-SOG to SV-SOG and SV-SOG to LV-SOG as a result of oxidation aging. The saturation
va-por pressure of this LV-SOG is in the range of∼0.01–3 ppt and is low enough to enable it to directly condense on pre-existing particles. The extended SOA formation model has been implemented in a recently developed size-resolved (sec-tional) global aerosol model GEOS-Chem + APM. The con-centration of LV-SOG ([LV-SOG]) is predicted and the co-condensation of H2SO4 and LV-SOG on size-resolved sec-ondary particles is explicitly simulated, along with the scav-enging of these precursors by primary particles.
Our simulations indicate that [LV-SOG] is generally a fac-tor of∼2–20 higher than [H2SO4] over many parts of the continents and significantly enhance the growth rates of nu-cleated particles. A comparison of the simulated and ob-served evolution of particle size distributions in a boreal forest site (Hyyti¨al¨a, Finland) clearly shows that the con-densation of oxidation aging and LV-SOG is important to bring the simulations close to the observations. With the N×2p + A/C SOA formation scheme, annual mean SOA mass in the boundary layer over the whole globe increases significantly (by a fact of 2–10 in many parts of the bound-ary layer) and reaches above 0.5 µg/m3in most parts of the main continents. A comparison of simulated SOA mass concentrations with AMS measurements obtained at a num-ber of urban and rural sites indicates that theN×2p + A/C scheme substantially improves the agreement between sim-ulated and observed values. We also find that LV-SOG con-densation increases particle surface area, reduces [H2SO4], and thus decreases the formation rates of new particles. As a result, the concentration of condensation nuclei larger than 10 nm (CN10) decreases by 3–30% in most parts of the lower boundary layer when LV-SOG condensation is included. A comparison of simulated annual mean CN10 values with the annual or multiple-year averaged CN10 values observed in 21 surface sites around the globe indicates that bothN×2p andN×2p + A/C schemes appear to be able to capture the observed annual mean CN10 values within a factor of∼2. SOG oxidation aging and LV-SOG condensation substan-tially increase CCN0.2 values in many parts of the lower troposphere, which is significant enough to have important impact on aerosol indirect radiative forcing.
Acknowledgements. The author thanks Gan Luo (University at Albany) for assistance in running the GEOS-Chem model. The GEOS-Chem model is managed by the Atmospheric Chemistry Modeling Group at Harvard University with support from the NASA Atmospheric Chemistry Modeling and Analysis Program. The author thanks Markku Kulmala (University of Helsinki) for making their particle size distribution data available via CREATE Aerosol Database at NILU. This study is supported by NASA under grant NNX08AK48G and NSF under grant 0942106.
Edited by: J. H. Seinfeld
References
Arnold, S. R., Spracklen, D. V., Williams, J., Yassaa, N., Sciare, J., Bonsang, B., Gros, V., Peeken, I., Lewis, A. C., Alvain, S., and Moulin, C.: Evaluation of the global oceanic isoprene source and its impacts on marine organic carbon aerosol, Atmos. Chem. Phys., 9, 1253–1262, doi:10.5194/acp-9-1253-2009, 2009. Aumont, B., Szopa, S., and Madronich, S.: Modelling the evolution
of organic carbon during its gas-phase tropospheric oxidation: development of an explicit model based on a self generating ap-proach, Atmos. Chem. Phys., 5, 2497–2517, doi:10.5194/acp-5-2497-2005, 2005.
Bey, I., Jacob, D., Yantosca, R., Logan, J., Field, B., Fiore, A., Li, Q., Liu, H., Mickley, L., and Schultz, M.: Global modeling of tropospheric chemistry with assimilated meteorology: Model description and evaluation, J. Geophys. Res., 106, 23073–23096, 2001.
Bilde, M. and Pandis, S. N.: Evaporation rates and vapor pressures of individual aerosol species formed in the atmospheric oxida-tion ofα- andβ-pinene, Environ. Sci. Technol., 35, 3344–3349, 2001.
Bond, T. C., Bhardwaj, E., Dong, R., Jogani, R., Jung, S., Ro-den, C., Streets, D. G., and Trautmann, N. M.: Historical emis-sions of black and organic carbon aerosol from energy related combustion, 1850-2000, Global Biogeochem. Cy., 21, GB2018, doi:10.1029/2006GB002840, 2007.
Camredon, M., Aumont, B., Lee-Taylor, J., and Madronich, S.: The SOA/VOC/NOxsystem: an explicit model of secondary or-ganic aerosol formation, Atmos. Chem. Phys., 7, 5599–5610, doi:10.5194/acp-7-5599-2007, 2007.
Carlton, A. G., Bhave, P. V., Napelenok, S. L., Edney, E. O., Sarwar, G., Pinder, R. W., Pouliot, G. A., and Houyoux, M.: Model rep-resentation of secondary organic aerosol in CMAQv4.7, Environ. Sci. Technol., 44(22), 8553–8560, 2010.
Chattopadhyay, S. and Ziemann, P. J.: Vapor Pressures of Unsub-stituted and SubUnsub-stituted Monocarboxylic and Dicarboxylic Acids Measured Using an Improved Thermal Desorption Particle Beam Mass Spectrometry Method, Aerosol Sci. Technol., 39, 1085– 1100, 2005.
Chen, J., Mao, H. T., Talbot, R. W., and Griffin, R. J.: Application of the CACM and MPMPO modules using the CMAQ model for the eastern United States, J. Geophys. Res., 111, D23S25, doi:10.1029/2006JD007603, 2006.
Chung, S. H. and Seinfeld, J. H.: Global distribution and climate forcing of carbonaceous aerosols, J. Geophys. Res., 107, 4407, doi:10.1029/2001JD001397, 2002.
Dal Maso, M., Hyv¨arinen, A., Komppula, M., Tunved, P., Kermi-nen, V. M., LihavaiKermi-nen, H., ViisaKermi-nen, Y., Hansson, H. C., and Kulmala, M.: Annual and interannual variation in boreal forest aerosol particle number and volume concentration and their con-nection to particle formation, Tellus, 60B, 495–508, 2008. Donahue, N. M., Robinson, A. L., Stanier, C. O., and Pandis,
S. N.: Coupled partitioning, dilution, and chemical aging of semivolatile organics, Environ. Sci. Technol., 40, 2635–2643, 2006.
Ehn, M., Pet¨aj¨a, T., Aufmhoff, H., Aalto, P., Hmeri, K., Arnold, F., Laaksonen, A., and Kulmala, M.: Hygroscopic properties of ultrafine aerosol particles in the boreal forest: diurnal variation, solubility and the influence of sulfuric acid, Atmos. Chem. Phys., 7, 211–222, doi:10.5194/acp-7-211-2007, 2007.
Epstein, S., Riipinen, I., and Donahue, A. M.: A semiempirical cor-relation between enthalpy of vaporization and saturation concen-tration for organic aerosol, Environ. Sci. Technol., 44, 743–748, 2010.
Evans, M. J. and Jacob, D. J.: Impact of new laboratory studies of N2O5hydrolysis on global model budgets of tropospheric nitro-gen oxides, ozone, and OH, Geophys. Res. Lett., 32, L09813, doi:10.1029/2005GL022469, 2005.
Gantt, B., Meskhidze, N., and Kamykowski, D.: A new physically-based quantification of marine isoprene and primary organic aerosol emissions, Atmos. Chem. Phys., 9, 4915–4927, doi:10.5194/acp-9-4915-2009, 2009.
Griffin, R. J., Cocker III, D. R., Flagan, R. C., and Seinfeld, J. H.: Organic aerosol formation from the oxidation of biogenic hydro-carbons, J. Geophys. Res., 104, 3555–3567, 1999.
Griffin, R. J., Dabdub, D., and Seinfeld, J. H.: Secondary or-ganic aerosol. I. Atmospheric chemical mechanism for produc-tion of molecular constituents, J. Geophys. Res., 107, 4332, doi:10.1029/2001JD000541, 2002.
Griffin, R. J., Nguyen, K., Dabdub, D., and Seinfeld, J. H.: A cou-pled hydrophobic-hydrophilic model for predicting secondary organic aerosol formation, J. Atmos. Chem., 44, 171–190, 2003. Guenther, A., Karl, T., Harley, P., Wiedinmyer, C., Palmer, P. I., and Geron, C.: Estimates of global terrestrial isoprene emissions using MEGAN (Model of Emissions of Gases and Aerosols from Nature), Atmos. Chem. Phys., 6, 3181–3210, doi:10.5194/acp-6-3181-2006, 2006.
Hallquist, M., Wenger, J. C., Baltensperger, U., Rudich, Y., Simp-son, D., Claeys, M., Dommen, J., Donahue, N. M., George, C., Goldstein, A. H., Hamilton, J. F., Herrmann, H., Hoff-mann, T., Iinuma, Y., Jang, M., Jenkin, M. E., Jimenez, J. L., Kiendler-Scharr, A., Maenhaut, W., McFiggans, G., Mentel, Th. F., Monod, A., Pr´evˆot, A. S. H., Seinfeld, J. H., Surratt, J. D., Szmigielski, R., and Wildt, J.: The formation, properties and impact of secondary organic aerosol: current and emerging is-sues, Atmos. Chem. Phys., 9, 5155–5236, doi:10.5194/acp-9-5155-2009, 2009.
Han, Q., Rossow, W. B., Chou, J., and Welch, R. M.: Global survey of the relationships of cloud albedo and liquid water path with droplet size using ISCCP, J. Climate, 11, 1516–1528, 1998. Hartmann, D. L.: Radiative effects of clouds on Earth’s climate,
in: Aerosol-Cloud-Climate Interactions, edited by: Bobbs, P. V., Academic Press, Harcourt Brace & Company, New York, 1993. Heald, C. L., Jacob, D. J., Park, R. J., Russell, L. M.,
A large organic aerosol source in the free troposphere miss-ing from current models, Geophys. Res. Lett., 32, L18809, doi:10.1029/2005GL023831, 2005.
Henze, D. K. and Seinfeld, J. H.: Global secondary organic aerosol from isoprene oxidation, Geophys. Res. Lett., 33, L09812, doi:10.1029/2006GL025976, 2006.
Henze, D. K., Seinfeld, J. H., Ng, N. L., Kroll, J. H., Fu, T.-M., Jacob, D. J., and Heald, C. L.: Global modeling of secondary organic aerosol formation from aromatic hydrocarbons: high-vs. low-yield pathways, Atmos. Chem. Phys., 8, 2405–2420, doi:10.5194/acp-8-2405-2008, 2008.
Jenkin, M. E.: Modelling the formation and composition of sec-ondary organic aerosol fromα- andβ-pinene ozonolysis using MCM v3, Atmos. Chem. Phys., 4, 1741–1757, doi:10.5194/acp-4-1741-2004, 2004.
Jimenez, J. L., Canagaratna, M. R., Donahue, N. M., Prevot, A. S. H., Zhang, Q., Kroll, J. H., DeCarlo, P. F., Allan, J. D., Coe, H., Ng, N. L., Aiken, A. C., Docherty, K. D., Ulbrich, I. M., Grieshop, A. P., Robinson, A. L., Duplissy, J., Smith, J. D., Wilson, K. R., Lanz, V. A., Hueglin, C., Sun, Y. L., Tian, J., Laaksonen, A., Raatikainen, T., Rautiainen, J., Vaattovaara, P., Ehn, M., Kulmala, M., Tomlinson, J. M., Collins, D. R., Cu-bison, M. J., Dunlea, E. J., Huffman, J. A., Onasch, T. B., Al-farra, M. R., Williams, P. I., Bower, K., Kondo, Y., Schnei-der, J., Drewnick, F., Borrmann, S., Weimer, S., Demerjian, K., Salcedo, D., Cottrell, L., Griffin, R., Takami, A., Miyoshi, T., Hatakeyama, S., Shimono, A., Sun, J. Y, Zhang, Y. M., Dzepina, K., Kimmel, J. R., Sueper, D., Jayne, J. T., Herndon, S. C., Trim-born, A. M., Williams, L. R., Wood, E. C., Kolb, C. E., Mid-dlebrook, A. M., Baltensperger, U., and Worsnop, D. R.: Evolu-tion of Organic Aerosols in the Atmosphere, Science, 326, 1525, doi:10.1126/science.1180353, 2009.
Johnson, D., Jenkin, M. E., Wirtz, K., and Martin-Reviejo, M.: Simulating the formation of secondary organic aerosol from pho-tooxidation of toluene, Environ. Chem., 1, 150–165, 2004. Johnson, D., Utembe, S. R., and Jenkin, M. E.: Simulating the
detailed chemical composition of secondary organic aerosol formed on a regional scale during the TORCH 2003 cam-paign in the southern UK, Atmos. Chem. Phys., 6, 419–431, doi:10.5194/acp-6-419-2006, 2006.
Kivek¨as, N., Sun, J., Zhan, M., Kerminen, V.-M., Hyv¨arinen, A., Komppula, M., Viisanen, Y., Hong, N., Zhang, Y., Kulmala, M., Zhang, X.-C., Deli-Geer, and Lihavainen, H.: Long term par-ticle size distribution measurements at Mount Waliguan, a high-altitude site in inland China, Atmos. Chem. Phys., 9, 5461–5474, doi:10.5194/acp-9-5461-2009, 2009.
Komppula, M., Lihavainen, H., Hyv¨arinen, A.-P., Kerminen, V.-M., Panwar, T. S., Sharma, V. P., and Viisanen, Y.: Physical proper-ties of aerosol particles at a Himalayan background site in India, J. Geophys. Res., 114, D12202, doi:10.1029/2008JD011007, 2009.
Kroll, J. H. and Seinfeld, J. H.: Chemistry of secondary organic aerosol: Formation and evolution of low-volatility organics in the atmosphere, Atmos. Environ., 42, 3593–3624, 2008. Kroll, J. H., Ng, N. L., Murphy, S. M., Flagan, R. C., and
Sein-feld, J. H.: Secondary organic aerosol formation from isoprene photooxidation, Environ. Sci. Technol., 40, 1869–1877, 2006. Kuang, C., Riipinen, I., Sihto, S.-L., Kulmala, M., McCormick, A.
V., and McMurry, P. H.: An improved criterion for new particle
formation in diverse atmospheric environments, Atmos. Chem. Phys., 10, 8469–8480, doi:10.5194/acp-10-8469-2010, 2010. Kulmala, M., Vehkam¨aki, H., Pet¨aj¨a, T., Dal Maso, M., Lauri, A.,
Kerminen, V.-M., Birmili, W., and McMurry, P.: Formation and growth rates of ultrafine atmospheric particles: A review of ob-servations, J. Aerosol Sci., 35, 143–176, 2004.
Laakso, L., Anttila, T., Lehtinen, K. E. J., Aalto, P. P., Kulmala, M., H˜orrak, U., Paatero, J., Hanke, M., and Arnold, F.: Kinetic nucleation and ions in boreal forest particle formation events, At-mos. Chem. Phys., 4, 2353–2366, doi:10.5194/acp-4-2353-2004, 2004.
Laakso, L., Laakso, H., Aalto, P. P., Keronen, P., Pet¨aj¨a, T., Nieminen, T., Pohja, T., Siivola, E., Kulmala, M., Kgabi, N., Molefe, M., Mabaso, D., Phalatse, D., Pienaar, K., and Kermi-nen, V.-M.: Basic characteristics of atmospheric particles, trace gases and meteorology in a relatively clean Southern African Savannah environment, Atmos. Chem. Phys., 8, 4823–4839, doi:10.5194/acp-8-4823-2008, 2008.
Laaksonen, A., Kulmala, M., O’Dowd, C. D., Joutsensaari, J., Vaat-tovaara, P., Mikkonen, S., Lehtinen, K. E. J., Sogacheva, L., Dal Maso, M., Aalto, P., Pet¨aj¨a, T., Sogachev, A., Yoon, Y. J., Li-havainen, H., Nilsson, D., Facchini, M. C., Cavalli, F., Fuzzi, S., Hoffmann, T., Arnold, F., Hanke, M., Sellegri, K., Umann, B., Junkermann, W., Coe, H., Allan, J. D., Alfarra, M. R., Worsnop, D. R., Riekkola, M. -L., Hy¨otyl¨ainen, T., and Viisanen, Y.: The role of VOC oxidation products in continental new particle for-mation, Atmos. Chem. Phys., 8, 2657–2665, doi:10.5194/acp-8-2657-2008, 2008.
Liao, H., Henze, D. K., Seinfeld, J. H., Wu, S., and Mickley, L. J.: Biogenic secondary organic aerosol over the United States: Comparison of climatological simulations with observations, J. Geophys. Res., 112, D06201, doi:10.1029/2006JD007813, 2007. Luo, G. and Yu, F.: A numerical evaluation of global oceanic emis-sions ofα-pinene and isoprene, Atmos. Chem. Phys., 10, 2007– 2015, doi:10.5194/acp-10-2007-2010, 2010.
Martin, R. V., Jacob, D. J., Yantosca, R. M., Chin, M., and Ginoux, P.: Global and regional decreases in tropospheric oxidants from photochemical effects of aerosols, J. Geophys. Res., 108, 4097, doi:10.1029/2002JD002622, 2003.
Odum, J. R., Hoffmann, T., Bowman, F., Collins, D., Flagan, R. C., and Seinfeld, J. H.: Gas/particle partitioning and secondary organic aerosol yields, Environ. Sci. Technol., 30, 2580–2585, 1996.
Offenberg, J. H., Kleindienst, T. E., Jaoui, M., Lewandowski, M., and Edney, E. O.: Thermal properties of sec-ondary organic aerosols, Geophys. Res. Lett., 33, L03816, doi:03810.01029/02005GL024623, 2006.
Pankow, J. F.: An absorption model of the gas/aerosol partitioning involved in the formation of secondary organic aerosol, Atmos. Environ., 28(6), 189–193, 1994.
Pankow, J. F. and Asher, W. E.: SIMPOL.1: a simple group contribution method for predicting vapor pressures and en-thalpies of vaporization of multifunctional organic compounds, Atmos. Chem. Phys., 8, 2773–2796, doi:10.5194/acp-8-2773-2008, 2008.
Pathak, R. K., Presto, A. A., Lane, T. E., Stanier, C. O., Donahue, N. M., and Pandis, S. N.: Ozonolysis of a-pinene: parameterization of secondary organic aerosol mass fraction, Atmos. Chem. Phys., 7, 3811–3821, doi:10.5194/acp-7-3811-2007, 2007.
Park, R. J., Jacob, D. J., Field, B. D., Yantosca, R. M., and Chin, M.: Natural and transboundary pollution influ-ences on sulfate-nitrate-ammonium aerosols in the United States: Implications for policy, J. Geophys. Res., 109, D15204, doi:10.1029/2003JD004473, 2004.
Petters, M. D. and Kreidenweis, S. M.: A single parameter repre-sentation of hygroscopic growth and cloud condensation nucleus activity, Atmos. Chem. Phys., 7, 1961–1971, doi:10.5194/acp-7-1961-2007, 2007.
Platnick, S. and Twomey, S.: Determining the susceptibility of cloud albedo to changes in droplet concentration with the ad-vanced very high resolution radiometer, J. Appl. Meteorol., 33, 334–347, 1994.
Pun, B. K., Griffin, R. J., Seigneur, C., and Seinfeld, J. H.: Secondary organic aerosol. II. Thermodynamic model for gas/particle partitioning of molecular constituents, J. Geophys. Res., 107, 4333, doi:10.1029/2001JD000542, 2002.
Pye, H. O. T. and Seinfeld, J. H.: A global perspective on aerosol from low-volatility organic compounds, Atmos. Chem. Phys., 10, 4377–4401, doi:10.5194/acp-10-4377-2010, 2010.
Robinson, A. L., Donahue, N. M., Shrivastava, M. K., Weitkamp, E. A., Sage, A. M., Grieshop, A. P., Lane, T. E., Pierce, J. R., and Pandis, S. N.: Rethinking Organic Aerosols: Semivolatile emissions and photochemical aging, Science, 315, 1259–1262, 2007.
Rudich, Y., Donahue, N. M., and Mentel, T. F.: Aging of organic aerosol: Bridging the gap between laboratory and field studies, Annu. Rev. Phys. Chem., 58, 321–352, 2007.
Saathoff, H., Naumann, K.-H., M¨ohler, O., Jonsson, ˚A. M., Hal-lquist, M., Kiendler-Scharr, A., Mentel, Th. F., Tillmann, R., and Schurath, U.: Temperature dependence of yields of secondary organic aerosols from the ozonolysis ofα-pinene and limonene, Atmos. Chem. Phys., 9, 1551–1577, doi:10.5194/acp-9-1551-2009, 2009.
Seinfeld, J. H. and Pankow, J. F.: Organic atmospheric particulate material, Annu. Rev. Phys. Chem., 54, 121–140, 2003.
Stanier, C. O., Pathak, R. K., and Pandis, S. N.: Measurements of the volatility of aerosols fromα-piniene ozonolysis, Environ. Sci. Technol., 41, 2756–2763, 2007.
Suni, T., Kulmala, M., Hirsikko, A., Bergman, T., Laakso, L., Aalto, P. P., Leuning, R., Cleugh, H., Zegelin, S., Hughes, D., van Gorsel, E., Kitchen, M., Vana, M., H˜orrak, U., Mirme, S., Mirme, A., Sevanto, S., Twining, J., and Tadros, C.: Formation and characteristics of ions and charged aerosol particles in a na-tive Australian Eucalypt forest, Atmos. Chem. Phys., 8, 129–139, doi:10.5194/acp-8-129-2008, 2008.
Svendby, T. M., Lazaridis, M., and Torseth, K.: Temperature de-pendent secondary organic aerosol formation from terpenes and aromatics, J. Atmos. Chem., 59, 25–46, 2008.
Tsigaridis, K. and Kanakidou, M.: Global modelling of secondary organic aerosol in the troposphere: a sensitivity analysis, At-mos. Chem. Phys., 3, 1849–1869, doi:10.5194/acp-3-1849-2003, 2003.
Venzac, H., Sellegri, K., Laj, P., Villani, P., Bonasoni, P., Mari-noni, A., Cristofanelli, P., Calzolari, F., Fuzzi, S., Decesari, S.,
Facchini, M. C., Vuillermoz, E., and Verza, G. P.: High fre-quency new particle formation in the Himalayas, P. Natl. Acad. Sci. USA, 105, 15666–15671, 2008.
Volkamer, R., Jimenez, J. L., Martini, F. S., Dzepina, K., Zhang, Q., Salcedo, D., Molina, L. T., Worsnop, D. R., and Molina, M. J.: Secondary organic aerosol formation from anthropogenic air pollution: Rapid and higher than expected, Geophys. Res. Lett., 33, L17811, doi:10.1029/2006GL026899, 2006.
Wang, L., Khalizov, A. F., Zheng, J., Xu, W., Lal, V., Ma, Y., and Zhang, R.: Atmospheric nanoparticles formed from het-erogeneous reactions of organics, Nature Geosci., 3, 238–242, doi:10.1038/ngeo778, 2010.
Yassaa, N., Peeken, I., Z¨ollner, E., Bluhm, K., Arnold, S., Spracklen, D., and Williams, J.: Evidence for marine production of monoterpenes, Environ. Chem., 5, 391–401, doi:10.1071/EN08047, 2008.
Yu, F.: From molecular clusters to nanoparticles: second-generation ion-mediated nucleation model, Atmos. Chem. Phys., 6, 5193– 5211, doi:10.5194/acp-6-5193-2006, 2006.
Yu, F.: Ion-mediated nucleation in the atmosphere: Key control-ling parameters, implications, and look-up table, J. Geophy. Res., 115, D03206, doi:10.1029/2009JD012630, 2010.
Yu, F. and Luo, G.: Simulation of particle size distribution with a global aerosol model: contribution of nucleation to aerosol and CCN number concentrations, Atmos. Chem. Phys., 9, 7691– 7710, doi:10.5194/acp-9-7691-2009, 2009.
Yu, F. and Luo, G.: Oceanic Dimethyl Sulfide Emission and New Particle Formation around the Coast of Antarctica: A Model-ing Study of Seasonal Variations and Comparison with Measure-ments, Atmosphere, 1, 34–50, doi:10.3390/atmos1010034, 2010. Yu, F. and Turco, R.: Case studies of particle formation events observed in boreal forests: implications for nucleation mecha-nisms, Atmos. Chem. Phys., 8, 6085–6102, doi:10.5194/acp-8-6085-2008, 2008.
Yu, F., Wang, Z., Luo, G., and Turco, R.: Ion-mediated nucle-ation as an important global source of tropospheric aerosols, At-mos. Chem. Phys., 8, 2537–2554, doi:10.5194/acp-8-2537-2008, 2008.
Yu, F., Luo, G., Bates, T., Anderson, B., Clarke, A., Kapustin, V., Yantosca, R., Wang, Y., and Wu, S.: Spatial distributions of par-ticle number concentrations in the global troposphere: Simula-tions, observaSimula-tions, and implications for nucleation mechanisms, J. Geophys. Res., 115, D17205, doi:10.1029/2009JD013473, 2010.
Zhang, Q., Jimenez, J. L., Canagaratna, M. R., Allan, J. D., Coe, H., Ulbrich, I., Alfarra, M. R., Takami, A., Middlebrook, A. M., Sun, Y. L., Dzepina, K., Dunlea, E., Docherty, K., DeCarlo, P. F., Salcedo, D., Onasch, T., Jayne, J. T., Miyoshi, T., Shimono, A., Hatakeyama, S., Takegawa, N., Kondo, Y., Schneider, J., Drewnick, F., Weimer, S., Demerjian, K., Williams, P., Bower, K., Bahreini, R., Cotrell, L., Griffin, R. J., Rautiainen, J., Sun, J. Y., Zhang, Y. M., and Worsnop, D. R.: Ubiquity and dominance of oxygenated species in organic aerosols in anthropogenically-influenced Northern Hemisphere midlatitudes, Geophys. Res. Lett., 34, L13801, doi:10.1029/2007GL029979, 2007.
Phys., 9, 5131–5153, doi:10.5194/acp-9-5131-2009, 2009. Zhang, Y., Pun, B., Vijayaraghavan, K., Wu, S. Y., Seigneur, C.,
Pandis, S. N., Jacobson, M. Z., Nenes, A., and Seinfeld, J. H.: Development and application of the model of aerosol dynam-ics, reaction, ionization, and dissolution (MADRID), J. Geophy. Res., 109, D01202, doi:10.1029/2003JD003501, 2004.
![Fig. 3. Horizontal distributions (averaged over first seven model layers above Earth’s surface: 0–1 km) of annual mean values of (a) H 2 SO 4 gas concentration ([H 2 SO 4 ]), (b) LV-SOG concentra-tion [LV-SOG], and (c) ratio of [LV-SOG] to [H 2 SO 4 ]](https://thumb-eu.123doks.com/thumbv2/123dok_br/18351292.353072/8.892.472.807.96.637/horizontal-distributions-averaged-layers-earth-surface-concentration-concentra.webp)