A Work Project, presented as part of the requirements for the Award of a Masters Degree in Finance from the Faculdade de Economia da Universidade Nova de Lisboa.
The Impact of Email Marketing on Property Availability Update for a Portuguese Startup
GULAM MAHOMED SIDIQUE - 69967
A Project carried out in the Finance course, with the supervision of Professor Carlos Santos
2
Abstract
This paper analyses an email campaign – “availability push” – sent to the supply side of the marketplace: landlords. We find that the delivery of the emails increased the update of the properties’ availability by the landlords by 34,15%, the opening increased by 24,96%, and the click by 18,16%. Overall, 3112 offers were updated with this campaign, out of which 84 were considered as out of platform, representing a gain of 2,7% to the company, just with these offers. This campaign was a huge success for the company, and the findings on this paper tend to analyse what influences this success.
3 Table of Contents INTRODUCTION 4 LITERATURE REVIEW 5 DATA DESCRIPTION 7 PRELIMINARY FINDINGS 10 REGRESSION ANALYSIS 19 CONCLUSION 22 REFERENCES 23 APPENDIX 23
4
Introduction
Throughout a 3-month period, a research was conducted in one of Portugal’s biggest startups: an online platform whose business is a marketplace for landlords and tenants looking for a home in Europe.
The company’s primary source of revenue is the service fee, charged to tenants at the time of the booking; and the commission fee, deducted from the landlord’s first month of rent following a tenant’s move-in. The difference between these two fees is that the one charged to tenants is a one-time service fee, charged at the moment their booking is accepted by the landlord, while the one charged to landlords is a fee that is calculated based on the length of the contract.
One of the biggest problems of this company is to guarantee that landlords have their properties’ availability correctly updated on their listing, meaning whether the available dates that appear on each listed property on the company’s website are, in reality, the dates in which the room/property is vacant and free to be booked. Most of the times, landlords do not update their properties’ availability when the room is booked, and only do so when they are in need of finding a new tenant.
The main topic of this research was to develop an automated email campaign, sent to every landlord who had their properties marked as available from that moment up until the following 45 days, as well as to those who had not updated their properties’ availability in the 30 days prior to the sending of the email, to every city in which the company offers supply.
In the end, we will be facing 4 scenarios:
5
ii) The landlord received the email and did not update the property’s availability
iii) The landlord did not receive the email and updated the property’s availability
iv) The landlord did not receive the email and did not update the property’s availability
After this analysis, several variables related with the offer will be analysed to create the “perfect offer”, meaning an offer that is most likely to have its availability up to date. The variables are: (a) if the landlord has had a booking paid in the past or not; (b) if the landlord is out of platform or not; (c) the rental price of the offer; (d) if the landlord is a resident landlord or not, i.e. the landlord lives in the same property they have listed; (e) if the offer has partial utility bills or not; and (f) if the offer has all utility bills included or not.
Literature Review
There has not been any study that directly analyses this object of study. To simplify, in this paper it is considered that having the availability of the offer updated is similar to having engaged customers (i.e. landlords).
Email marketing is usually used to refer to: sending email messages with the purpose of enhancing the relationship of a merchant with its current or previous customers to encourage customer loyalty and repeat business; or to sending email messages with the purpose of acquiring new customers or convincing current customers to purchase something (RALUCA, 2017).
6
Email marketing is used in order to inform potential customers and current clients by the use of the internet, and it is the most popularly used element of the web (PANTEA and POP, 2010).
One of the many needs of a company is establishing a close relationship with its customers. The establishment and maintenance of this relationship is one of the main activities of an email marketing campaign. Email marketing brings a huge contribution to any company with minimal promotional costs, and it is very easy to use (CAMELIA, 2016).
One of the many implications in email marketing is setting goals and establishing clear objectives. In order words, CRM Managers need to clearly define why an email marketing campaign is being sent, and what is its end goal. In this case, the campaign was sent so that landlords updated the availability on their listings on their own.
The company should also examine the click to open rate from the call-to-action in the email. Having a high open rate does not necessarily mean that the campaign was successful; one should consider the click rate, the outcome, and also the unsubscriptions that resulted from that specific campaign, as this might be harming the relationship of the company with its customers. For instance, the customer might feel that the information they received was not appropriate; they might be tired of receiving emails from the company; they might want to end the relationship with the enterprise; amongst others.
Following this phase, CRM Managers need to efficiently use the company's database to create segmented mailing lists; this way the message being transmitted will be correctly targeted to the recipient. For this research, the following was considered: a) all landlords
7
in the company’s core cities; b) who were not key accounts, i.e. landlords with usually more than 20 offers; c) who had offers available in the following 45 days of the sending of the email; and d) who had not updated offers in the 30 days prior to the email.
After collecting the mailing lists, it is time to create the email, also referred to as the building phase (WATJATRAKUL and DRENNAN, 2005). This function includes composing the email message, defining clear and objective subject lines, having appropriate call-to-actions (customised, if possible), and providing copy that delivers the intended message to the recipient.
As with any other marketing activity - and this one is no exception – email marketing has both advantages and disadvantages.
The main advantages include: i) easy recovery of investment; ii) having accurate statistics to measure the impact of the campaign; iii) being fast and efficient, as it allows a company to reach a broad range of people in a very short time; and iv) it can be customised.
The main disadvantages include: i) risk of the email not reaching its recipient; ii) high rate of unopened emails; iii) losing touch with customers as they might unsubscribe or opt out of receiving future emails; and iv) when sending emails, some of its content might not be displayed to the recipient , i.e. the device on which the recipient is reading the email might not support special features included in the email.
Data Description
In this section, the variables used in the model will be described. Updated – If the landlord updated the availability or not (binary); Delivered – If the email was delivered to the landlord or not (binary);
8
Opened – If the email was opened by the landlord or not (binary);
Clicked – If the landlord clicked on the CTA button on the email or not (binary); BP – If the landlord has had a booking paid or not (binary);
OOP – If the landlord / offer is marked as out of platform or not (binary). Reason for landlords to be marked as OOP in the company’s database are as follows:
i) landlord no longer owns the property; ii) duplicated property; iii) property occupied for a long period; iv) landlord no longer wants to work with the company; v) duplicated landlord; vi) unresponsive landlord; vii) landlord disagrees with business model; viii) landlord disagrees with the commission charged; ix) the account is disabled; x) the landlord has received a significant amount of complaints from tenants; xi) the landlord is unsatisfied with the number of bookings received;
Rent – Rental price of the property (numerical);
LR – If the landlord lives in the property or not (binary);
Partial_bills_included – If the offer has partial utility bills included or not (binary). This means whether the offer has just one or only part of the utilities bills included in the rental price or not;
All_bills_included – If the offer has all utility bills included in the rental price or not (binary).
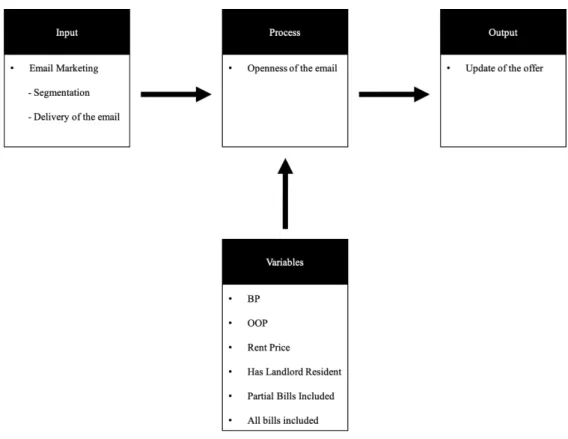
Conceptual Framework
In this stage, we will define the conceptual framework of this study. We will essentially indicate the variables we considered for this research (inputs), what we did with them (process), the variables used, and the end goal (output).
9
Figure 1 - Conceptual Framework
For the segmentation of the mailing list, all the landlords who had their offer available in the 45 days following the date the email was sent, and who did not update its availability in the 30 days prior to the email, were considered.
The goal of this analysis is to understand whether the open rate and the click-through rate of the email received by the landlord motivates them to update the availability on their offers by themselves. The impact of the delivery alone will not be studied, as other variables would need to be analysed, such as the subject line, the pre-header, etc..
Following the research, and whether or not the sending of this email to the mailing list described above impacts the availability on the offer, it will be discussed whether certain characteristics of the landlord and the offer have a significant weight on having its availability updated, having as basis the delivery of the email.
10
• Landlord lives in the property or not;
• Value of the rent of the offer;
• The offer has all utility bills included or not;
• The offer has partial utility bills included or not;
• Number of bookings paid the offer had in the past.
Preliminary Findings
There are almost 52,000 offers in the platform and a sample of more than 20% was observed to test the impact of this campaign.
Figure 2 - Was the email delivered?
From the 10,449 emails delivered to landlords, it is now important to analyse the open rate, and afterwards, the click rate of the emails, seeing as having a high open rate does not necessarily mean that the goal of the campaign was met.
The “delivered”, “opened” and “clicked” variables are subnests, meaning that all “clicked” emails were opened, and all “opened” were delivered. This was sustained with a simple cross tabulation of the three binary variables (Appendix 1).
We can conclude that 58% of the landlords who received the email showed interest in it, seeing as they opened the email, which probably meant that its subject line caught their
0 5000 10000 15000 20000 25000 30000 35000 40000 45000 Yes No
11
attention. The emails were sent in the language spoken in the city where the landlord owns their property, and contained the name of the landlord on it, as the company decided to customise the email to create empathy with the client. Used moderately and adequately, this technique has proven that it can make customers feel more engaged with the company.
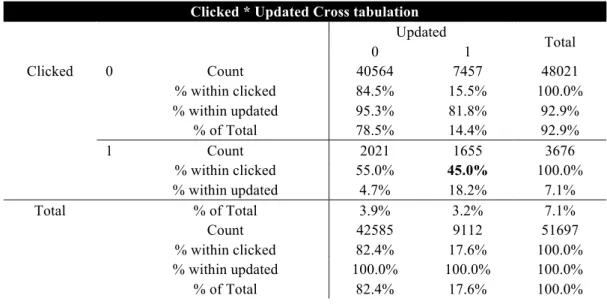
Among landlords who opened the email, more than 60% clicked on a link in the email. From the data given by the CRM platform the company uses, it is not possible to know for sure whether the click was on the CTA1 button or on other parts of the email (footer, logo, unsubscribe button, etc.). In order to have more accurate data, a cross tabulation (see table below) was performed to analyse the percentage of updates that originated from these clicks.
Table 1 - Clicked vs Updated Cross Tabulation
It can be observed that 45% of landlords who clicked on a link in the email finished the process by themselves, meaning that they updated their properties’ availability on their
1 CTA – Call to Action
Clicked * Updated Cross tabulation
Updated Total 0 1 Clicked 0 Count 40564 7457 48021 % within clicked 84.5% 15.5% 100.0% % within updated 95.3% 81.8% 92.9% % of Total 78.5% 14.4% 92.9% 1 Count 2021 1655 3676 % within clicked 55.0% 45.0% 100.0% % within updated 4.7% 18.2% 7.1% Total % of Total 3.9% 3.2% 7.1% Count 42585 9112 51697 % within clicked 82.4% 17.6% 100.0% % within updated 100.0% 100.0% 100.0% % of Total 82.4% 17.6% 100.0%
12
own, and in the table on Appendix 2, we can see that only 1,7% of clicks originated an unsubscription.
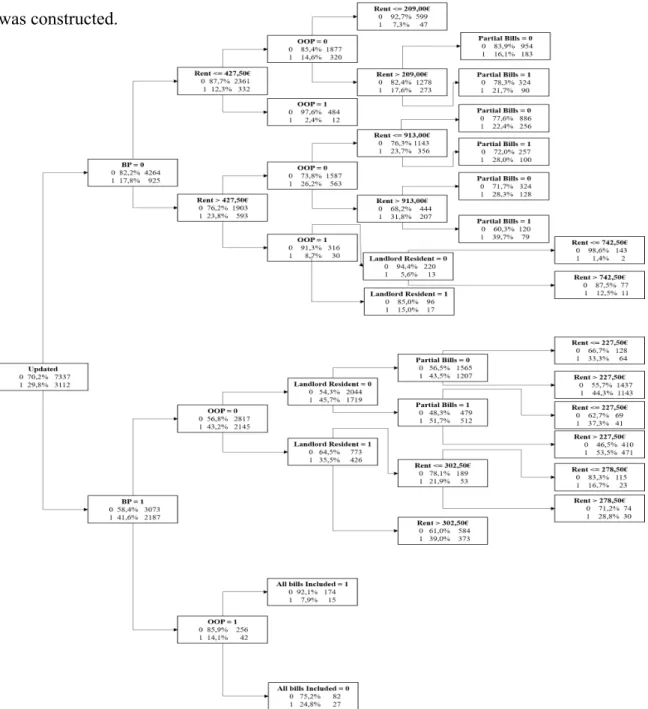
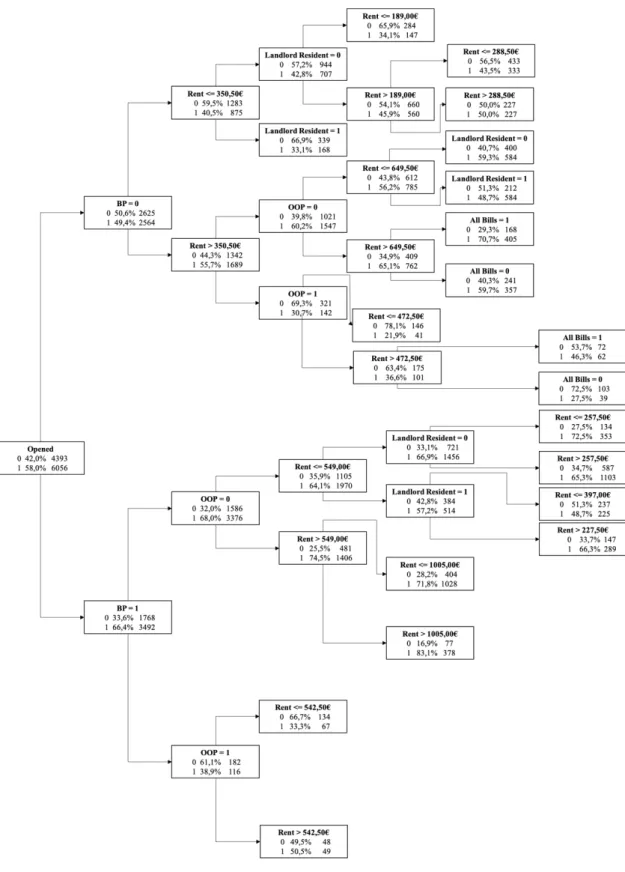
In order to explore our data, we will construct a decision tree, as this is an excellent validation tool for exploratory and confirmatory classification analysis2. As exploratory evidence on which variables should be in the set of mediators, the decision tree3 below
was constructed.
2 Definition taken from the IBM website: goo.gl/9FX9Zk
3 Decision tree constructed using the CRT method, and without cross validation Figure 3 - Decision Tree with Update as the dependent variable
13
Depending on the situation, the variable presented in the next node of the tree varies. The most important variables that were considered were whether the offer had had a booking paid or not, and the second most important variable is dependent on the previous one. For example, for offers who had had at least one booking paid, meaning that the landlord accepted a reservation through the platform in the past, it is crucial to know whether the landlord is still active on the platform or not, rather than the rent price in case they have not had a booking paid, and if they are still in the platform (OOP = 0), there is a 43,2% probability that they update the availability on their offer.
The updates coming from landlords who are out of platform constitute an important managerial implication from this email campaign. Since the company’s database has no segmentation on the reasons4 one is considered as OOP, it is not possible to deepen our research on this topic. However, from the tree it can be concluded that offers that do not have all utility bills included, and landlords who are marked as OOP and have received at least one booking paid in the past, have a 24,8% chance of updating the availability of their property on their own.
Some possible explanations for this to happen are the following: i) the property suddenly became vacant, and it is ready to be booked; ii) the landlord changed his mind and decided to work with the company; iii) The landlord started reacting to the company’s communication, and wants to receive bookings through the platform; amongst others.
Moving on to the overall availability of the offers (Figure 5), since June 2018, only 18% of the offers had their availability updated by the landlords themselves (month in which the internship started); the remaining 82% did not have their availability updated by the
14
3112
7337
Yes No
landlord, which might mean that they opted to call the company in order for an agent to update their offer on their behalf; or it might mean that they simply chose not to update the availability on the offer.
From the figure above, it is possible to conclude that out of 10,449 landlords who were asked to update their properties’ availability, more than 34% chose to do so. This is just based on the delivery of the email. However, the delivery of the email is not enough on its own to justify the availability update, as the landlord has not read anything other than the subject line and the pre-header of the email.
0 5000 10000 15000 20000 25000 30000 35000 40000 45000 Yes No
Figure 5 - Number of updates that the delivery of the email generated Figure 4 - Was the offer updated by the landlord himself after
15
2154
3624
Yes No
The subject line used in the email was the following: “Guarantee the occupation of your property from {month}5, {fname}6!”
If one must consider the opening of the email as the only cause of the availability update, 2154 landlords, out of 5778 who opened the email, updated the availability of their properties on their own (figure 7). With this assumption, it can be argued that a landlord opened the email, ignored it, and only decided to update the availability of their property when needed, for example once a tenant’s rental contract comes to an end.
While our managerial final goal is on “clicking”, the reason the mediator (“opened”) is important is because the landlord has been exposed to the content of the email, and knows that the offer is not up to date, and the chances of having a booking are low in case the availability is not updated.
It is crucial to understand whether what drives “updated” is different from what drives “opened”, since this will inform us about heterogeneous responses to the email
marketing campaign.
5 {month} is a pre-field text on the HTML of the email that inserts the next month’s
name
6 {fname} is a pre-field text on the HTML of the email that inserts the first name of the
landlord
16
To understand whether both of these variables are different or not, a decision tree with the dependent variable “opened” will be analysed (figure below), as this will allow us to explore our data.
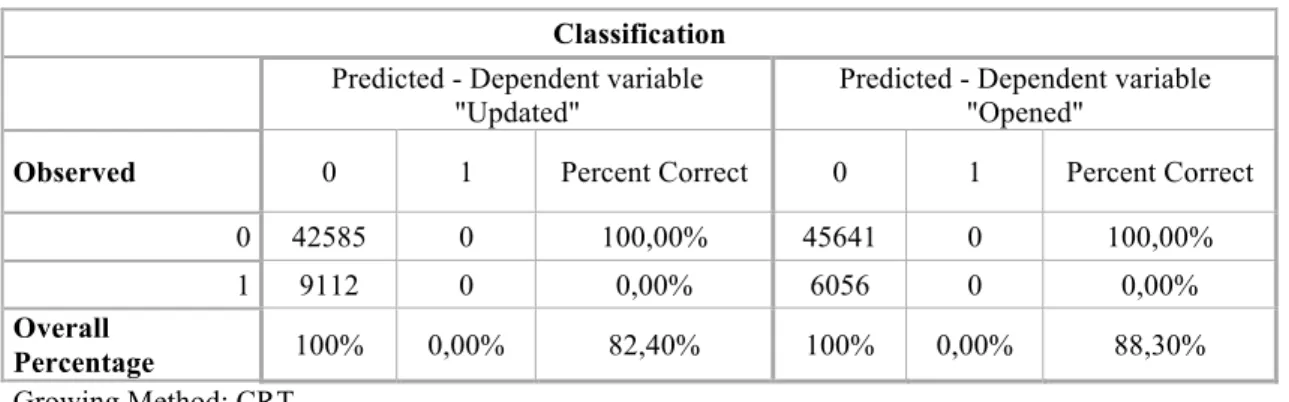
The tree below, with “opened” as the dependent variable, is not the same as the one presented previously, with “updated” as the dependent variable. This confirms that the variables that affect “update” differ from those that affect “opened”. For instance, partial utility bills is no longer a variable on the tree, rather all utility bills included is. The dispersion of the variables on the tree and the probability of each scenario
occurring is significantly different, however the overall classification of both trees do not differ that much, as can be seen in table below.
Classification
Predicted - Dependent variable "Updated"
Predicted - Dependent variable "Opened"
Observed 0 1 Percent Correct 0 1 Percent Correct
0 42585 0 100,00% 45641 0 100,00%
1 9112 0 0,00% 6056 0 0,00%
Overall
Percentage 100% 0,00% 82,40% 100% 0,00% 88,30%
Growing Method: CRT
Table 2 – Overall Classification of the decision tree with “Updated” and “Opened” as dependent variables
Both of these results can be considered accurate, however neither are good enough to form a prediction, since they do not forecast the “1’s”. In order words, these trees better predict what does not affect “update” or “open”, rather than what does affect them.
17
18
1655
1743
Yes No
Considering now whether the landlord clicked on a link in the email or not, 1645 “updated” originated from the landlords who clicked on a link in the email, meaning that almost 50% of clicks originated an update.
These results, however, must be tested if, in the long run, they will have the same outcome. To do so, a linear regression7 was performed (results in the following pages).
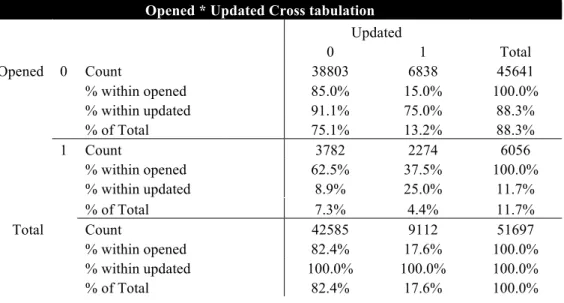
To conclude this section of preliminary findings, the causal effect between “update” and “opened” will be analysed considering the values from the figure below.
Table 3 - Opened vs Updated Cross Tabulation
7 A linear regression was performed because most of our variables are binary, meaning
that they have only two values (1 or 0)
Opened * Updated Cross tabulation
Updated Total 0 1 Opened 0 Count 38803 6838 45641 % within opened 85.0% 15.0% 100.0% % within updated 91.1% 75.0% 88.3% % of Total 75.1% 13.2% 88.3% 1 Count 3782 2274 6056 % within opened 62.5% 37.5% 100.0% % within updated 8.9% 25.0% 11.7% % of Total 7.3% 4.4% 11.7% Total Count 42585 9112 51697 % within opened 82.4% 17.6% 100.0% % within updated 100.0% 100.0% 100.0% % of Total 82.4% 17.6% 100.0%
19
For the computation of the causal effect, the following equation will be estimated: P[Opened \ Update] – P[Opened \ Not Update]. Replacing this with the values from above, it is possible to measure the causal effect by 16,1% (25% - 8,9%). This can be interpreted as having a 16,1% probability of “opened” causing the update of the properties’ availability by the landlord.
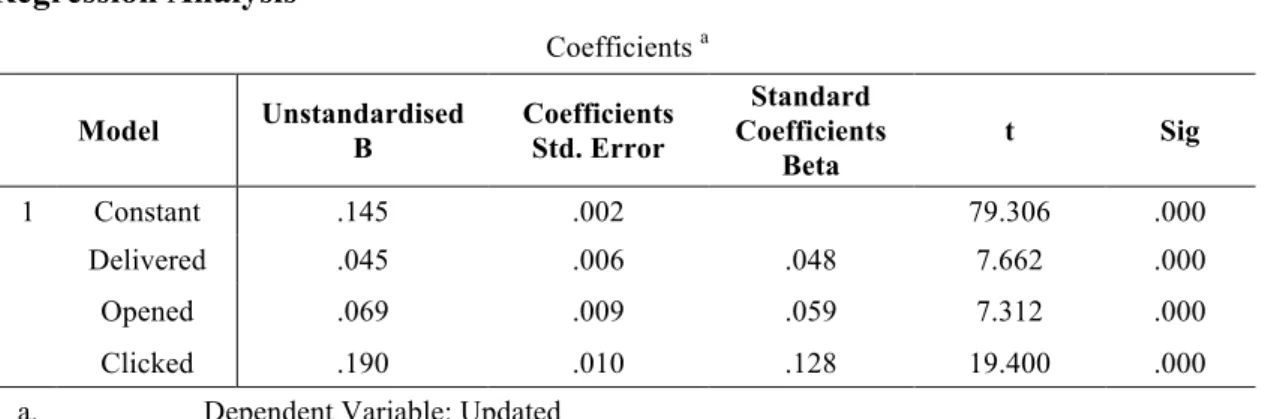
Regression Analysis
As the variables in this analysis are binary, a linear regression was performed to quantify the impact of the email in the availability of the offer. The values of the table above are not the same as the ones given by the computation of the causal effect, but this is normal, as more covariates were added to the analysis.
Analysing the sig value of the ANOVA table (appendix 3), it can be concluded that the model under analysis is significant, as p-value is less than alpha of 0,05. The significance of the model can be reported as the following: F (3, 51693) = 799,100, p = 0.000.
In the table above, we can observe that all our dependent variables are significant at a level of 5%, and that when a landlord clicks on a link in the email, the chances of having that properties’ availability updated increases roughly by 20%.
Another conclusion that can be taken from the table is that the baseline update rate is 14,5%, “delivered” emails get a boost of 4.5% (14,5% + 4,5% = 19% total), “opened” an
Coefficients a Model Unstandardised B Coefficients Std. Error Standard Coefficients Beta t Sig 1 Constant .145 .002 79.306 .000 Delivered .045 .006 .048 7.662 .000 Opened .069 .009 .059 7.312 .000 Clicked .190 .010 .128 19.400 .000
a. Dependent Variable: Updated
Table 4 - SPSS output with values of the regression with Dependent variable update and independent: delivered, opened and clicked
20
extra boost of 6,9% (14,5%, + 4,5% + 6,9% = 25,9% total), and “clicked” a final boost of 19% (25,9% + 19% = 44,9% in total).
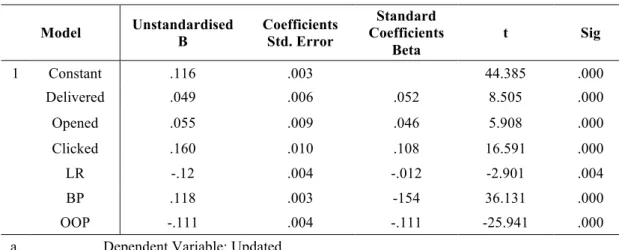
Two more regressions were performed to deepen this study. The first one is by including the variables OOP, BP, and has landlord resident (LR) to figure 9, and the second one is by adding interactions of these three variables with “delivered”, “opened”, and “clicked”. This last regression aims to analyse whether the percentages on “delivered”, “opened”, and “clicked” differ across OOP, BP, and LR.
Table 5 - SPSS output with values of the regression with Dependent variable update and independent: delivered, opened, clicked, LR, BP and OOP
From the figure above, it is possible to analyse that all the variables are still statistically significant at a significance level of 5%. However, the probability of a landlord updating the availability of their property is much higher if they have had a booking paid in the past, rather than if they clicked on the CTA of the email they received. In fact, when a landlord has had a booking paid in the past, the chances of having their properties’ availability updated increases by more than 35%, whereas when a landlord clicks on the CTA, the chances of having those properties’ availability updated increases by just over 15%.
Coefficients a
Model Unstandardised B Coefficients Std. Error
Standard Coefficients Beta t Sig 1 Constant .116 .003 44.385 .000 Delivered .049 .006 .052 8.505 .000 Opened .055 .009 .046 5.908 .000 Clicked .160 .010 .108 16.591 .000 LR -.12 .004 -.012 -2.901 .004 BP .118 .003 -154 36.131 .000 OOP -.111 .004 -.111 -25.941 .000
21
Two of the inserted variables have a negative effect on the equation; the first one is whether the landlord lives in the property or not, and the second one is whether the landlord is OOP or not. As seen previously, it is no surprise that landlords who are out of the platform have several reasons, as seen previously, not to update the availability of their property, thus the result is not alarming. On the other hand, by having a landlord resident in the property, the chances of them updating the availability are negative (-2,9%). The company should keep this variable in mind and analyse it, as more than 20% of the properties observed in this study have resident landlords.
Table 6 - SPSS output with values of the regression with Dependent variable update and independent variables created as a result of the interactions between delivered, opened and clicked with OOP, LR and BP
Coefficients a Model Unstandardised B Coefficients Std. Error Standard Coefficients Beta t Sig 1 Constant .120 .003 43.288 .000 Delivered .010 .009 .011 1.188 .235 Opened .060 .014 .051 4.277 .000 Clicked .206 .016 .139 13.243 .000 LR -.001 .004 -.001 -.222 .824 BP .102 .004 .133 28.036 .000 OOP -.105 .005 -.105 -22.897 .000 Delivered* OOP .001 .016 .000 .074 .941 Delivered* LR -.037 .013 -.021 -2.796 .005 Delivered* BP .118 .012 .094 9.907 .000 Opened* OOP -.062 .029 -.014 -2.171 .030 Opened*LR -.033 .022 -.013 -1.478 .139 Opened*BP .002 .019 .001 .118 .906 Clicked* OOP -.111 .040 -.015 -2.763 .006 Clicked*LR .012 .024 .004 .521 .602 Clicked*BP -.106 .020 -.058 -5.352 .000
22
By creating dummy variables with two-way interaction on SPSS, it can be observed that several variables are not statistically significant at a 5% confidence level. These are: “Delivered”, “LR”, “Delivered*OOP”, “Opened*LR”, “Opened*BP” and
“Clicked*LR”. Thus, these will be dropped from the study.
What can be concluded from the figure presented above is that “BP” and “Clicked” are the variables that most positively influence the update, and “OOP” is the only one that negatively influences “update”. Another conclusion that can be taken is that all the significant interactions in the table negatively impact “update”, except for
“delivered*BP”, which increases the chances of having the properties’ availability updated by almost 10%.
Conclusion
Email marketing still plays an important role in a business. Whether it is to attract new customers, build stronger relationships with existing ones, or to directly increase the company’s revenue. This company is no exception, and the emails sent as part of the availability push campaign helped it to have accurate availability of the properties on their platform, and consequently increase the number of bookings paid in that period, as well as decrease the number of rejected or expired bookings.
The sending of the email itself had a positive impact on the properties’ availability, as more than 34% of the updates occurred in cases when the landlord received the email. Several variables were tested to measure their impact on the properties’ availability, and from this research, the most important ones are: i) whether the landlord has had a booking paid or not; ii) whether the landlord still has their offer live on the platform or not; and iii) whether the landlord lives in the property or not.
23
Given the fact that some properties might not have received booking requests prior to this email campaign, and consequently, the company might not have received the landlord’s commission fee, it is recommended that the company considers an analysis on the impact that this email campaign has on their revenue. When doing so, the cost of sending the email should also be considered, seeing as efficient CRM platforms are usually expensive.
References
• Raluca Dania Todor. Promotion and communication through e-mail marketing campaigns. Bulletin of the Transilvania University of Brasov Series V :
Economic Sciences, Vol 10, Iss 59, Pp 61-66 (2017). 2017;(59):61.
• Pantea Carmen, Pop Nicolae Al. Email Marketing Campaigns: The Easiest Path from Organizations to Consumers – an Exploratory Assessment. Annals of the
University of Oradea: Economic Science, Vol 1, Iss 1, Pp 737-742 (2010).
2010;(1):737.
• Camelia Budac. Theoretical Approaches on Successful Email Marketing Campaigns. Ovidius University Annals: Economic Sciences Series, Vol XVI, Iss
2, Pp 306-311 (2016). 2016;(2):306.
• Sahni NS, Wheeler SC, Chintagunta P. Personalization in Email Marketing: The Role of Non-Informative Advertising Content. Working Papers (Faculty) --
Stanford Graduate School of Business. January 2016:1-41.
• Watjatrakul B, Drennan J. Factors Affecting E-Mail Marketing Sourcing Decisions: A Transaction Cost Perspective. Journal of Marketing Management. 2005;21(7-8):701-723.
• Minsker M. The Future of EMAIL Marketing. CRM Magazine. 2014;18(2):24-28.
24
• Tallman K. Email Marketing Automation For Lead Generation. HCM Sales,
Marketing & Alliance Excellence Essentials. 2017;16(2):22-23.
Appendix
Appendix 1 – Simple cross tab, across delivered vs opened vs clicked
Appendix 2 – Email clicked vs unsubscriptions
Opened * Delivered Cross tabulation
Delivered Total 0 1 Opened 0 Count 41248 4393 45641 % within opened 90.4% 9.6% 100.0% % within delivered 100.0% 42.0% 88.3% 1 Count 0 6056 6056 % within opened 0.0% 100.0% 100.0% % within delivered 0.0% 58.0% 11.7% Total Count 41248 10449 51697 % within opened 79.8% 20.2% 100.0% % within delivered 100.0% 100.0% 100.0%
Opened * Clicked Cross tabulation
Clicked Total 0 1 Opened 0 Count 45641 0 45641 % within opened 100.0% 0.0% 100.0% % within clicked 95.0% 0.0% 88.3% 1 Count 2380 3676 6056 % within opened 39.3% 60.7% 100.0% % within clicked 5.0% 100.0% 11.7% Total Count 48021 3676 51697 % within opened 92.9% 7.1% 100.0% % within clicked 100.0% 100.0% 100.0%
Clicked * Unsubscription Cross tabulation
Unsubscribtion Total 0 1 Clicked 0 Count 47876 145 48021 % within clicked 99.7% 0.3% 100.0% % within unsubscription 93.0% 70.0% 92.9% % of Total 92.6% 0.3% 92.9% 1 Count 3614 62 3676 % within clicked 98.3% 1.7% 100.0%
25
Appendix 3 – Remaining SPSS output for regression #1 (Figure 11)
Model Summary
Model R R Square Adjusted R Square Std. Error of the Estimate
1 .211a .044 .044 .373
a. Predictors: (Constant), clicked, delivered, opened
ANOVAa
Model Squares Sum of df Square Mean F Sig.
1 Regression 332.666 3 110.889 799.100 .000b
Residual 7173.273 51693 .139
Total 7505.939 51696
a. Dependent Variable: updated
b. Predictors: (Constant), clicked, delivered, opened
Appendix 4 – Remaining SPSS output for regression #2 (Figure 12)
Model Summary
Model R R Square Adjusted R Square Std. Error of the Estimate
1 .289a .083 .083 .365
a. Predictors: (Constant), OOP, LR, delivered, bp, clicked, opened
% within unsubscription 7.0% 30.0% 7.1% % of Total 7.0% 0.1% 7.1% Total Count 51490 207 51697 % within clicked 99.6% 0.4% 100.0% % within unsubscription 100.0% 100.0% 100.0% % of Total 99.6% 0.4% 100.0% ANOVAa Model Sum of Squares df Mean Square F Sig. 1 Regression 626.356 6 104.393 784.358 .000b Residual 6879.583 51690 .133 Total 7505.939 51696
a. Dependent Variable: updated
26
Appendix 5 – Remaining SPSS output for regression #3 (Figure 13)
Model Summary
Model R R Square Adjusted R Square Std. Error of the Estimate
1 .296a .087 .087 .364
a.Predictors: (Constant), clicked*BP , delivered*OOP, LR, BP, OOP, Clicked*OOP, Opened*LR, Delivered, Opened*OOP, Delivered*LR, Clicked*LR, Delivered*BP, Opened, Clicked, Opened*BP
ANOVAa Model Sum of Squares df Mean Square F Sig. 1 Regression 655.882 15 43.725 329.891 .000b Residual 6850.057 51681 .133 Total 7505.939 51696
a. Dependent Variable: updated
b. Predictors: (Constant), clicked*BP , delivered*OOP, LR, BP, OOP, Clicked*OOP, Opened*LR, Delivered, Opened*OOP, Delivered*LR, Clicked*LR, Delivered*BP, Opened, Clicked, Opened*BP