WIDER Working Paper 2018/29
An empirical analysis of state fragility and
growth
The impact of state ineffectiveness and political
violence
Ines A. Ferreira*
* School of International Development, University of East Anglia (UEA), Norwich, UK, I.Afonso-Roque-Ferreira@uea.ac.uk. This study is published within the UNU-WIDER project on ‘The economics and politics of taxation and social protection’. Copyright © UNU-WIDER 2018
Information and requests: publications@wider.unu.edu ISSN 1798-7237 ISBN 978-92-9256-471-1
Typescript prepared by Ans Vehmaanperä.
The United Nations University World Institute for Development Economics Research provides economic analysis and policy advice with the aim of promoting sustainable and equitable development. The Institute began operations in 1985 in Helsinki, Finland, as the first research and training centre of the United Nations University. Today it is a unique blend of think tank, research institute, and UN agency—providing a range of services from policy advice to governments as well as freely available original research.
The Institute is funded through income from an endowment fund with additional contributions to its work programme from Finland, Sweden, and the United Kingdom as well as earmarked contributions for specific projects from a variety of donors. Katajanokanlaituri 6 B, 00160 Helsinki, Finland
Abstract: The role of the state in promoting development is well established in the institutional economics literature. Yet, in recent decades the attention has been turned to the opposite side of the spectrum. Facing high levels of poverty and showing a slower progress in achieving development outcomes, fragile states raised concerns among the development community, which felt urged to assist them. However, the quantitative empirical literature examining the link between state fragility and development is still relatively scanty. This paper sheds light on this issue by proposing an approach that comprises indicators for state ineffectiveness and political violence as two dimensions of state fragility, and by using data for the period 1993–2012 in order to understand their impact on growth. The results from standard econometric methods suggest that there is a significant negative effect of state ineffectiveness on economic growth, whereas they fail to find any significant impact of political violence.
Keywords: state fragility, state ineffectiveness, political violence, economic growth, OLS, IV JEL codes:H11, O11, O43
Acknowledgments: This work was supported by the FCT – Fundação para a Ciência e Tecnologia under Grant SFRH/BD/100811/2014. I am grateful to Arjan Verschoor and Edward Anderson for their helpful comments and advice. I also thank the participants of the WIDER Conference on ‘Public Economics for Development’ organized in July 2017 in Maputo, Mozambique, for their insightful feedback and suggestions.
1 Introduction
The role of the state in promoting development has been discussed at length in the institutional economics literature. Recent reviews highlight that, notwithstanding the variety of perspectives, existing studies agree on some common state characteristics that are favourable to the promotion of development (Bardhan 2016). However, as a result of the events over the last decades (e.g. the 9/11 attacks), increasing attention has been brought to the implications for development when a state fails to fulfil these features. Facing high levels of poverty and showing a slower progress in achieving development outcomes, fragile states attracted the attention from the development community, which felt urged to assist them. The focus is back on the state, but the quantitative empirical literature examining the link between state fragility and development is still relatively scanty. This paper sheds light on this issue by applying standard econometric techniques to data for the period 1993–2012, and by using indices of state ineffectiveness and political violence as the core dimensions of state fragility, to understand their impact on growth.
The weight of the evidence suggests that, as expected, state ineffectiveness has a significant negative effect on economic growth. This result is robust to variations in the data used and the estimation method employed. The conclusion for the effect of political violence is less clear-cut. In contrast to the expectation, there is some evidence suggesting a positive effect, but this result is not robust to variations in the specifications used.Additionally, the estimated coefficients show no robust effect of fragility on growth when a unidimensional index is considered.
This has important implications for development policy. Firstly, it provides some support for the view reiterated recently in the World Development Report 2017 (World Bank 2017) that improving governance is essential to overcome the challenges currently faced by developing countries. Secondly, this paper concurs to the argument that, in order to unpack the complexity of state fragility and its effects, one should consider its different dimensions separately.
The paper is organized as follows. The next section establishes the links between this analysis and the existing literature. Section 3 explains how state fragility is conceptualized and measured, whereas section 4 presents the empirical model and describes the data used. The main results are analysed in section 5, which also includes some robustness checks. Finally, section 6 discusses the results in relation to the existing literature, and section 7 concludes.
2 Overview of the literature
Despite being at the core of the discourse on fragile states, the link between state fragility and economic development has only been examined in the context of cross-country regressions in a few studies.1 Bertocchi and Guerzoni (2010) distinguish between empirical studies focusing on the
direct impact of fragility on economic development, and those exploring an indirect effect through aid. This paper contributes to the first of these groups.
1 The field of political science is not short of accounts of the challenges imposed by failing and failed states, especially
before the fragile states term came into use. The reports from development organisations also include quantitative and qualitative evidence on the effects of state fragility on development. Given the focus of this paper, these are not reviewed here.
In an early account, Chauvet et al. (2007) explore the costs of failing states, defined as the Low-Income Countries Under Stress (LICUS) that have been in this position for a continuous period of at least four years. Considering the period 1998–2001, they add dummy variables for failing states, for states in civil war, and for neighbourhood spillovers to a growth regression, and then use ordinary least squares (OLS) and Generalized Method of Moments (GMM) methods to estimate the percentage of reduction in the growth rate. They conclude that being a failing state at peace corresponds to a decrease in the growth rate by 2.6 per cent when compared to countries at peace with adequate policies and governance. Furthermore, a switch from peace to war leads to a further reduction in growth of 1.6 per cent.
Bertocchi and Guerzoni (2010) use data for 28 Sub-Saharan African countries during the period 1999–2004 and consider as fragile states the countries belonging to the bottom two quintiles of the Country Policy and Institutional Assessment (CPIA) rating, or unrated. After applying both pooled OLS and Two-Stage Least Squares (2SLS), they conclude that there is no significant impact of fragility on economic growth. However, when restricting the list of fragile states to those countries belonging to the bottom quintile of the CPIA rating or unrated, the results show a clear, negative impact.
Despite the profusion of studies examining the effect on growth of related factors – such as corruption, institutional quality, or state capacity, among others – to the best of the author’s knowledge, these are the only studies that focus explicitly on the examination of the link between state fragility per se and economic growth in the context of cross-country regressions.2 This paper
contributes to this literature by using an alternative measure of fragility that is not based on the CPIA and considering the two dimensions separately.
By focusing on the impact of state ineffectiveness and political violence on economic growth, this paper also contributes to different strands of studies within the growth literature. The first contribution is towards the group of studies rooted in the idea that different rates of economic growth can be explained by differences in state capacity and the level of institutions. The second is the line of argument that examines the impact of different dimensions of political violence on growth rates. I refer to Maier (2010) for a more comprehensive review, but for the sake of completeness, I also provide a brief overview in the following paragraphs.
2.1 Effect of state capacity and institutions on growth
Over the last decades, there has been an increasing focus on governance and a tendency towards assessing its level by using the lenses of the state, and underlining the importance of state capacity as an essential feature for effective governance (Savoia and Sen 2015). Due to its multidimensionality, state capacity has been conceptualized and measured in a variety of ways, and different authors have focused on different mechanisms through which the state affects development outcomes (Savoia and Sen 2015: 442).3
Evans and Rauch (1999) find a strong association between ‘Weberianness’ and economic growth in 35 emerging economies for the period 1970–90. Their ‘Weberianness Scale’ is a measure of the degree to which meritocratic recruitment and the offer of predictable, rewarding long-term careers characterizes core state agencies (Evans and Rauch 1999: 749). The results in Bockstette et al.
2 Even though Chauvet et al.s (2007) work refers to failing states, their definition is close to that of fragile states. 3 I refer to Cingolani (2013) for a comprehensive overview.
(2002) show a positive association between state antiquity and economic growth for 94 countries over the period 1960–95.
Another line of work uses measures of institutional quality in the empirical analysis. Focusing on the period 1974–89, Knack and Keefer (1995) found that institutions that protect property rights are crucial for investment and growth. Extending the period until 2000 and using three alternative measures for the level of corruption, including the International Country Risk Guide (ICRG) index, Mendez and Sepulveda (2006) concluded that there is a non-linear relationship between corruption and growth, with corruption being favourable at low levels of incidence and harmful to economic growth at high levels of incidence. Bosworth and Collins (2003) argue that a part of the cross-country variation in economic growth over the period 1960–2000 can be explained by the quality of the governing institutions (e.g. law and order, absence of corruption, and protection of property rights).4
Some authors have started to unpack the concept of state capacity by distinguishing between different components (see Bardhan 2016, for an overview). For instance, using different indicators of governance from the World Bank’s Worldwide Governance Indicators database, but focusing on the impact of regulatory quality, Jalilian et al. (2007) suggest that there is a strong causal link between this dimension and growth.5
2.2 Effect of political violence on growth
Parallel to this literature, a large number of papers have examined the significance of political variables in growth regressions.6 Some authors have tested the relationship between repression or
its opposite, political freedom, on economic growth. An early study by Chen and Feng (1996) reports that the analysis of cross-sectional data for 88 countries for the period 1974–90 confirms the expected negative effect of government repression on economic growth. Considering the period 1975–2004, and using data for about 100 countries, Chauffour (2011) found a positive effect of civic and political rights on economic growth.
Focusing on the growth effect of civil wars7, Collier (1999) observed that, when considering all
civil wars during the period 1960–92, the results indicate a decline of income per capita at an annual rate of 2.2 per cent during civil wars in comparison to its counterfactual. This is in line with previous work that has found the link between civil war incidence and economic growth to be negative (e.g. Barro 1991). More recently, the results obtained by Murdoch and Sandler (2004) show that in the short-run (5-year period), per capita real income growth is predicted to be 0.05 percentage points less if there is a civil war in the country during that period. Bodea and Elbadawi (2008) concur to the view that political violence, and particularly civil war, has a significant negative effect on growth. Although Biswas et al. (2016) fail to find a significant effect of ethnic civil war on income growth over the period 1975–2005, the negative contemporaneous impact of non-ethnic war is significant.
However, other work focusing on the long-run impact points to the opposite effect. Organski and Kugler (1977) find that 15–20 years after the war its effects have dissipated and countries recover
4 The connection with the literature on ‘good governance’ is also apparent, but will not be explored here.
5 More tangentially, this paper also relates to the work testing the link between institutions factors and economic
growth in the long-run. I refer to Nunn (2009) for an overview of this research.
6 I refer to Carmignani (2003) for a more complete overview. It is important to highlight that the studies discussed
here explore the variation across countries, but in most cases employ panel data methods.
the level of pre-war performance, a phenomenon that authors label as the ‘phoenix factor’. More recently, also using cross-sectional data, but extending the period until 2001, Cerra and Saxena (2008: 442) show evidence of a partial rebound of output following a civil war. Still, some authors also fail to find any significant effect (e.g. Aisen and Veiga 2013; Jong-A-Pin 2009).
The literature focusing specifically on coups d’état is scarcer. Using data for 121 countries over the period 1950–82, Londregan and Poole (1990) failed to find evidence of a significant effect of either the recent history of coups or the current propensity for a coup d’état. In contrast, Fosu (2002) found an adverse effect of coup events in Sub-Saharan African countries over the 1960–86 period. Overall, existing studies seem to indicate that there is a positive (negative) effect of state effectiveness (ineffectiveness) on growth. In the case of political violence, the literature suggests that considering different dimensions and time periods may point to divergent effects. Thus, the overall impact may be less clear.
3 Conceptualizing and measuring state fragility
Despite the mounting number of analytical tools that have appeared in response to the demand for orientation on how to deal with fragile states, the concept remains obscure and the quantification efforts have been subjected to criticism. It has been argued that, in most cases, there is a lack of definitional clarity, often resulting from weak theoretical foundations, alongside some methodological limitations in their construction (Ferreira 2017). The proposal in this paper follows the line of recent work taking multidimensionality into account (e.g. Gravingholt et al. 2015). However, it departs from these approaches in that it considers state ineffectiveness and political violence as the two dimensions of fragility and measures them separately using principal components analysis (PCA).
3.1 Concept
The definition of state fragility starts by considering the role of the state in society. I adopt a political economy view, which is centred on the core functions of the state and aligned with the post-Washington Consensus view of economic development (Stiglitz 2002). According to this perspective, and following the list of ‘minimal’ functions advanced in World Bank (1997: 27), it is argued that, in order to promote development, the state must provide a set of public goods and protect the poor.
This normative standpoint is then complemented with positive considerations about the actual role of the state. These are derived from Besley and Persson’s (2011) theoretical model, according to which a peaceful state with high levels of state capacity will emerge if institutions are sufficiently cohesive and there is a common interest in providing public goods. However, if this is not the case, two pathologies of the state can emerge. Either there is: i) ‘state ineffectiveness in enforcing contracts, protecting property, providing public goods and raising revenues’; or there is ii) ‘political violence either in the form of repression or civil conflict’; or even iii) both pathologies are present at the same time (Besley and Persson 2011: 373). This paper considers that there is state fragility when the country exhibits one or both of these symptoms; and the higher their level, the greater will be the degree of state fragility.
3.2 Measure
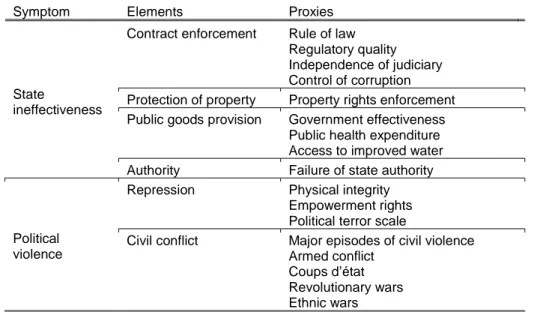
The indicators listed in Table 1 were chosen to represent cues that reveal the presence of the two symptoms, subject to data availability (further details about their sources are described in the Appendix, Table A).
PCA is a procedure to reduce a set of highly correlated variables into a smaller number of components, which are orthogonal to each other. The state ineffectiveness index was obtained by applying PCA to the set of variables representing state effectiveness, and then multiplying the resulting scores for the first principal component by -1, in order to transform this variable into a measure of state ineffectiveness. Similarly, the political violence index results from the application of PCA to the set of variables describing political violence. The dataset included data for all the countries available over the period 1993–2012, and PCA provided a score on state ineffectiveness for 158 countries, and on political violence for 166 countries8.
The same method was used to derive two versions of a unidimensional index of state fragility. The first results from the first principal component obtained from applying PCA to the aforementioned indices of state ineffectiveness and political violence (version 1). The second is the first principal component obtained from applying PCA to all of the indicators listed in Table 1 (version 2).
Table 1. Variables used in the construction of the indices Symptom Elements Proxies
State
ineffectiveness
Contract enforcement Rule of law Regulatory quality Independence of judiciary Control of corruption Protection of property Property rights enforcement Public goods provision Government effectiveness
Public health expenditure Access to improved water Authority Failure of state authority
Political violence
Repression Physical integrity Empowerment rights Political terror scale
Civil conflict Major episodes of civil violence Armed conflict
Coups d’état Revolutionary wars Ethnic wars
Source: Author’s construction.
4 Empirical model and data
The tradition of using cross-country regressions to examine economic growth and its determinants has been established since the early studies towards the end of the 1980s and the beginning of the 1990s. The use of growth regressions in development economics stems from the interest in understanding the underlying factors that explain the differences in the economic performance of
8 See Figures A and B in the Appendix for more details on the distribution of these scores in each of the periods
countries. This has led to a plethora of studies examining different growth determinants.9 The
empirical basis used here is largely in line with this literature and can be represented as follows:
𝑔𝑔𝑖𝑖 = 𝛼𝛼 + 𝛽𝛽 log 𝑦𝑦𝑖𝑖,0+ 𝛿𝛿𝑋𝑋𝑖𝑖+ 𝜀𝜀𝑖𝑖 (1)
where 𝑖𝑖 indexes countries, 𝑔𝑔𝑖𝑖 is per capita real Gross Domestic Product (GDP) growth, 𝛼𝛼 is a
constant, log 𝑦𝑦𝑖𝑖,0 is the logarithm of the initial level of per capital real GDP, and 𝜀𝜀𝑖𝑖 represents the
error term. 𝑋𝑋𝑖𝑖 includes covariates, which can vary greatly from paper to paper, given that growth
theory does not provide a definite list for these determinants. In the face of this challenge, recent studies include their variable of interest and use the results from previous empirical studies as a guideline for the choice of control variables.
In order to test whether there is an effect of state fragility on growth, and in line with the multidimensional approach proposed in this paper, I add to this formulation a term to capture state ineffectiveness and another to capture political violence. These are represented in equation (2) by 𝑠𝑠𝑖𝑖𝑖𝑖 and 𝑝𝑝𝑝𝑝𝑖𝑖, respectively. Their corresponding coefficients, 𝛾𝛾1 and 𝛾𝛾2, measure how growth
is affected by each of these dimensions. Bearing in mind that higher levels of state ineffectiveness and of political violence are interpreted as higher levels of state fragility, and according to the postulate that higher levels of fragility have a detrimental effect on growth, the expectation is that they have a negative sign.
𝑔𝑔𝑖𝑖 = 𝛼𝛼 + 𝛽𝛽 log 𝑦𝑦𝑖𝑖,0+ 𝛾𝛾1𝑠𝑠𝑖𝑖𝑖𝑖+ 𝛾𝛾2𝑝𝑝𝑝𝑝𝑖𝑖+ 𝛿𝛿𝑋𝑋𝑖𝑖+ 𝜀𝜀𝑖𝑖 (2)
The matrix of the state resulting from Besley and Persson’s (2011) model identifies different types of states, resulting from the combination of the two symptoms. For instance, the economic performance of a weak state at peace is likely to be different from that of a repressive, but effective state. Inspired by this, I introduce an interaction term between state ineffectiveness and political violence in equation (3). Thus, 𝛾𝛾3 allows one to examine whether the effect of state ineffectiveness,
or political violence, on growth is different for different values of political violence, or state ineffectiveness.
𝑔𝑔𝑖𝑖 = 𝛼𝛼 + 𝛽𝛽 log 𝑦𝑦𝑖𝑖,0+ 𝛾𝛾1𝑠𝑠𝑖𝑖𝑖𝑖+ 𝛾𝛾2𝑝𝑝𝑝𝑝𝑖𝑖 + 𝛾𝛾3𝑠𝑠𝑖𝑖𝑖𝑖× 𝑝𝑝𝑝𝑝𝑖𝑖+ 𝛿𝛿𝑋𝑋𝑖𝑖 + 𝜀𝜀𝑖𝑖 (3)
When compared to the studies testing the effect of state fragility on growth reviewed in the previous section, this approach differs by using two distinct indices to proxy for the dimensions of state fragility separately, and by employing a continuous measure of state fragility rather than a dummy for whether a country is fragile.
Given that the annual scores for the index of state ineffectiveness are available only from 1996, and in order to maximize the use of the data available, the estimations in this paper were carried out considering the period 1993–2012. The first set of results was obtained with cross-country data for one 20-year horizon (1993–2012) and two 10-year horizons (1993–2002 and 2003–12); panel data considering 5-year averages (starting in period 1993–97) and 10-year averages (starting in period 1993–2002) were used later in the analysis.
Following the standard practice in the literature, the average of the annual growth rate of real GDP is used as dependent variable. State ineffectiveness and political violence are measured using the two indices described above. As mentioned before, there is no definite list of growth determinants.
9 I refer to Maier (2010) for a review of growth models and economic explanations for underdevelopment in the
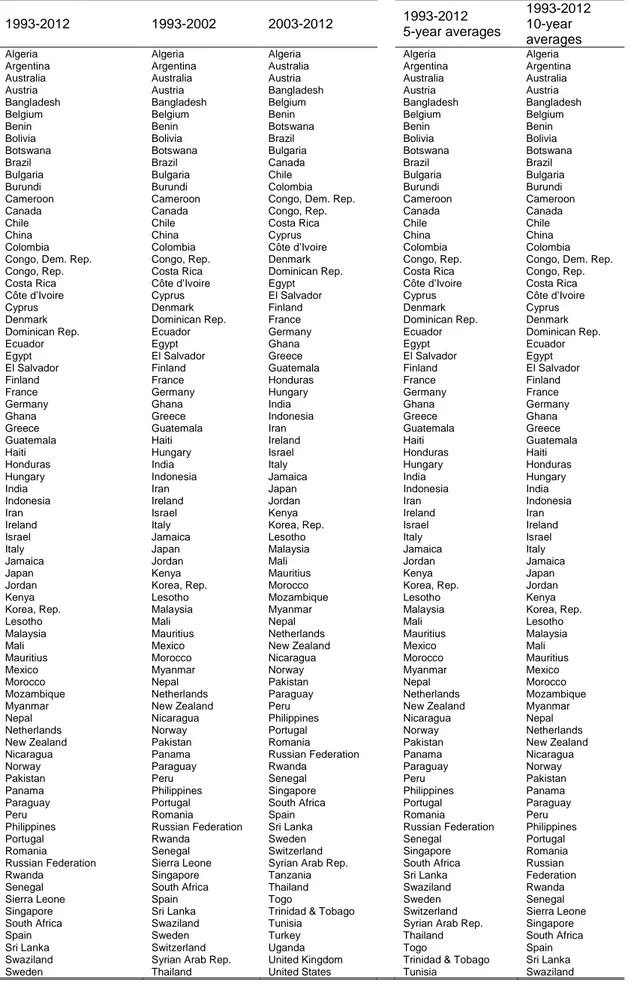
Inspired by some influential work by Bosworth and Collins’ (2003) and Sala-i-Martin et al.’s (2004), the following were chosen as control variables: initial level of per capita GDP; education; change and variability of the terms of trade; measure of geography; inflation; budget balance; trade policy. In addition to these, regional dummies were included for Sub-Saharan Africa, East Asia, and Latin America, as well as time dummies in the case of panel regressions. The samples of countries are listed in Table B in the Appendix whereas Table C includes the full details of the sources and construction of the variables. Tables D and E show the descriptive statistics for the datasets used.10
5 Results analysis 5.1 Initial results
State ineffectiveness and political violence
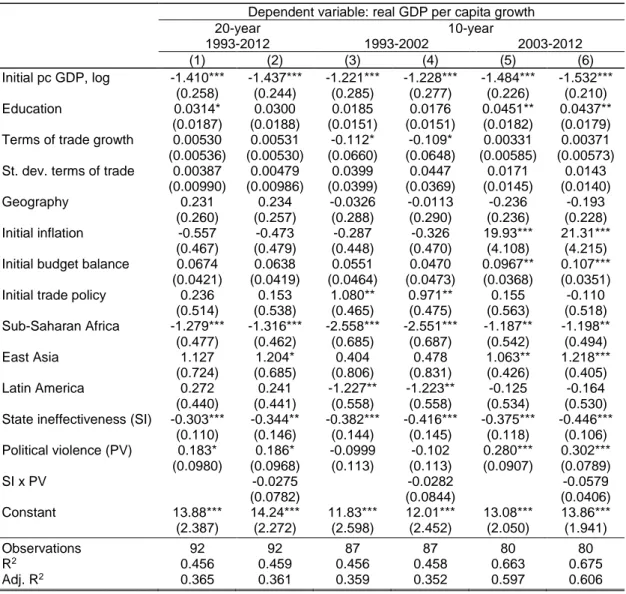
I begin the analysis with the regressions estimated with OLS. The cross-country results are represented in Table 2. Columns with odd numbers were obtained with the specification in equation (2), whereas even numbered columns result from adding the interaction between state ineffectiveness and political violence, in order to estimate equation (3).
Focusing on the variables of interest, state ineffectiveness has a negative and significant effect on economic growth in all specifications. This is in line with the conclusions from previous related work (as discussed in section 2). For instance, for period 1993–2012, column (1), the estimated coefficient suggests that, if the position of a country in terms of state ineffectiveness moves from the 25th percentile to the 75th percentile, the state ineffectiveness index would rise by approximately
3.19, from -1.28 to 1.91. If it did rise by this amount, then growth would fall by almost 1 percentage point. In contrast with the intuition from theory, the coefficient for political violence reveals a positive and significant effect in two of the periods considered.
10 The pairwise correlations between the variables and an analysis of the variance inflation factors (Kennedy 2008:
Table 2. Cross-country OLS estimations
Dependent variable: real GDP per capita growth
20-year 10-year 1993-2012 1993-2002 2003-2012 (1) (2) (3) (4) (5) (6) Initial pc GDP, log -1.410*** -1.437*** -1.221*** -1.228*** -1.484*** -1.532*** (0.258) (0.244) (0.285) (0.277) (0.226) (0.210) Education 0.0314* 0.0300 0.0185 0.0176 0.0451** 0.0437** (0.0187) (0.0188) (0.0151) (0.0151) (0.0182) (0.0179) Terms of trade growth 0.00530 0.00531 -0.112* -0.109* 0.00331 0.00371 (0.00536) (0.00530) (0.0660) (0.0648) (0.00585) (0.00573) St. dev. terms of trade 0.00387 0.00479 0.0399 0.0447 0.0171 0.0143
(0.00990) (0.00986) (0.0399) (0.0369) (0.0145) (0.0140) Geography 0.231 0.234 -0.0326 -0.0113 -0.236 -0.193
(0.260) (0.257) (0.288) (0.290) (0.236) (0.228) Initial inflation -0.557 -0.473 -0.287 -0.326 19.93*** 21.31***
(0.467) (0.479) (0.448) (0.470) (4.108) (4.215) Initial budget balance 0.0674 0.0638 0.0551 0.0470 0.0967** 0.107***
(0.0421) (0.0419) (0.0464) (0.0473) (0.0368) (0.0351) Initial trade policy 0.236 0.153 1.080** 0.971** 0.155 -0.110
(0.514) (0.538) (0.465) (0.475) (0.563) (0.518) Sub-Saharan Africa -1.279*** -1.316*** -2.558*** -2.551*** -1.187** -1.198** (0.477) (0.462) (0.685) (0.687) (0.542) (0.494) East Asia 1.127 1.204* 0.404 0.478 1.063** 1.218*** (0.724) (0.685) (0.806) (0.831) (0.426) (0.405) Latin America 0.272 0.241 -1.227** -1.223** -0.125 -0.164 (0.440) (0.441) (0.558) (0.558) (0.534) (0.530) State ineffectiveness (SI) -0.303*** -0.344** -0.382*** -0.416*** -0.375*** -0.446***
(0.110) (0.146) (0.144) (0.145) (0.118) (0.106) Political violence (PV) 0.183* 0.186* -0.0999 -0.102 0.280*** 0.302*** (0.0980) (0.0968) (0.113) (0.113) (0.0907) (0.0789) SI x PV -0.0275 -0.0282 -0.0579 (0.0782) (0.0844) (0.0406) Constant 13.88*** 14.24*** 11.83*** 12.01*** 13.08*** 13.86*** (2.387) (2.272) (2.598) (2.452) (2.050) (1.941) Observations 92 92 87 87 80 80 R2 0.456 0.459 0.456 0.458 0.663 0.675 Adj. R2 0.365 0.361 0.359 0.352 0.597 0.606
Notes: Robust standard errors in parentheses. *** p<0.01, ** p<0.05, * p<0.1. Source: Author’s calculation based on the data described in the Appendix.
The results in columns (2), (4), and (6) do not suggest that there is a significant interactive effect between state ineffectiveness and political violence. The magnitude of the coefficients is similar across specifications and they all exhibit a negative sign, but none is significant. Additionally, the overall conclusions for the main variables of interest are maintained when the interaction term is included.
I turn now to the evidence obtained using panel data, considering the 5-year and 10-year averages, represented in Table 3, columns (1)–(4). Starting with the 5-year averaged data, the expected negative effect of state ineffectiveness persists when panel data are considered. However, it loses significance after the inclusion of the interaction term. The coefficient obtained for political violence is positive, but small in magnitude and not significant, and again the result for the interaction term does not lend support to the existence of an interactive effect of these two variables on growth.
Considering the 10-year averaged data, the adverse effect of state ineffectiveness holds when this data structure is considered, and also when the interaction term is added. The coefficient for political violence remains roughly the same, with a small reduction in magnitude, but still non-significant. The inclusion of the state ineffectiveness x political violence term does not cause major
variations to the coefficients of the two variables, and despite the change in sign, it remains small in magnitude and non-significant.
Table 3. Panel OLS and FE estimations
Dependent variable: real GDP per capita growth
OLS estimates FE estimates
5-year averages 10-year averages 5-year averages 10-year averages
(1) (2) (3) (4) (5) (6) (7) (8) In. pc GDP, log -1.226*** -1.187*** -1.572*** -1.577*** -8.273*** -8.517*** -6.408*** -6.546*** (0.327) (0.322) (0.235) (0.221) (2.560) (2.555) (1.112) (1.141) Education 0.0407** 0.0428** 0.0375*** 0.0372*** 0.0100 0.00357 -0.0287 -0.0310 (0.0176) (0.0174) (0.0143) (0.0141) (0.0391) (0.0392) (0.0278) (0.0268) Terms trade gr. 0.00317 0.00281 -0.00233 -0.00224 -0.00484 -0.00674 -0.000116 -0.000498 (0.0162) (0.0163) (0.00828) (0.00821) (0.0102) (0.00969) (0.00590) (0.00600) Geography 0.127 0.107 -0.146 -0.141 (0.240) (0.249) (0.219) (0.222) Inflation 1.138** 1.078** 0.189 0.183 0.916*** 0.912*** -1.224* -1.120* (0.522) (0.441) (0.528) (0.547) (0.283) (0.277) (0.694) (0.674) Budget balance 0.130*** 0.125*** 0.124*** 0.124*** 0.0927 0.0923 0.0358 0.0374 (0.0462) (0.0475) (0.0366) (0.0364) (0.0789) (0.0727) (0.0554) (0.0555) Trade policy -0.407 -0.253 0.0648 0.0260 -0.589 -0.689 -1.179 -1.257 (0.734) (0.690) (0.538) (0.468) (1.165) (1.110) (0.931) (0.887) SSA -1.929*** -1.887*** -2.158*** -2.157*** (0.538) (0.548) (0.569) (0.569) East Asia 0.912 0.826 0.686 0.703 (0.651) (0.583) (0.575) (0.520) Latin America -0.457 -0.429 -0.501 -0.502 (0.406) (0.418) (0.402) (0.403) State ineff. (SI) -0.238* -0.190 -0.322*** -0.331*** -0.403 -0.585 0.767 0.698 (0.126) (0.145) (0.0990) (0.105) (0.623) (0.654) (0.514) (0.533) Pol. viol. (PV) 0.0754 0.0689 0.0545 0.0560 -0.0771 -0.156 -0.206 -0.276 (0.106) (0.106) (0.0977) (0.0933) (0.291) (0.286) (0.319) (0.365) SI x PV 0.0407 -0.00741 0.182 0.0808 (0.0700) (0.0697) (0.144) (0.149) Constant 13.05*** 12.05*** 16.04*** 16.14*** 75.96*** 77.81*** 61.35*** 62.37*** (3.102) (3.046) (2.384) (2.099) (22.50) (22.44) (10.04) (10.24) Observations 198 198 167 167 228 228 197 197 R2 0.325 0.328 0.322 0.322 0.395 0.404 0.518 0.521 Adj. R2 0.273 0.273 0.264 0.260 0.367 0.374 0.495 0.495
Notes: Cluster robust standard errors in parentheses. *** p<0.01, ** p<0.05, * p<0.1. Time dummies also included in the regressions.
Source: Author’s calculation based on the data described in the Appendix.
Given that using a panel structure allows one to account for individual heterogeneity, I explore this possibility further. The Breusch and Pagan Lagrange multiplier test (Breusch and Pagan 1980) provided support for this decision when applied to the 5-year averages dataset. The F-test that the observed and unobserved fixed effects are equal to zero indicated that one rejects the null hypothesis, suggesting the use of the fixed effects estimator. Additionally, the result of the Hausman test, frequently used to compare fixed effects and random effects, led to the rejection of the null hypothesis that the estimated coefficient with random effects is efficient, thus, deeming fixed effects as the preferred model.
In light of this, I estimated the coefficients with fixed-effects (FE) methods, presented in columns (5)–(8) in Table 3. They show a loss of significance of the negative coefficient for state ineffectiveness, whereas the coefficient for political violence and the interaction term remain non-significant in any of the specifications. Still, these results should be regarded with caution. FE
estimators are useful when one wants to analyse the impact of variables that vary over time, but a recognized problem in the literature is that they will not be appropriate for variables that change slowly over time. In fact, the limited time variation of state ineffectiveness and political violence may be the reason for the lack of a significant effect for these two indices. 11
Unidimensional index of state fragility
In order to test the claim in this paper that it is important to consider the two indices separately, I compare the results above with those obtained with a single index of state fragility. This is explored by using the two versions described in section 3 to replace state ineffectiveness and political violence in the growth regression. The results for cross-section and panel data are reported in Table 4. For brevity, I include only the coefficients obtained for the two indices.
Table 4. Cross-country and panel OLS estimations with a single index of state fragility
Dependent variable: real GDP per capita growth
CROSS-COUNTRY DATA PANEL DATA
20-year 10-year
5-year averages 10-year averages 1993-2012 1993-2002 2003-2012 (1) (2) (3) (4) (5) (6) (7) (8) (9) (10) Version 1 -0.00254 -0.567*** 0.0731 -0.0335 -0.253 (0.193) (0.205) (0.215) (0.219) (0.183) Version 2 -0.106 -0.353*** -0.0971 -0.102 -0.203** (0.0857) (0.0980) (0.0983) (0.107) (0.0835) Obs. 92 92 87 87 80 80 198 198 167 167 R2 0.401 0.409 0.443 0.460 0.599 0.603 0.312 0.315 0.296 0.308 Adj. R2 0.311 0.320 0.353 0.372 0.527 0.532 0.263 0.267 0.241 0.254
Notes: The control variables are the same as in Tables 2 and 3. Robust and cluster robust standard errors in parentheses for cross-country and panel estimates, respectively. *** p<0.01, ** p<0.05, * p<0.1.
Source: Author’s calculation based on the data described in the Appendix.
The results concur to the argument that, by considering a single index of state fragility, one may be overlooking the effect of different aspects of this phenomenon. With the exception of the 10-year period between 1993 and 2002, the coefficients for neither of the state fragility indices show a significant effect on economic growth. When considering panel data, only one of the obtained coefficients for each version of the index shows a significant impact of state fragility.
5.2 Robustness checks
In order to test the robustness of the results obtained before, a few additional estimations were performed. First, I consider the potential influence of certain observations on the obtained results. The results from a preliminary analysis of potential outliers12 called for closer scrutiny of the
influence of the following observations in the case of cross-country data: i) Israel, Colombia, India and Dem. Rep. Congo for period 1993–2012; ii) India and Brazil for period 1993–2002; and iii) Colombia, India, Algeria, Russia and Venezuela for period 2003–12. For panel data, the methods identified as potential outliers the observations for: i) Myanmar in 2003–07 and Brazil in 1993–97 with 5-year averaged data; and ii) Burundi and Brazil in period 1993–2002 with 10-year averages.
11 An analysis of the variation of these variables over time indicated that most variation is explained by differences
between rather than within countries.
12 I adopted the Hadi (1992) procedure for identifying multiple outliers as implemented by Roodman (2007).
Additionally, I considered the potential outliers in terms of growth rates by using a graphical procedure that consists in the observation of a leverage-versus-squared-residual plot. I consider 0.4 as the threshold level for leverage values.
The results are not reported here for reasons of space, but they showed similar coefficients for state ineffectiveness, with a significant effect in almost all specifications. The coefficient for political violence lost significance when cross-country data was used and remained positive and non-significant with panel data. Finally, the results for the interaction term between the two variables remained roughly the same.
As mentioned in section 4, there is no definite list of controls, and different authors use different sets of explanatory variables. In order to account for the possible changes resulting from using other covariates, I ran an additional set of regressions adding the following three covariates, which can be frequently found, for instance, in the literature examining the link between aid and growth (e.g. Rajan and Subramanian 2008): the M2 as a ratio of GDP as a proxy for the level of depth of the financial system; the average number of revolutions; and an indicator of ethnic fractionalization.13
The results for state ineffectiveness were similar to those obtained before for both cross-country and panel data. There was some variation in the sign and significance level of the coefficient for political violence, suggesting that, as observed before, the results change with the specification considered. The interaction term between state ineffectiveness and political violence remained non-significant.
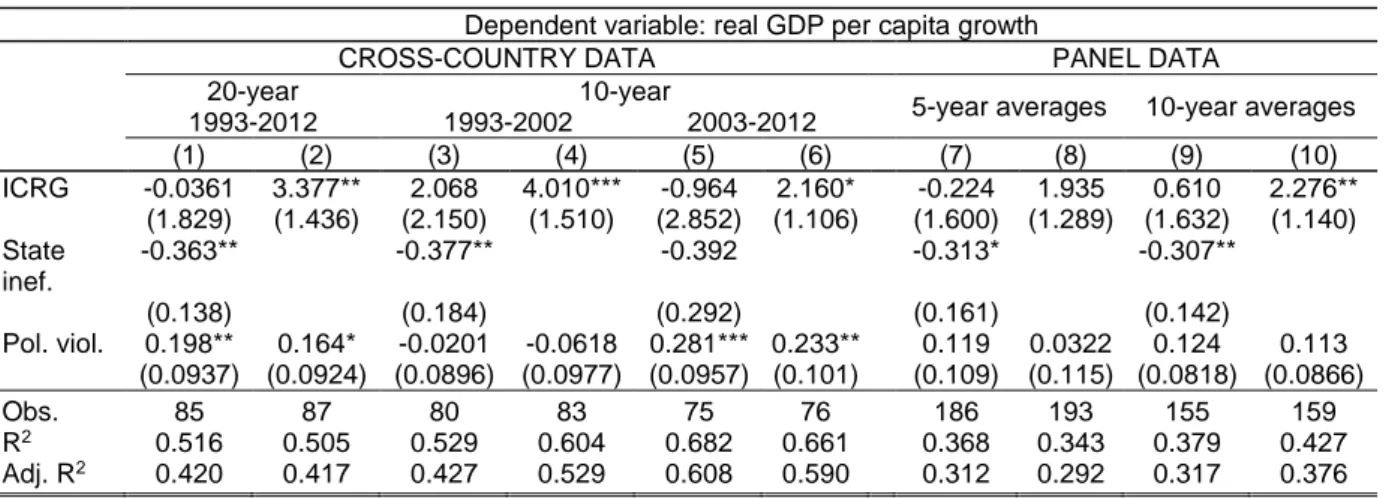
The final possibility addressed in this section is related to the fact that the dimensions captured by the state ineffectiveness index are similar to those usually included in measures of institutional quality. A preliminary analysis performed to ascertain the potential for multicollinearity14 showed
that the state ineffectiveness index is highly correlated with the ICRG indicator of quality of government, which is frequently used as an indicator of the quality of institutions in a country. The results in Table 5 include, first, the coefficients estimated for the main variables of interest when both the ICRG and the state ineffectiveness index are included in the analysis, and then the results obtained when the ICRG replaces the state ineffectiveness index.
Table 5. Cross-country and panel OLS estimations with ICRG
Dependent variable: real GDP per capita growth
CROSS-COUNTRY DATA PANEL DATA
20-year 10-year
5-year averages 10-year averages 1993-2012 1993-2002 2003-2012 (1) (2) (3) (4) (5) (6) (7) (8) (9) (10) ICRG -0.0361 3.377** 2.068 4.010*** -0.964 2.160* -0.224 1.935 0.610 2.276** (1.829) (1.436) (2.150) (1.510) (2.852) (1.106) (1.600) (1.289) (1.632) (1.140) State inef. -0.363** -0.377** -0.392 -0.313* -0.307** (0.138) (0.184) (0.292) (0.161) (0.142) Pol. viol. 0.198** 0.164* -0.0201 -0.0618 0.281*** 0.233** 0.119 0.0322 0.124 0.113 (0.0937) (0.0924) (0.0896) (0.0977) (0.0957) (0.101) (0.109) (0.115) (0.0818) (0.0866) Obs. 85 87 80 83 75 76 186 193 155 159 R2 0.516 0.505 0.529 0.604 0.682 0.661 0.368 0.343 0.379 0.427 Adj. R2 0.420 0.417 0.427 0.529 0.608 0.590 0.312 0.292 0.317 0.376
Notes: The control variables are the same as in Tables 2 and 3. Robust and cluster robust standard errors in parentheses for cross-country and panel estimates, respectively. *** p<0.01, ** p<0.05, * p<0.1.
Source: Author’s calculation based on the data described in the Appendix.
13 The multicollinearity analysis was repeated for the new set of variables and no concerns were raised.
14 As described earlier, this considered the pairwise correlations between the variables and the variance inflation factors
When considering cross-country data, with the exception of the period 2003–12, the coefficient for state ineffectiveness remains negative and significant, which suggests that the obtained results are robust even when controlling for the quality of institutions in the country. However, even if not significant in any of the regressions with the two indices, the coefficient for ICRG shows a significant positive effect when the state ineffectiveness index is dropped from the analysis. Turning now to panel data, again state ineffectiveness remains negative and significant after the inclusion of ICRG. Similar to before, when state ineffectiveness is not included, the coefficient for the ICRG index is positive, though significant only with the dataset with 10-year averages.15
5.3 Addressing endogeneity
Given the nature of the two variables used to proxy for state fragility, there is a risk that the use of OLS methods leads to biased regressors for two main reasons. The first is the potential for omitted variables. For instance, it is possible that state ineffectiveness and growth respond simultaneously to an omitted factor, such as the historical evolution of the nation in question (Mendez and Sepulveda 2006), which would, however, be hard to control for, given the challenges of finding an appropriate indicator and the limitations in terms of data availability.
The second reason is that, while the interest in this paper is to test whether state fragility affects economic growth, as pointed out by Bertocchi and Guerzoni (2010), it is plausible to assume that the causality runs in the opposite direction, i.e. from growth to state fragility. For instance, it could be the case that countries with higher rates of economic growth have more resources to fight against and control corruption (Mendez and Sepulveda 2006: 91). It is also more likely that richer economies choose strong fiscal systems, or they have, at least, the ability to do so (Dincecco and Prado 2012: 172). Also, income levels and income growth have been explored at length in the literature examining the causes of conflict (see, for instance, Blattman and Miguel 2010 or Humphreys 2003), with some authors finding a significant relationship between the two (e.g. Collier and Hoeffler 2004; Miguel et al. 2004).
In light of these issues, the following paragraphs present the results from exploring a series of strategies for overcoming the potential endogeneity of state ineffectiveness and political violence separately. The interaction term between state ineffectiveness and political violence poses additional challenges in terms of finding an appropriate instrument. Thus, in order to simplify the analysis, this term is not included in the discussion that follows.
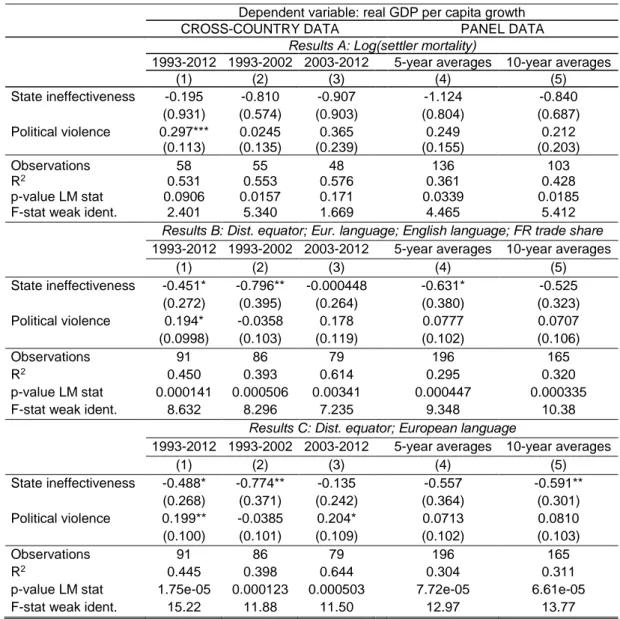
The estimates represented in Table 6 were obtained after applying instrumental variable (IV) procedures in order to address the potential endogeneity of state ineffectiveness. Three alternatives were considered to instrument for state ineffectiveness. First, I use the time-invariant variable representing the logarithm of the settler mortality estimates provided by Acemoglu et al. (2001). According to these authors, the diseases that potential European settlers faced in the colonies (mostly malaria and yellow fever) influenced the patterns of settlement and the type of institutions that were put in place, but did not have a major effect on the health and economy of indigenous people. The estimated coefficients correspond to Results A. One observes that the coefficient for state ineffectiveness maintains its negative sign, but it is not significant in any of the datasets considered. Political violence shows a positive coefficient, which is significant only when the
15 The argument for the disintegration of state fragility proposed here was taken to the extreme by including all the
variables used in the construction of each index as separate regressors. The obtained coefficients (which can be obtained from the author upon request) are preliminary, thus I simply highlight that public expenditure in health, failure of state authority and coups d’état were the only variables showing a significant effect in more than one specification.
year period is used. Still, the results for some of the standard tests for instrument strength, namely the p-value of the Kleibergen-Paap Lagrange-Multiplier (LM) statistic and the first-stage F-statistic (Staiger and Stock 1997) indicate that the logarithm of settler mortality is not a strong instrument for the purposes of this analysis.
Secondly, I employ Hall and Jones’ (1999) list of instruments. The first is a time-invariant variable representing the distance to the equator, obtained by taking the absolute value of latitude in degrees and dividing it by 90 to obtain a 0–1 scale. The authors argue that at the start of the fifteenth century Western Europeans were more likely to move and settle in regions that were sparsely populated and with a similar climate to Western Europe, and these criteria suggest regions far from the equator. I also include the fraction of a country’s population speaking one of the five primary Western European languages (English, French, German, Portuguese, and Spanish) as a mother tongue in the present (considering 1999 as the present), which, according to the authors, will be correlated with the extent of Western European influence. The percentage of the population speaking English as a mother tongue is also included in order to allow for the potential of a separate impact. The fourth variable is Frankel and Romer’s (1996) log of predicted trade share.
Table 6. Cross-country and panel IV estimations with instruments for state ineffectiveness Dependent variable: real GDP per capita growth CROSS-COUNTRY DATA PANEL DATA
Results A: Log(settler mortality)
1993-2012 1993-2002 2003-2012 5-year averages 10-year averages
(1) (2) (3) (4) (5) State ineffectiveness -0.195 -0.810 -0.907 -1.124 -0.840 (0.931) (0.574) (0.903) (0.804) (0.687) Political violence 0.297*** 0.0245 0.365 0.249 0.212 (0.113) (0.135) (0.239) (0.155) (0.203) Observations 58 55 48 136 103 R2 0.531 0.553 0.576 0.361 0.428 p-value LM stat 0.0906 0.0157 0.171 0.0339 0.0185 F-stat weak ident. 2.401 5.340 1.669 4.465 5.412
Results B: Dist. equator; Eur. language; English language; FR trade share
1993-2012 1993-2002 2003-2012 5-year averages 10-year averages
(1) (2) (3) (4) (5) State ineffectiveness -0.451* -0.796** -0.000448 -0.631* -0.525 (0.272) (0.395) (0.264) (0.380) (0.323) Political violence 0.194* -0.0358 0.178 0.0777 0.0707 (0.0998) (0.103) (0.119) (0.102) (0.106) Observations 91 86 79 196 165 R2 0.450 0.393 0.614 0.295 0.320 p-value LM stat 0.000141 0.000506 0.00341 0.000447 0.000335 F-stat weak ident. 8.632 8.296 7.235 9.348 10.38
Results C: Dist. equator; European language
1993-2012 1993-2002 2003-2012 5-year averages 10-year averages
(1) (2) (3) (4) (5) State ineffectiveness -0.488* -0.774** -0.135 -0.557 -0.591** (0.268) (0.371) (0.242) (0.364) (0.301) Political violence 0.199** -0.0385 0.204* 0.0713 0.0810 (0.100) (0.101) (0.109) (0.102) (0.103) Observations 91 86 79 196 165 R2 0.445 0.398 0.644 0.304 0.311
p-value LM stat 1.75e-05 0.000123 0.000503 7.72e-05 6.61e-05 F-stat weak ident. 15.22 11.88 11.50 12.97 13.77
Notes: The controls are the same as in Tables 2 and 3. Robust and cluster robust standard errors in parentheses for cross-country and panel estimates, respectively. *** p<0.01, ** p<0.05, * p<0.1.
Results B show the obtained coefficients. They indicate that the negative effect of state ineffectiveness on growth holds again in all periods, and it is now significant in two of the periods with cross-country data and for the panel dataset obtained with 5-year averages. The term for political violence is positive and significant with period 1993–2012, but the sign changes and it is non-significant for the remaining periods, which suggests that the result is not robust across specifications. This instrumentation strategy is stronger than the one previously described. It passes the overidentification test, although the value for the F-test is still below the threshold level considered to rule out instrumentation weakness in most specifications.
Thirdly, based on the significance levels of the four variables used as instruments in the first-stage regressions (not presented here for space reasons), I dropped the fraction of the population speaking English and the measure of trade share, and kept only the distance to the equator and the fraction of the population speaking a European language as exogenous instruments. The estimated coefficients are represented by Results C and are similar to the ones obtained with the four instruments. State ineffectiveness holds a negative coefficient in all specifications, but it is significant only when cross-country data for the 20-year period and for the decade 1993–2002 are used and for the panel dataset obtained with 10-year averages. The sign and significance level of the coefficient for political violence once again vary with the period considered, and it is positive and significant in only two out of the five specifications. This instrumentation strategy passes both tests of instrument weakness in all specifications, as shown in the last two rows of the table, which suggests an improvement in terms of the strength of the instrument.16
Finding an appropriate instrument for political violence is equally challenging, leading some authors to prefer the use of GMM methods (e.g. Biswas et al. 2016; Bodea and Elbadawi 2008). However, given the limitations of these methods17, I opt for exploring two different approaches
here. The first strategy consisted in using the initial value of political violence in the regressions. Overall, the coefficients obtained (Table 7, Results A) do not show significant differences in terms of the signs and significance levels for the two variables of interest. In fact, one still observes a positive coefficient for political violence in most cases, but it is only significant in two of the five specifications. The significant negative effect of state ineffectiveness remains in all regressions.
Table 7. Cross-country and panel OLS estimations with initial level of political violence and IV estimates with food prices as instrument
Dependent variable: real GDP per capita growth CROSS-COUNTRY DATA PANEL DATA
Results A: OLS estimates with initial level of political violence
1993-2012 1993-2002 2003-2012 5-year averages 10-year averages
(1) (2) (3) (4) (5)
State ineffectiveness -0.303*** -0.382*** -0.375*** -0.238* -0.322*** (0.110) (0.144) (0.118) (0.126) (0.0990) Political violence, initial 0.183* -0.0999 0.280*** 0.0754 0.0545
(0.0980) (0.113) (0.0907) (0.106) (0.0977)
Observations 92 87 80 198 167
R2 0.456 0.456 0.663 0.325 0.322
Adj. R2 0.365 0.359 0.597 0.273 0.264
16 In an additional attempt to overcome the problem that weak instruments may lead to estimated coefficients that
are biased towards OLS, I use Limited Information Maximum Likelihood (LIML) estimation. Following Ricciuti et al. (2016: 25), I use the Fuller’s version of LIML and employ the Fuller 4 version (Fuller 1977). In the just identified case, the IV and the LIML estimators are the same. Thus, this strategy was only employed when Hall and Jones’ (1999) instruments were used, and when these were restricted. The results are in line with the IV estimations and are available from the author upon request.
Results B: IV estimates with food prices as instrument
1993-2012 1993-2002 2003-2012 5-year averages 10-year averages
(1) (2) (3) (4) (5) State ineffectiveness -0.617** -0.754** -0.428** -0.418 -0.549* (0.297) (0.377) (0.196) (0.326) (0.281) Political violence 1.325 1.490 0.618 1.047 1.071 (0.863) (1.079) (0.568) (0.870) (0.863) Observations 88 83 78 147 161 R2 -0.311 -0.728 0.660 -0.076 -0.100 p-value LM stat 0.106 0.101 0.186 0.113 0.152 F-stat weak ident. 2.635 2.374 1.568 2.539 1.944
Notes: The controls are the same as in Tables 2 and 3. Robust and cluster robust standard errors in parentheses for cross-country and panel estimates, respectively. *** p<0.01, ** p<0.05, * p<0.1.
Source: Author’s calculation based on the data described in the Appendix.
The second attempt considered a food price index (Food and Agriculture Organization 2016) averaged across the relevant period as an instrument for political violence. This is inspired by the work that finds a positive causal link between rising food prices and social unrest (e.g. Arezki and Bruckner 2011; Bellemare 2014). The results obtained for cross-country and panel data, portrayed in Table 7, Results B, cast serious doubts on the strength of this variable as an instrument. There was a dramatic loss in the explanatory power of the model and the tests for instrument weakness are failed across specifications.
6 Discussion of the results
This section draws together the insights from the results obtained and positions them in relation to the main conclusions found in previous literature. Still, before doing that, it is important to recognize some limitations in the analysis. Firstly, the sample of countries included is reduced when compared to other analyses on fragile states, and the period covered is limited in comparison to previous work using growth regressions. These two limitations are a result of the challenges in terms of data availability. Secondly, the strategies used to minimize the bias resulting from the endogeneity of state ineffectiveness and political violence are far from perfect. Nonetheless, it is my belief that they uncovered some interesting facts.
The estimated coefficients for state ineffectiveness seem unanimous in terms of the sign of the effect, which is significant in most cases. Thus, the results in this paper strongly suggest that countries with higher levels of state ineffectiveness are expected to grow at lower rates. This is in line with the theory described in section 2, which suggests that in general there is a positive link between state capacity and economic growth, and more specifically that the quality of institutions is an important determinant. The indicator for state ineffectiveness comprises different dimensions of the capacity as well as the effectiveness of the state, thus lending support to the view that attributes an important role to the state in the promotion of development.
The conclusion for the effect of political violence is less clear. When cross-country data are used, the sign and significance level of the coefficient seem to vary depending on the period and estimation method applied. With panel data, the positive sign seems more pervasive across specifications, but it is rarely significant. I, therefore, conclude that the model used in this paper fails to find a definite conclusion about the impact of political violence on growth, though the estimated coefficients seem to indicate that there is no causal effect.
Even though, at face value, the latter result seems to be at odds with the intuition, as pointed out in Serneels and Verpoorten (2015), economic theory is not consensual about the effect of conflict on growth. The standard neoclassical growth theory suggests that in the years after civil conflict, an economy could grow relatively fast and converge to its steady state. By contrast, alternative models argue that this catch-up effect could take a long time or that countries may be trapped in a situation with both conflict and dismal performance (Serneels and Verpoorten 2015: 556). Additional, one may think of China and India as examples of countries that may show a positive correlation between levels of political violence and growth rates.
Finally, the coefficients obtained for the interaction term between state ineffectiveness and political violence do not suggest that the effect of state ineffectiveness (or political violence) on economic growth in a country depends on the level of political violence (or state ineffectiveness). 7 Conclusions and implications
This paper presents new evidence on the impact of state fragility on economic growth. Despite existing accounts of the weight that state fragility bears on economic development provided by the reports of development agencies and previous studies, there is a relative scarcity of empirical work on this topic that makes use of cross-country regressions. To the best of the author’s knowledge, this is the first analysis which shows that considering the two distinct aspects of state fragility unveils a link between fragility and growth, which is not necessarily visible if a unidimensional index is considered.
Following the tradition in the cross-country growth literature, this paper explores the effect on growth of the two dimensions of state fragility identified in Besley and Persson’s (2011) theoretical model – state ineffectiveness and political violence. This is in line with previous literature considering the impact of related aspects, such as institutions, governance, or state capacity, as well as political violence, but aims to fill the gap that still exists in the studies focusing explicitly on the concept of fragile states.
The results from applying OLS to data for period 1993–2012 show a robust negative and significant impact of state ineffectiveness on growth, but no significant effect for political violence. These distinct effects concur to the view that in order to unpack the complexity of state fragility and its effects, one should consider its different dimensions. This was further corroborated by the fact that, when using a unidimensional index of fragility, one failed to find a consistent effect of this variable on growth.
This paper suggests a way forward. One of the main concerns of development agencies is the effectiveness of development assistance—especially in the case of fragile states—as demonstrated in recent reports. The measurement tools for state fragility proposed in this paper provide a new opportunity to examine how different dimensions of state fragility interact with the impact of aid on economic growth.
References
Acemoglu, D., S. Johnson, and J.A. Robinson (2001). 'The Colonial Origins of Comparative Development: An Empirical Investigation'. American Economic Review, 91(5): 1369-401.
Aisen, A., and F.J. Veiga (2013). 'How does political instability affect economic growth?'. European Journal of Political Economy, 29, 151-67.
Alesina, A., A. Devleeschauwer, W. Easterly, S. Kurlat, and R. Wacziarg (2003). 'Fractionalization',
Journal of Economic Growth, 8(2), 155-94.
Arezki, R., and M. Bruckner (2011). 'Food Prices and Political Instability'. Working Paper WP/11/62. Washington, DC: IMF.
Bardhan, P. (2016). 'State and Development: The Need for a Reappraisal of the Current Literature',
Journal of Economic Literature, 54(3), 862-92.
Barro, R.J. (1991). 'Economic Growth in a Cross Section of Countries', Quarterly Journal of Economics, CVI(425), 407-43.
Barro, R., and J-W. Lee (2013). 'A New Data Set of Educational Attainment in the World, 1950-2010', Journal of Development Economics, 104, 184-98.
Bellemare, M.F. (2014). 'Rising Food Prices, Food Price Volatility, and Social Unrest', American Journal of Agricultural Economics, 97(1), 1-21.
Bertocchi, G., and A. Guerzoni (2010). 'The fragile definition of state fragility', Working Paper 43. Modena: RECent.
Besley, T., and T. Persson (2011). 'Fragile States and Development Policy', Journal of the European Economic Association, 9(3), 371-98.
Biswas, A., C. O'Reilly, J.T. Bang, and A. Mitra (2016). 'Civil war and economic growth: the case for a closer look at forms of mobilization', Applied Economics Letters, 23(15), 1057-61.
Blattman, C., and E. Miguel (2010). 'Civil War', Journal of Economic Literature, 48(1), 3-57.
Bockstette, V., A. Chanda, and L. Putterman (2002). 'States and Markets: The Advantage of an Early Start', Journal of Economic Growth, 7, 347-69.
Bodea, C., and I.A. Elbadawi (2008). 'Political Violence and underdevelopment', Journal of African Economies, 17(AERC Supplement 2), ii50-ii96.
Bosworth, B.P., and S.M. Collins (2003). 'The Empirics of Growth: An Update', Brookings Papers on Economic Activity, 2, 113-206.
Bove, V., L. Elia, and R.P. Smith (2017). 'On the heterogeneous consequences of civil war', Oxford Economic Papers, 69(3), 550-68.
Breusch, T. S., and A.R. Pagan (1980). 'The Lagrange Multiplier Test and its Applications to Model Specification in Econometrics', The Review of Economic Studies, 47(1, Econometrics Issue (Jan.,
1980), 239-53.
Carmignani, F. (2003). 'Political instability, uncertainty and economics', Journal of Economic Surveys,
17(1), 1-54.
Cerra, V., and S.C. Saxena (2008). 'Growth Dynamics: The Myth of Economic Recovery', American Economic Review, 98(1), 439-57.
Chauffour, J-P. (2011). 'On the Relevance of Freedom and Entitlement in Development'. Policy Research Working Paper 5660, Washington, DC: World Bank.
Chauvet, L., Collier, P., and A. Hoeffler (2007). 'The Cost of Failing States and the Limits to Sovereignty', Research Paper No. 2007/30, Helsinki: UNU-WIDER.
Chen, B., and Y. Feng (1996). 'Some political determinants of economic growth: Theory and empirical implications', European Journal of Political Economy, 12, 609-27.
Cingolani, L. (2013). 'The State of State Capacity: a review of concepts, evidence and measures', Working Paper Series 2013-53, Maastricht: UNU-MERIT.
Cingranelli, D.L., D.L. Richards, and K.C. Clay (2014). 'The CIRI Human Rights Dataset'. Available at www.humanrightsdata.com (accessed 28 May 2015).
Clemens, M.A., S. Radelet, R.R. Bhavnani, and S. Bazzi (2012). 'Counting Chickens when they Hatch: Timing and the Effects of Aid on Growth', Economic Journal, 122(561), 590-617.
Collier, P. (1999). 'On the Economic Consequences of Civil War', Oxford Economic Papers, 51(1,
Symposium on Trade, Technology, and Growth), 168-83.
Collier, P., and A. Hoeffler (2004). 'Greed and grievance in civil war', Oxford Economic Papers-New Series, 56(4), 563-95.
Databanks International (2009). 'Cross National Time Series Data Archive, 1815–2007'. Jerusalem: Databanks International. Available at www.databanksinternational.com (accessed 30 Jan 2018).
Dincecco, M., and M. Prado (2012). 'Warfare, fiscal capacity, and performance', Journal of Economic Growth, 17(3), 171-203.
Evans, P., and J.E. Rauch (1999). 'Bureaucracy and Growth: A Cross-National Analysis of the Effects of ‘Weberian’ State Structures on Economic Growth', American Sociological Review,
64(5), 748-65.
Feenstra, R.C., R. Inklaar, and M.P. Timmer (2015). 'The Next Generation of the Penn World Table', American Economic Review, 105(10), 3150-82.
Ferreira, I.A. (2017). 'Measuring state fragility: a review of the theoretical groundings of existing approaches', Third World Quarterly, 38(6), 1291-309.
Food and Agriculture Organization (2016). 'FAO - Food Security Indicators'. Rome: FAO.
Available at: www.fao.org/economic/ess/ess-fs/ess-fadata/en/#.WkzFQSOtE_U
(accessed 26 June 2017).
Fosu, A.K. (2002). 'Political Instability and Economic Growth: Implications of Coup Events in Sub-Saharan Africa', The American Journal of Economics and Sociology, 61(1), 329-48.
Frankel, J.A., and D. Romer (1996). 'Trade and Growth: An Empirical Investigation'. Working Paper 5476, Cambridge, MA: NBER.
Frot, E., and M. Perrotta (2012). 'Aid effectiveness: New instrument, new results?'. Stockholm: School of Economics. Available at: https://www.google.co.uk/url?sa=t&rct=j&q= &esrc=s&source=web&cd=1&ved=0ahUKEwjejrWn5LHZAhVmKcAKHaT7BTEQFggq MAA&url=https%3A%2F%2Fstaffstream.hhs.se%2Fpublic%2Fstreamdocument.ashx%3F
dl%3D02553_001&usg=AOvVaw1jTQGYWPBe8jcSXDN5zcja (accessed 19 February
2018).
Fuller, W.A. (1977). 'Some Properties of a Modification of the Limited Information Estimator',
Econometrica, 45(4), 939-53.
Gibney, M., L. Cornett, R. Wood, and P. Haschke (2013). 'Political Terror Scale 1976-2014'. Re-trieved, from the Political Terror Scale website: www.politicalterrorscale.org/Data/ Files/PTS2014.xls (accessed 02 July 2015).
Gleditsch, N.P., P. Wallensteen, M. Eriksson, M. Sollenberg, and H. Strand (2002). 'Armed Conflict 1946-2001: A New Dataset', Journal of Peace Research, 39(5), 615-37.
Gravingholt, J., S. Ziaja, and M. Kreibaum (2015). 'Disaggregating state fragility: a method to establish a multidimensional empirical typology', Third World Quarterly, 36(7), 1281-98.
Hadi, A.S. (1992). 'Identifying Multiple Outliers in Multivariate Data', Journal of the Royal Statistical Society. Series B (Methodological), 54(3), 761-71.
Hall, R., and C. Jones (1999). 'Why Do Some Countries Produce So Much More Output per Workers Than Others?', The Quarterly Journal of Economics, 114, 83-116.
Humphreys, M. (2003). 'Economics and Violent Conflict', essay for Conflict Prevention Initiative.
Available at: www.unglobalcompact.org/docs/issues_doc/Peace_and_Business/
Economics_and_Violent_Conflict.pdf (accessed 15 June 2017).
Jalilian, H., C. Kirkpatrick, and D. Parker (2007). 'The Impact of Regulation on Economic Growth in Developing Countries: A Cross-Country Analysis', World Development, 35(1), 87-103.
Jong-A-Pin, R. (2009). 'On the measurement of political instability and its impact on economic growth', European Journal of Political Economy, 25, 15-29.
Kennedy, P. (2008), A Guide to Econometrics. Hoboken, New Jersey: Wiley-Blackwell.
Knack, S., and P. Keefer (1995). 'Institutions and economic performance: Cross-country tests using alternative institutional measures', Economics and Politics, 7(3), 207-27.
Londregan, J.B. and K.T. Poole (1990). 'The Coup Trap, and the Seizure of Executive Power',
World Politics, 42(2), 151-83.
Maier, R. (2010). ‘Growth and Equity in Fragile States’. The Hague: Netherlands Institute of International Relations 'Clingendael'.
Marshall, M.G. (2015). 'Armed Conflict and Intervention (ACI) - Major Episodes of Political Violence (MEPV) and Conflict Regions, 1946-2014'. Available at:
http://www.systemicpeace.org/inscrdata.html (accessed 02 July 2015).
Marshall, M.G., T.R. Gurr, and B. Harff (2015). PITF Codebook 2014, Vienna, V.A.:
Societal-Systems Research Inc.
Marshall, M.G. and D. Ramsey Marshall (2015). 'Coup d'État Events, 1946-2014'. Available at:
http://www.systemicpeace.org/inscrdata.html (accessed 02 July 2015).
Mendez, F., and F. Sepulveda (2006), 'Corruption, growth and political regimes: Cross country evidence', European Journal of Political Economy, 22, 82-98.
Miguel, E., S. Satyanath, and E. Sergenti (2004), 'Economic Shocks and Civil Conflict: An Instrumental Variables Approach', Journal of Political Economy, 112(4), 725-53.
Miller, T., K. Holmes, and A. Kim (2015). 'Index of Economic Freedom'. Available at:
www.heritage.org/index/excel/2015/index2015_data.xls (accessed 30 June 2015).
Murdoch, J.C. and T. Sandler (2004). 'Civil Wars and Economic Growth: Spatial Dispersion',
American Journal of Political Science, 48(1), 138-51.
Nunn, N. (2009). 'The Importance of History for Economic Development', Annual Review of Economics, 1, 65-92.
Organski, A.F.K., and J. Kugler (1977). 'The Costs of Major Wars: The Phoenix Factor', The American Political Science Review, 71(4), 1347-66.
Pettersson, T., and P. Wallensteen (2015). 'Armed conflicts, 1946-2014', Journal of Peace Research,
52(4), 536-50.
Rajan, R.G., and A. Subramanian (2008). 'Aid and Growth: What does the cross-country evidence really show?', Review of Economics and Statistics, 90(4), 643-65.
Ricciuti, R., A. Savoia, and K. Sen (2016). 'How do political institutions affect fiscal capacity? Explaining taxation in developing economies'. Working Paper No. 59, Manchester: ESID. Rodrik, D., A. Subramanian, and F. Trebbi (2002). 'Institutions rule: The primacy of institutions
over geography and integration in economic development'. Working Paper WP/02/189, Washington, DC: IMF.
Roodman, D. (2007). 'The Anarchy of Numbers: Aid, Development, and Cross- country Empirics', The World Bank Economic Review, 21(2), 255-77.
Sachs, J., and A. Warner (1995). 'Economic Reform and the Process of Global Integration',
Brookings Papers on Economic Activity, 1, 1-118.
Sala-i-Martin, X., G. Dopperlhofer, and R.I. Miller (2004). 'Determinants of Long-Term Growth: A Bayesian Averaging of Classical Estimates (BACE) Approach', The American Economic Review, 94(4), 813-35.
Savoia, A. and K. Sen (2015). 'Measurement, evolution, determinants, and consequences of state capacity: a review of recent research', Journal of Economic Surveys, 29(3), 441-58.
Serneels, P., and M. Verpoorten (2015). 'The Impact of Armed Conflict on Economic Performance: Evidence from Rwanda', Journal of Conflict Resolution, 59(4), 555-92.
Staiger, D. and J. Stock (1997). 'Instrumental Variables Regression with Weak Instruments',
Econometrica, 65(3), 557-86.
Stiglitz, J. (2002). Globalization and its discontents. London: Penguin Books.
Teorell, J., S. Dahlberg, S. Holmberg, B. Rothstein, A. Khomenko, and R. Svensson (2016). 'The Quality of Government Standard Dataset, version Jan16'. Gothenburg: University of Gothenburg. Available at: https://qog.pol.gu.se/data/datadownloads/qogstandarddata
(accessed 29 January 2016).
Wacziarg, R., and K.H. Welch, (2003). 'Trade Liberalization and Growth: New Evidence', Working Paper 10152, Cambridge, MA: NBER.
World Bank (1997). 'Chapter 1 - The Evolving Role of the State'. In World Bank, WDR 1997: The State in a Changing World. New York: Oxford University Press.
--- (1998). Assessing Aid: What Works, What Doesn't and Why, Washington, DC: The World Bank.
--- (2015a). 'Worldwide Governance Indicators (WGI)'. Available at: http://info.worldbank.org/
governance/wgi/index.aspx#home (accessed 30 June 2015). Washington, DC: The World
Bank.
--- (2015b). 'Doing Business project'. Available at: www.doingbusiness.org/data/exploretopics/ enforcing-contracts (accessed 30 June 2015). Washington, DC: The World Bank.
--- (2016). 'World Bank Databank'. Available at: https://data.worldbank.org/indicator (accessed 30 April 2016). Washington, DC: The World Bank.