COLOUR PROFILE ANALYSIS OF PORT WINES BY DIFFERENT INSTRUMENTAL AND VISUAL METHODS
COLOUR ANALYSIS OF PORT WINES BY INSTRUMENTAL AND VISUAL METHODS
Francisco Almeida Garrett Soares-da-Silva(a)*, Francisco Manuel Campos(a), Manuel Lima Ferreira(b), Natália Ribeiro(b), Bento Amaral(b), Tomás Simões(b), Cristina Luísa
Miranda Silva(a)
(a) CBQF - Centro de Biotecnologia e Química Fina – Laboratório Associado, Escola Superior de Biotecnologia, Universidade Católica Portuguesa, Rua Arquiteto Lobão
Vital 172, 4200-374 Porto, Portugal
(b) IVDP – Instituto dos Vinhos do Douro e Porto, Rua de Ferreira Borges 27, 4050-253 Porto, Portugal;
*Corresponding author e-mail address: francisco.agss@gmail.com
This article has been accepted for publication and undergone full peer review but has not been through the copyediting, typesetting, pagination and proofreading process, which may lead to differences between this version and the Version of Record. Please cite this article as doi: 10.1002/jsfa.9577
ABSTRACT
BACKGROUND: Wine colour is an important quality parameter, being the first sensorial attribute evaluated during wine tasting. The perception of wine colour can be different depending on many factors, including the depth of the sample under observation. The main objectives of the present study were to measure the colour of Port wines, using CIE L*a*b* parameters at different depths with different instrumental techniques (spectrophotometry and colorimetry), and to compare the obtained results with the sensory (visual) perception of colour samples.
RESULTS: Representative profiles of Lightness (L*), Hue (H*) and Chroma (C*) at different depths were obtained using Port wine samples from different categories and ages. In general, relatively good correlations between the colorimetric and spectrophotometric methods were obtained for the L* and H* parameters. The results of the sensory tests also showed good correlations between the visually-assessed hue scores and the colorimetric measurements of the H* parameter, particularly at the lower depths tested (up to 4.0 mm).
CONCLUSIONS: Overall, the results indicate that the colorimetric method can be used for estimating wine colour parameters, providing useful information about the colour profile of wines at different depths.
KEYWORDS
Wine; Port; colour; colorimetry; sensory analysis
1. INTRODUCTION
Colour is an important quality parameter in wines, being one of the first evaluated attributes during wine tasting. Wine colour is the result of a complex mixture of pigments, which changes over time, due to chemical reactions between themselves and also with oxygen and other wine components.
From a sensorial perspective, colour is the visual perception of the refracted or reflected radiation from an object under a specific light source [1]. Wine colour is normally assessed visually in a standard glass tilted at an approximate 45º angle, where the wine adopts an oval shape. Since wine is a translucent product, its colour perception depends on the observed depth in the glass [2,3,4]
Port wine, a fortified wine produced exclusively in the Douro Demarcated Region in Portugal, can have many distinctive colours, depending on the particular style, which is mainly related to its ageing process. Ruby-style Ports are kept (mostly or exclusively) in the bottle during the ageing process, which results in a more or less intense evolution of their deep red colour, depending on age and style. In this type of wines, in ascending order of quality (and usually of price range), the following official categories are found: Ruby, Ruby Reserve, Late Bottled Vintage (LBV), Crusted and Vintage. Tawny-style Ports, on the other hand, are kept in wood casks for ageing, having more orange/yellow hues comparatively to Ruby-style wines. Tawny Ports are branded in the following official categories: Tawny, Tawny Reserve, 10-years old, 20-years old, 30-years old, 40-years old and “Colheita”, which is a wine from a single harvest. Except for Vintage and Colheita, all other Port styles normally result from blends of wines of different age, which are later classified in the previously-described categories.
Different pigments are responsible for the colour of red wines, anthocyanins and their derivatives being the most important ones [5,6,7]. During the winemaking process, anthocyanins react with flavonoids and yeast metabolites, forming polymeric pigments, in a process known as co-pigmentation [8,9]. The decrease of anthocyanins concentration and formation of orange-brown polymeric pigments is believed to be associated with the colour change observed in Port wine during ageing. In wines aged in wood casks, several reactions occur between anthocyanins and oxygen (due to the controlled oxidation during the ageing process) and with other wood components [10,11,12]. Oxidation reactions normally occur at a slower rate in wines aging in bottle, which accounts for the colour differences found between Ruby-style and Tawny-style wines [8,11,13].
Spectrophotometric methods have traditionally been used to characterize the colour of a particular wine or to compare the colour of different wines. The current OIV (Office International de la Vigne et du Vin) reference method for wine colour analysis is based on the measurement of the transmittance spectrum in the UV-Visible range and on the mathematical calculation of the tristimulus values using the 1976 CIE (Commission International de l’Ecláirage) L*a*b* colour model [14]
Besides spectrophotometric analysis, other techniques like spectroradiometry or image analysis have recently been used to measure wine colour. These instrumental techniques have several advantages over spectrophotometry, allowing for the analysis of samples at different depths and angles, thus simulating more closely the visual experience of the observer.
Martínez et al. [15] compared wine colour measurements obtained by spectroradiometry and spectrophotometry and observed differences between the two methods at different depths, which were mainly attributed to different sample
thicknesses, illumination setups and glass type interferences. Huertas et al. [3] measured wine colour with a spectroradiometer at regularly-spaced points of a wine sample poured in a standard glass and found significant differences in the Lightness (L*) and Chroma (C*) parameters, but non-significant changes in the Hue (H*) parameter, depending on the area being measured. In another work, Martin et al. [4] used a digital camera and a tele-spectroradiometer to measure wine colour at different depths, observing good correlations between the results obtained with these two methods.
Defining wine colour is a complex subject, since many factors need to be taken into account. Most previous studies published so far were undertaken with still (table) wines and the information regarding the colour profiles of Port wines of different style is scarce. Also, most published studies about Port wine colour to date [5,16,17,18] were focussed on the physical-chemical characterization of colour, but lack a sensory (visual) evaluation of wine colour. Given the importance of colour in classifying Port wines (and establishing its age) and standardizing colours a more comprehensive method of analysis of Port wine colour could be helpful for Port wine producers and for regulatory authorities.
The main objectives of the present study were to use different spectroscopic techniques (spectrophotometry and colorimetry) to measure the colour of Port wines using CIE L*a*b* parameters at different depths, and to compare the results with the visual (colour) perception of the same wines.
2. MATERIAL AND METHODS
2.1 Samples
Two sets of Port wine samples were used for the colour profile analysis. The
first set consisted of 39 samples of different ages and categories: 15 Ruby-style Ports (four “Ruby, three “Ruby Reserve”, five “LBV 2011”, one “Vintage 2013” and two “Vintage 2002”) and 24 Tawny-style Ports (six “Tawny”, one “Tawny Reserve”, eight “10-year old”, three “20-year old”, one “40-year old” and five “Colheita” from the 1940, 1963, 1975, 1994, and 2001 harvests).
The second set consisted of 41 Port wine samples of different ages and categories: 20 Ruby-style Ports (five “Ruby, five “Ruby Reserve”, two “LBV 2011”, two “LBV 2010”, one “LBV 2009”, two “Vintage 2013” and three “Vintage 2014) and 21 Tawny-style Ports (five “Tawny”, five “Tawny Reserve”, five “10-year old”, two “20-year old”, two “30-year old”, one “40-year old” and one “Colheita” from the 1995 harvest). Only this second set was used for the sensory (visual) assessment of colour.
These samples were selected as representative of the different Port wine styles and were kindly supplied by IVDP (Instituto dos Vinhos do Douro e Porto).
2.2. Colour analysis
2.2.1 Spectrophotometric (UV-VIS) measurements
For the spectrophotometric measurement of wine colour, a Helios Alpha UV-Vis double-beam spectrophotometer from Thermo-Scientific (Waltham, MA, USA) was used. Samples were transferred to a 1.0 mm path-length quartz cuvette and the transmittance spectrum at wavelengths between 300 and 800 nm was recorded (at 1 nm intervals), using distilled water as blank. The theoretical transmittance values at other path-lengths (2.0, 3.2, 4.0, 4.8 and 6.0 mm) were calculated from the 1.0 mm path-length readings using the Beer-Lambert-Bouguer law equation Abs = -log10(T) =
abc, where Abs represents absorbance, T the transmittance, a the molar absorptivity, b the path-length of the cuvette and c the concentration of absorbing pigments in the sample. The obtained transmittance results were converted mathematically to the CIE tristimulus values X, Y, Z (assuming a D65 illuminant and an observation angle of 10º) which were thereafter used to calculate the CIE L*a*b* parameters according to the OIV reference method (OIV, 2006).
2.2.2. Colorimetric measurements
The colorimetric (reflectance) measurements were performed using a Konica Minolta (Tokyo, Japan) CR-400 colorimeter using D65 as the reference illuminant. A prior calibration of the colorimeter (blank reading) was performed using the white calibration tile provided with the equipment as background. Different volumes of Port wine samples (2.5, 4.0, 5.0, 6.0 and 7.5 mL) were transferred using a graduated pipette to a glass Petri dish (with a diameter of 4.0 cm) in order to measure colour at different depths (2.0, 3.2, 4.0, 4.8 and 6.0 mm, respectively). The Petri dish containing the sample was placed over the white calibration tile and placed directly
above it in a fixed horizontal position. Measurement of the CIE L*a*b* colour parameters was made in triplicate for each wine sample, with three seconds of interval between replicates. The triplicates values of each wine sample was averaged. For the colorimetric results the wines classified on the same age category were averaged, with the exeption of the wines from “Colheita”, which were considered individuallly.
2.2.3. CIE colour parameters
The CIE L*a*b* colour system was used to characterize colour in both spectrophotometric and colorimetric methods, using the parameters L*, a* and b* where L*, represents the clarity/luminosity of the subject (L*= 0 corresponds to black, and L*= 100 corresponds to white), a* represents the red/green colour component (wherein a*> 0 red, and a* <0 green) and b* represents the blue/yellow colour component (b*> 0 yellow, b*< 0 blue). From the a* and b* values, the parameters Chroma or colour purity (C*), and Hue angle (H*) were calculated using the following formulae: C* =(a*2+b*2)1/2 ; H* = arctan(b*/a*) (OIV, 2006).
2.3 Visual assessment of wine colour
Twelve naïve (untrained) panellists were asked to assess the colour of the Port wine samples placed in Petri dishes at the same depths used for the colorimetric measurements in order to correlate colorimetric readings with human colour perception. Two sample sets were made, one for Ruby-style wines (five “Ruby, five “Ruby Reserve”, two “LBV 2011”, two “LBV 2010”, one “LBV 2009”, two “Vintage 2013” and three “Vintage 2014) and another for Tawny-style wines (five “Tawny”, five “Tawny Reserve”, five “10-year old”, two “20-year old”, two “30-year old” and one “40-year old”). For each sample set, five linear scale tests were performed (each linear test represent one established depth), where the untrained panellists were asked to assess all the samples in terms of hue in order to compare the scores with the results obtained in the colorimetric readings at the same depths. The sensory test consisted of placing the Petri dishes on an unstructured (one-meter) horizontal linear scale according to their hue (H*), using two “anchor” samples in the extremities of the scale, representing the lowest and highest values of hue (H*) previously measured by colorimetric readings, for each sample set. The distance between each sample and the left anchor (corresponding to the lowest H*) was measured using a ruler. All sensorial assays were performed using a white background under controlled light conditions (D65 equivalent lighting, T=6500 K) in a standard sensory analysis room and the samples were presented randomly to each untrained pannelist.
2.4. Statistical analysis
A multivariate statistical analysis was performed in order to analyse the similarities of different Port wines. To accomplish this, a Principal Component
Analysis (PCA) using Varimax Rotation with Kaiser normalization was done using the L*, H* and C* parameters obtained with the colorimeter at different depths. A Linear Discriminant Analysis (LDA), using the Stepwise method and Wilks’ lambda, was also performed to assess which variables were more important for discrimination the Port wine samples into different categories. The default statistical confidence level was considered to be 99% (p<0.01) in all tests. All statistical analyses were done with SPSS Statistics software (IBM, Armonk, NY) version 23.
3. RESULTS
3.1. Colorimetric results
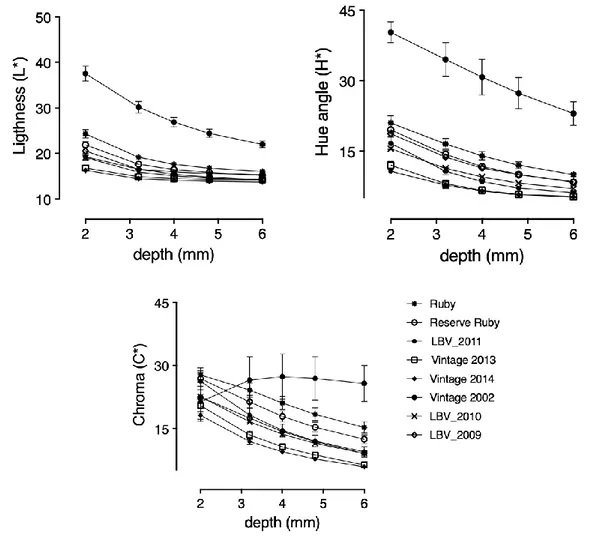
The chromatic characteristics of the Ruby-style Port wine samples measured at different depths are depicted in Figure 1.
Figure 1 here please
A decrease in Lightness (L*) and Hue (H*) parameters was observed with increasing depth in all Ruby-style samples (Figure 1). As expected, Vintage Ports from relatively recent harvests, such as 2013 and 2014, had darker (lower L*) and redder colours (lower H* values), followed by LBV 2011 and 2010, with similar colours, LBV 2009, Reserve Rubys and standard Rubys. The older 2002 Vintage Port samples showed higher values of L* and H* comparatively to the other Ruby-style categories. As for the Chroma (C*) parameter, a decrease was observed in most Ruby samples with increasing depth, except for the 2002 Vintage Port samples which showed an increase in C* up to 4.0 mm depth followed by a decrease at
higher depths (Figure 1). Specifically, Vintage 2002 presents a very different behaviour in terms o L*H*C* parameters, which could be explained with the fact that this particular wine is the most aged among Ruby styled wines having greater loss of colour is resulted by formation of polymeric pigents thorugh oxidation through the ageing of a wine. In general Ruby styled wines are less aged than the tawny styled wines Therefore, the colour of vintage 2002 will be different from Ruby port wines and similar to tawny port wines.
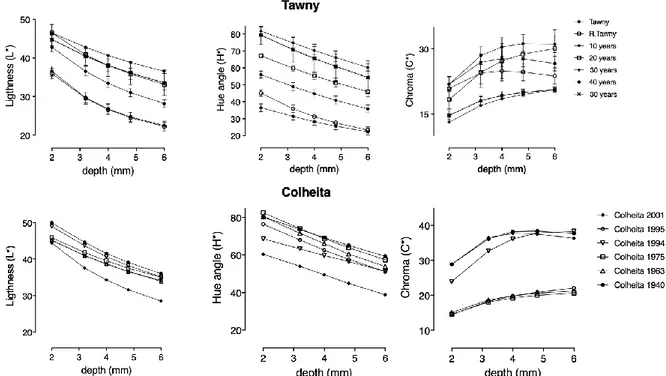
Figure 2 here please
The results obtained in the colorimetric analysis of Tawny-style Port wines are shown in Figure 2. The results show a clear distinction between the different categories and an increase in darkness (lower L*), redness (lower H*) and higher colour purity (higher C*) with increasing depth (Figure 2). Higher H* values were obtained for older Tawny Port wines, as expected. In the Colheita samples, however, there were similarities in the hue of older wines from the 1940, 1975 and 1963 harvests (Figure 2).
Wines from standard Tawny and Tawny Reserve categories had their highest Chroma (C*) values at 4.0 mm depth, whereas Tawnies with an age indication (10-, 20- and 40 years-old) and Colheitas (from the 1940, 1963, 1975, 1994 and 2001 harvests) had their highest C* values at 6.0 mm depth (Figure 2).
3.2. Comparison of transmittance and reflectance results
To understand the magnitude of the differences between the spectrophotometric (transmittance) and the colorimetric (reflectance) methods,
correlations were used to compare readings of the same samples at the same depths (Table 1).
Table 1 here please
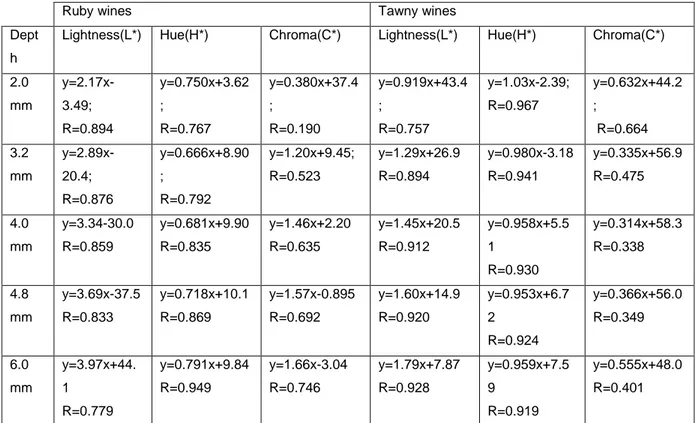
Good linear correlations were obtained for the L* values obtained from spectrophotometric and colorimetric methods. For Ruby-style wines, the spectrophotometric results gave much higher L* values than the colorimetric values (by a factor of 2 to 4, obtained from the slope values) (Table 1). These results were expected since in the spectrophotometric method the light source is positioned in front of the detector, increasing the (measured) luminosity of the sample, while in the colorimeter the measured radiation is the radiation reflected by the sample to the detector, which is in an adjacent position to the light source. On the other hand, in Tawny-style wines the Pearson’s correlation coefficient (R) and the slope of the linear correlations increased with depth, with a slope value close to 1 at depths between 2.0 and 3.2 mm and increasing at higher depths, indicating that the values obtained by both methods were similar at these depths (Table 1).
Concerning the hue parameter (H*), good correlations were also obtained between the two methods (particularly in Tawny-style wines), with slope values close to 1 in the case of Tawny-style wines and somewhat lower in the case of Ruby-style wines. A decrease in R with depth in Tawny-style wines (from 0.967 to 0.919) and an increase with depth in Ruby-style wines (from 0.767 to 0.949) was also observed (Table 1).
Finally, relatively poor correlations were observed in the Chroma parameter (C*) obtained with both methods. An increase in slope (and correlation coefficient)
with depth was observed in Ruby-style wines, while a decrease up to 4.0 mm depth was observed in Tawny-style wines (Table 1).
3.3. Visual assessment of wine colour
A Visual assessment of wine colour approach allowed the study of both the visual classification order of each sample according to its colour, and of the dispersion of the visual scores.
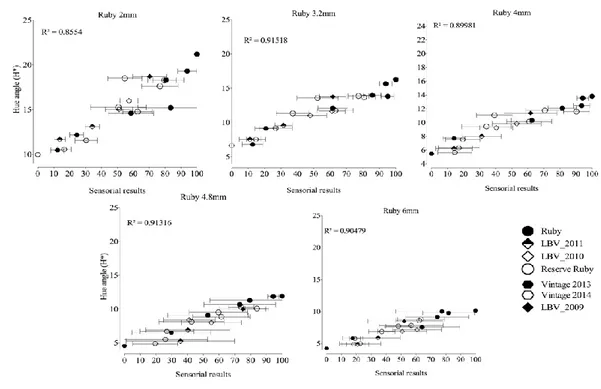
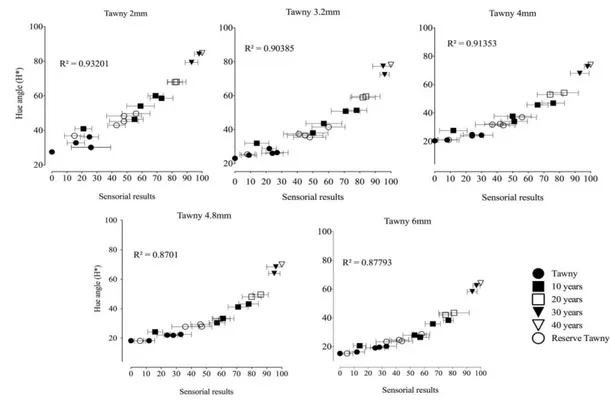
The relationship between the visual scores obtained from the sensorial assessment and the H* values obtained by colorimetry for Ruby- and Tawny-style wines are depicted in Figures 3 and 4, respectively.
Figure 3 here please
Figure 4 here please
As shown in Figure 3, a linear correlation between the visually perceived colour hue and the H* parameter measured by the colorimeter can be observed for Ruby-style wines at all tested depths. However, in Tawny-style wines a non-linear pattern was observed, indicating that the panellists used the scale in a non-linear manner for more aged wines (with higher H* values), particularly at higher depths (Figure 4). Higher linear correlations were found at greater depths (4.8mm and 6.0 mm) in Ruby-style wines (Figure 3) and at shallower depths (2.0 mm to 4.0 mm) in Tawny-style wines (Figure 4).
Regarding the dispersion of the visual scores, the panel was able to make a better distinction between the Tawny-style wines than the Ruby-style wines, as
shown by the lower standard deviations in the sensorial scores (Figures 3 and 4). In Ruby-style wines, only at lower depths (2.0 to 4.0 mm) there was some degree of consensus (lower standard deviations) between the colour classifications by the panellists (Figure 3).
3.4. Statistical analysis
Different physical-chemical and sensorial parameters are normally used to discriminate different categories of Port wines. Although it was not the objective of this study to discriminate categories of Port according to their colour alone, a multivariate analysis of the results was performed in order to evaluate a possible discriminatory power of the CIELab colour parameters (L*, C and *H*) using the colorimetric method.
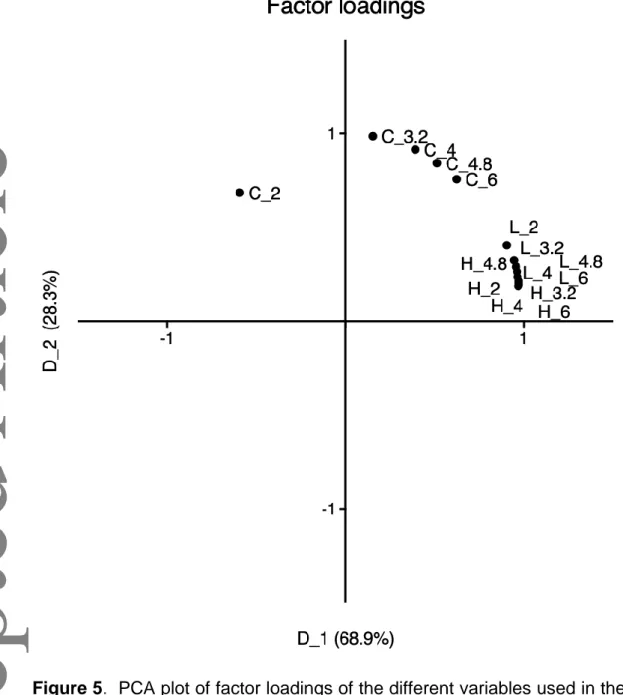
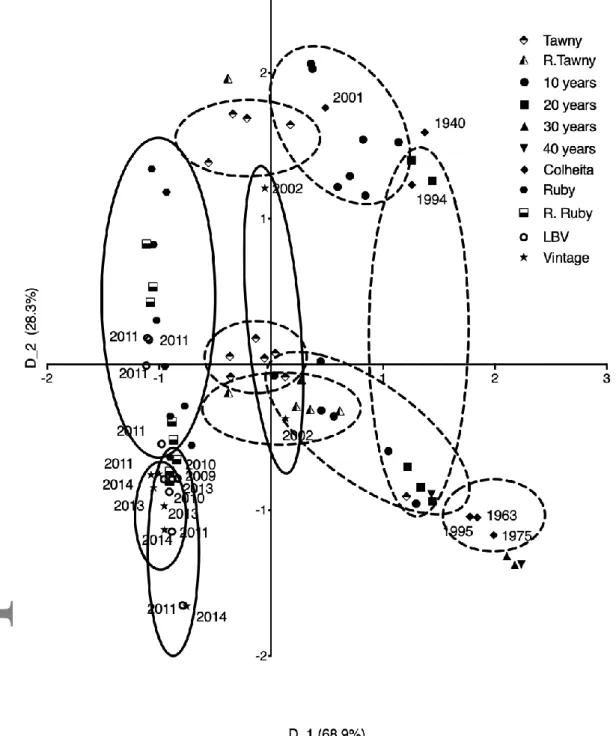
A Principal Component Analysis (PCA) was done using the L*, H* and C* colour parameters obtained from the colorimetric measurements. Two components were extracted: the first (horizontal) component explained 68.9% of the variance of the results, while the second (vertical) component explained 28.3%, giving a total 97.2% explained variance (Figures 5 and 6). The first component was found to be mostly influenced by the lightness (L*) and hue (H*) parameters, while the second one was mostly affected by Chroma (C*) at different depths (Figure 5). The proximity of the factor loadings of L* and H* suggests that these parameters are highly correlated. On the other hand, the C* parameter values at different depths were more spread, with C* at 2.0 mm depth having the lowest factor loading on the first component.
The first component allowed a clear discrimination between Tawny- and Ruby-style Ports (Figure 6). Moreover, the first component also allowed to distinguish
between Tawny-style Ports of different ages and categories, suggesting that L* (lightness) and H* (hue) are the most important parameters for distinguishing wines of these categories. On the other hand, Ruby styles of Port were more discriminated by the second component (Chroma or C* values) (Figure 5 and 6).
Figure 5 here please
Figure 6 here please
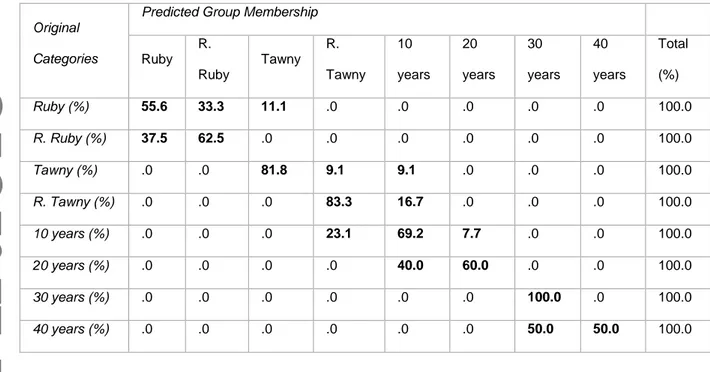
A Linear Discriminant Analysis (LDA) was also performed using the L*, H* and C* colour parameters obtained at the different depths tested. In this analysis “Colheita”, “LBV” and “Vintage” samples were not used, since at least two samples from the same year were necessary. Therefore, the model was only applied to wines of the Ruby, Ruby Reserve, Tawny, Tawny Reserve and Tawny with age indication (10-, 20-, 30- and 40-year old) categories. Before LDA, a Box’s M test was performed to analyse the similarity of variance-covariance matrices from the different wine samples. The results showed differences in the dispersion between Port wine categories (p<<0.01), which was expected since the number of Port wine samples per category was unequal while some categories (such as 10-year old Tawny Ports) were known to have greater variations in colours than others.
The normality of the distribution was tested using a parametric (Shapiro-Wilks) and a non-parametric test (Kolmogorov-Smirnoff). The two tests gave conflicting results: in the Shapiro-Wilks test normality for the first discriminant function (D1) was rejected (p=0.003) but not for the second function (p=0.011); on the other hand, the results of the Kolmogorov-Smirnoff test indicated that the first function (D1) followed a normal distribution (p=0.019) while the second (D2) did not (p=0.001). However, since the number of samples used (n=56) is above 50, it was assumed that the variables approach asymptotically a normal distribution. Using the Wilks' Lambda criteria, it was confirmed that the first two functions were highly discriminating (p<<0.01) and that the first discriminant function (F1) explained 72.3% of the total variability among groups, while the second function (F2) explained 25.9% of inter-group variance (for a total of 98.3% of the total variability explained by the mathematical model).
Equation 1: Discriminant function 1 (F1)
Equation 2: Discriminant function 2 (F2)
The most discriminant variable for function F1 was colour hue at 2.0 mm depth, followed by hue at 4.8 mm depth, whereas for function F2 the most discriminant variable was lightness variable at 2.0 mm depth and hue at 4.8 mm depth. Using both discriminant functions (F1 and F2), an internal cross-validation with the same samples used for the model was made in order to perceive the accuracy of discrimination of the discriminant functions, which resulted in 69.6 % of the original grouped cases (samples) being correctly classified in the different Port wines categories. In general, Tawny-style wines had higher correct classification scores than Ruby-style wines (Table 2). The categories that had poorer classification scores were standard Ruby (55.6%) and 20-year old Tawny (60.0%), with some categories (notably Ruby and Tawny categories and 10-year old Tawny) showing higher dispersion of results than others (Table 2).
Table 2 here please
4. DISCUSSION
Port wines from different categories are known to differ in transparency, colour intensity and tonality. Ruby Ports are normally more opaque and more intensely coloured than Tawny Ports, since they have a naturally higher pigment concentration. The colour hue or tonality ranges from deep red (in Ruby wines) to light gold (in Tawny wines).
From the results obtained in this work, it can be observed that the lightness (L*) parameter did not allow to differentiate well wines within the different Ruby-style categories of wines, since all samples presented similar L* values at all depths with exception of vintage 2002 category which presented different among Ruby styled wines (Figure 1). However, there were visible differences in the H* and C* parameters between wines of different categories, which also changed particularly at lower depths (2.0, 3.2 and 4.0 mm). A very different behaviour was observed in the older Vintage 2002 sample, which showed a more similar pattern to Tawny wines, with an increase in Chroma (C*) up to 4.0 mm depth and a decrease at higher depth.
Light transmission and scattering usually occur in translucent materials and a major part of the visual quality of wine is caused by its translucency [3]. In a previous study, Bakker, Bridle & Timberlake [4] have shown that in Port wines both lightness (L*) and hue angle (H*) can be affected by the optical path and also that there is a poor correlation between the H* and colour tint, particularly in older samples. The results reported here show a similar variation of hue angle (H*) and lightness (L*) with depth, which is consistent with the results previously reported by these authors.
The chroma (C*) parameter was affected by depth, although its behaviour was more complex, depending on the wine style: in Ruby-style wines, a decrease in C*
was observed with increasing depth, except for the older (2002 Vintage Port) wines; in Tawny-style wines an asymptotical pattern was observed, with C* increasing with depth, particularly from 2.0 to 4.0 mm, in all categories, suggesting that colour purity increases down to 4.0 mm depth.
Being a translucent matrix, the colour of a wine is expected to be affected by the quality and direction of illumination, viewing geometry and the inclusion/exclusion of specular component [1]. In the case of colorimetric measurements, where the reflected radiation is measured at a near 0º angle (with the specular component included), some translucency errors can occur by light trapping, meaning that not all light reaches the detector. On the other hand, in the spectrophotometric method, a monochromatic beam of light passes (and is transmitted) through the sample, minimizing the effect of light trapping [1].
Since in the spectrophotometric method the results are extrapolated (using the Beer-Lambert-Bouguer law) from a path-length of 1.0 mm to higher path-lengths (2.0, 3.2, 4.0, 4.8 and 6.0 mm), possible refraction or reflection effects at these higher path-lengths are not taken into consideration by this approach. On the other hand, the colorimeter used (Konica Minolta CR-400) is designed so that the sample is illuminated almost equally from all directions (measuring the vertically reflected radiation from the wine sample), which creates more realistic illumination conditions, comparing to visual assessment of translucent liquids such as wine.
The visual assessment results showed a better colour distinction at shallower depths (2.0, 3.2 mm and 4.0 mm) for both styles of Port wine (Ruby and Tawny). The relationship between measured and visually perceived colour has previously been described in the literature, for different wine types at different depths [1,14,19]
In this work we obtained good linear correlations between the H* parameter and the
perceived hue of Ruby-style Port wines, particularly at higher depths, despite a high dispersion of the visual scores was also observed. In Tawny-style wines, a curved pattern was obtained with increasing depth which could be partially related to contrast effects previously described in the literature such as the Bezold–Brücke shift or the Abney effect [20]. The Bezold–Brücke shift, in particular, could have had an interference in the visual scores obtained by the panel, since the curvilinear graphs show that the panellists had more difficulty in classifying older samples of Tawny-style wines at higher depths, classifying older samples as less red (higher H*) than the colorimeter. Another factor, which could have interfered in the different perception of wine colour, is the difference of age between the Ruby- and Tawny-style wines used in this work. In fact, most Ruby-Tawny-style wine samples were relatively young (except for the 2002 Vintage Ports) while some of the Tawny-style wines where much older (up to 40-year old).
The LDA model obtained with the colorimetric results had a relatively limited discriminatory power (about 70%), since the number of samples per category was limited. However, it provided interesting information regarding which parameters (and observation depths) could be used for discrimination purposes. In fact, lightness (L*) and hue (H*) at 2.0 mm and, to a lower extent, hue (H*) at 4.8 mm depth, were the most discriminating parameters of the different Port wine categories, suggesting that visual observation at these particular depths could help distinguish visually between Port wines. Still, further work is necessary to improve the discriminatory power of this model.
5. CONCLUSION
The colorimetric method used in this worked proved to be a fast and easy
visual perception than the spectrophotometric readings. Moreover, the multivariate analysis demonstrated that the measurements at different depths could be used to distinguish Port wines from different categories. However, further research is necessary to improve the discrimination model and to clarify the complex phenomena involved in visual colour perception and its relationship to instrumental readings. Although other methods are available nowadays to measure accurately colour, such as digital image analysis or tele-spectroradiometry, they often require expensive equipment and sophisticated software. Due to its simplicity, the use of a colorimeter could be useful for the wine industry, particularly where wine colour is an important quality parameter, such as Port.
6. ACKNOWLEDGMENTS
The authors wish to thank Rui Costa Lima for advisory help. This work was supported by FCT - Fundação para a Ciência e a Tecnologia via project UID/Multi/50016/2013 and from the EU’s Horizon 2020 Research and Innovation programme under the Marie Sklodowska-Curie grant agreement Nr. 643063.
7. REFERENCES
[1] Hutchings, JB. Colour Measurements of Foods. In: Hutchings JB (ed). Food Colour and Appearance, London: Chapman & Hall, 1994; 239-252
[2] Hernández, B, Saenz, C, de la Hoz, JF, Alberdi, C, Alfonso, S and Dineiro, JM, Assessing the color of red wine like a taster's eye. Color Res Appl 34:153-162 (2009).
[3] Huertas, R, Yebra, A, Pérez, MM, Melgosa, M and Negueruela, AI, Color Variability for a Wine Sample Poured into a Standard Glass Wine Sampler. Color Res Appl 28:473-479 (2003).
[4] Martin, MLGM, Ji, W, Luo, R, Hutchings, J and Heredia, FJ, Measuring colour appearance of red wines. Food Qual Pref 18: 862-871 (2007).
[5] Bakker, J, Bridle, P and Timberlake, CF, Tristimulus measurements (CIELAB 76) of Port wine colour. Vitis 25: 67-78 (1986).
[6] Cliff, MA, King, MC and Schlosser, J, Anthocyanin, phenolic composition, colour measurement and sensory analysis of BC commercial red wines. Food Res Int, 40: 92-100 (2007).
[7] Ribereau-Gayon, P, Glories, Y, Maujean, A and Dubourdieu, D (eds), Handbook of Enology (Volume 2) - The Chemistry of Wine Stabilization and Treatments, 2nd edn. Chichester: John Wiley & Sons, 2006.
[8] Boulton, RB, The copigmentation of anthocyanins and its role in the color of red wine: comments on a critical review. Am J Enol Vitic 52: 67-87 (2001).
[9] Gonzalez-Manzano, S, Duenas, M, Rivas-Gonzalo, JC, Escribano-Bailon, MT and Santos-Buelga, C, Studies on the copigmentation between anthocyanins and flavan-3-ols and their influence in the colour expression of red wine. Food Chem
114: 649-656 (2009).
[10] Castaneda-Ovando, A, Pacheco-Hernandez, MDL, Paez-Hernandez, ME, Rodriguez, JA and Galán-Vidal, CA, Chemical studies of anthocyanins: A review. Food Chem 113: 859-871 (2009).
[11] Marquez, A, Serratosa, MP and Merida, J, Influence of bottle storage time on colour, phenolic composition and sensory properties of sweet red wines. Food Chem
146: 507-514 (2014).
[12] Tao, Y, Garcia, JF, Sun, DW, Advances in wine aging technologies for enhancing wine quality and accelerating wine aging process. Crit Rev Food Sci Nut
54: 817-835 (2014).
[13] Oliveira, J, Da Silva, MA, Parola, AJ, Mateus, N, Brás, NF, Ramos, MJ and De Freitas, V, Structural characterization of a A-type linked trimeric anthocyanin derived pigment occurring in a young Port wine. Food Chem 141: 1987-1996 (2013).
[14] OIV - Office International de la Vigne et du Vin. Determination of chromatic characteristics according to CIELab. In:OIV (ed). Compendium of International Analysis of Methods, Paris:OIV, 2006; 1-16.
[15] Martinez, J, Melgosa, M, Perez, M., Hita, E and Negueruela, A, Note. Visual and instrumental color evaluation in red wines. Food Sci Technol Int 7: 439-444 (2001).
[16] Bakker, J, Bellworthy, SJ, Hogg, TA, Kirby, RM, Reader, HP, Rogerson, FSS Watkins, SJ and Barnett, JA, Two methods of Port vinification: A comparison of changes during fermentation and of characteristics of the wines. Am J Enol Vitic 47: 37–41 (1996)
[17] Ho, P, Silva, MCM and Hogg, TA, Changes in colour and phenolic composition during the early stages of maturation of Port in wood, stainless steel and glass. J Sci Food Agric 81: 1269–1280 (2001)
[18] Pissarra, J, Lourenço, S, Machado, JM, Mateus, N, Guimaraens, D and De Freitas, V, Contribution and importance of wine spirit to the Port wine final quality - Initial approach. J Sci Food Agric 85: 1091-1097 (2005)
[19] Saenz Gamasa, C, Hernandez, B, De Santiago, JV, Alberdi, C, Alfonso, S and Dineiro, JM, Measurement of the colour of white and rosé wines in visual tasting conditions. Eur Food Res Technol 229: 263-276 (2009)
[20] Pridmore, RW, Huertas, R, Melgosa, M and Negueruela, AI, Discussion on perceived and measured wine color. Color Res Appl 30: 146-152 (2005)
FIGURE LEGENDS
Figure 1. Lightness (L*), Hue (H*) and Chroma (C*) values for Ruby-styled Port wine
samples (grouped by category) with increasing depth (mm); symbols represent the mean and error bars represent the standard error of the mean (n3) for each category.
Figure 2. Lightness (L*), Hue (H*) and Chroma (C*) values for Tawny-styled Port
wine samples (grouped by category) with increasing depth (mm); symbols represent the mean and error bars represent the standard error of the mean (n3) for each category.
Figure 3. Plots of relationships between hue angle (H*) and sensorial scores by the
panellists for Ruby Port wines at different depths (2.0, 3.2, 4.0, 4.8 and 6.0 mm); error bars represent standard deviations (n=10); scores represent the distance between the sample position and the “0” (left) anchor.
Figure 4. Plots of correlation between hue angle (H*) and sensorial scores by the
panellists for Tawny Port wines at different depths (2.0, 3.2, 4.0, 4.8 and 6.0 mm); error bars represent standard deviations (n=10); scores represent the distance between sample position and the “0” (left) anchor.
Figure 5. PCA plot of factor loadings of the different variables used in the study. D1
and D2 represent the first and second extracted components. C, L and H represent the colour parameters C*, L* and H*, respectively, while the following number represents the measured depth (in mm).
Figure 6. PCA plot of scores of the different Port wine samples. D1 and D2
represent the first and second extracted components. Ovals with solid lines represent groups of Ruby-styled Ports while ovals with dashed lines represent Tawny-styled Ports.
Figure 1. Lightness (L*), Hue (H*) and Chroma (C*) values (obtained from the
colorimeter Konica CR-400) for Ruby-styled Port wine samples (grouped by category) with increasing depth (mm); symbols represent the mean and error bars represent the standard error of the mean (n3) or each category.
Figure 2. Lightness (L*), Hue (H*) and Chroma (C*) values (obtained from the
colorimeter Konica CR-400) for Tawny-styled Port wine samples (grouped by category) with increasing depth (mm); symbols represent the mean and error bars represent the standard error of the mean (n3) for each category.
Figure 3. Plots of relationships between hue angle (H*) and sensorial scores by the
panellists for Ruby Port wines at different depths (2.0, 3.2, 4.0, 4.8 and 6.0 mm); error bars represent standard deviations (n=10); scores represent the distance between the sample position and the “0” (left) anchor.
Figure 4. Plots of correlation between hue angle (H*) and sensorial scores by the
panellists for Tawny Port wines at different depths (2.0, 3.2, 4.0, 4.8 and 6.0 mm); error bars represent standard deviations (n=10); scores represent the distance between sample position and the “0” (left) anchor.
Figure 5. PCA plot of factor loadings of the different variables used in the study. D1
and D2 represent the first and second extracted components. C, L and H represent the colour parameters C*, L* and H*, respectively, while the following number represents the measured depth (in mm).
Figure 6. PCA plot of scores of the different Port wine samples. D1 and D2 represent the first and second extracted components. Ovals with solid lines represent groups of Ruby-styled Ports while ovals with dashed lines represent Tawny-styled Ports.
Table 1: Linear correlation equations of the CIE L*a*b* parameters obtained by the spectrophotometric vs. colorimetric measurements at different depths.
Ruby wines Tawny wines
Dept h
Lightness(L*) Hue(H*) Chroma(C*) Lightness(L*) Hue(H*) Chroma(C*)
2.0 mm y=2.17x-3.49; R=0.894 y=0.750x+3.62 ; R=0.767 y=0.380x+37.4 ; R=0.190 y=0.919x+43.4 ; R=0.757 y=1.03x-2.39; R=0.967 y=0.632x+44.2 ; R=0.664 3.2 mm y=2.89x-20.4; R=0.876 y=0.666x+8.90 ; R=0.792 y=1.20x+9.45; R=0.523 y=1.29x+26.9 R=0.894 y=0.980x-3.18 R=0.941 y=0.335x+56.9 R=0.475 4.0 mm y=3.34-30.0 R=0.859 y=0.681x+9.90 R=0.835 y=1.46x+2.20 R=0.635 y=1.45x+20.5 R=0.912 y=0.958x+5.5 1 R=0.930 y=0.314x+58.3 R=0.338 4.8 mm y=3.69x-37.5 R=0.833 y=0.718x+10.1 R=0.869 y=1.57x-0.895 R=0.692 y=1.60x+14.9 R=0.920 y=0.953x+6.7 2 R=0.924 y=0.366x+56.0 R=0.349 6.0 mm y=3.97x+44. 1 R=0.779 y=0.791x+9.84 R=0.949 y=1.66x-3.04 R=0.746 y=1.79x+7.87 R=0.928 y=0.959x+7.5 9 R=0.919 y=0.555x+48.0 R=0.401
Legend: “y” represents the values obtained by the spectrophotometric method; “x” the values obtained with the colorimetric method and R the Pearson’s correlation coefficients; correlations were calculated using the average values (n=3) of the parameters for each wine sample
Table 2: Cross validation with the F1 and F2 linear discriminant functions using the predicted group membership
Original Categories
Predicted Group Membership
Ruby R. Ruby Tawny R. Tawny 10 years 20 years 30 years 40 years Total (%) Ruby (%) 55.6 33.3 11.1 .0 .0 .0 .0 .0 100.0 R. Ruby (%) 37.5 62.5 .0 .0 .0 .0 .0 .0 100.0 Tawny (%) .0 .0 81.8 9.1 9.1 .0 .0 .0 100.0 R. Tawny (%) .0 .0 .0 83.3 16.7 .0 .0 .0 100.0 10 years (%) .0 .0 .0 23.1 69.2 7.7 .0 .0 100.0 20 years (%) .0 .0 .0 .0 40.0 60.0 .0 .0 100.0 30 years (%) .0 .0 .0 .0 .0 .0 100.0 .0 100.0 40 years (%) .0 .0 .0 .0 .0 .0 50.0 50.0 100.0