A Work Project, presented as part of the requirements for the Award of a
Masters Degree in Management from the NOVA – School of Business and
Economics
A CASE STUDY:
EXAMINATION OF THE ECONOMIC
CONSEQUENCES OF A REJECTED
FAIRWAY ADJUSTMENT FOR
THE PORT OF HAMBURG
Christian Ramon Canel 22731
A Project carried out on the Operations Management course,
under the supervision of:
Prof. José Crespo de Carvalho
“As an international port city the Free and Hanseatic City of Hamburg, due to its history and location, has a special task to perform for the German people. In the spirit of peace it strives to be an intermediary between all continents and people of the world.”
Table of contents
TABLE OF CONTENTS ... III LIST OF FIGURES ... IV LIST OF APPENDICES ... V LIST OF ABBREVIATIONS ... VI
1 INTRODUCTION ... 1
2 METHODOLOGY APPROACH ... 2
3 THE PORT OF HAMBURG ... 2
3.1 FAIRWAY CHARACTERISTICS ... 2
3.2 TRADE DEVELOPMENT ... 3
3.3 HAMBURG`S TRADE RELATIONS ... 4
4 THE OPERATING FLEET ... 6
4.1 DEVELOPMENT OF VESSEL DIMENSIONS ... 6
4.2 FLEET COMPOSITION ON THE ROUTE TO EAST ASIA ... 8
4.3 THE IMPACT OF LARGE CONTAINERSHIPS ON THE PORT OF HAMBURG ... 9
5 CASE PROBLEM ... 10
5.1 INTENDED ADJUSTMENT ... 10
5.2 LEGAL OBJECTIONS ... 13
6 EXAMINATION OF THE PORT BREMEN ... 14
7 QUALITATIVE CONSEQUENCES FOR THE PORT HAMBURG ... 16
8 QUANTIFICATION OF THE CONSEQUENCES ... 20
8.1 QUANTIFICATION OF THE ANTICIPATED CARGO LOSS ... 20
8.2 QUANTIFICATION OF THE FORECASTED LOSS IN EMPLOYMENT ... 22
8.3 QUANTIFICATION OF THE PROGNOSTICATED GROSS VALUE ADDED REDUCTION ... 24
8.4 QUANTIFICATION OF THE EFFECTS ON INCOME AND TAX PAYMENTS ... 24
List of figures
GRAPHIC 1CONTAINER FLEET AND THE TEU CAPACITY ... 6
GRAPHIC 2CONTAINER FLEET IN 2004,2014 AND THE ORDER BOOK ... 7
GRAPHIC 3COMPOSITION OF THE CONTAINER FLEET ON THE ROUTE NORTH EUROPE –EAST ASIA ... 8
GRAPHIC 4CARGO CONTRIBUTION OF THE DRAUGHT CATEGORIES ... 9
GRAPHIC 5THE INTENDED FAIRWAY DEPRESSION ... 11
GRAPHIC 6DEVELOPMENT OF VESSEL DIMENSIONS ... 12
GRAPHIC 7CONTAINER THROUGHPUT IN BREMEN AND BREMERHAVEN ... 15
GRAPHIC 8THE OPERATING FLEET ON THE ROUTE NORTH EUROPE –EAST ASIA ... 17
GRAPHIC 9TEU CATEGORIES CALLING AT THE NORTH RANGE AND HAMBURG ... 19
GRAPHIC 10MARKET SHARE OF HAMBURG PER DRAUGHT CATEGORY ... 20
List of appendices
A ... i
App. A.1 Map of northern Germany ... i
B ... ii
App. B.1 Map of Hamburg and the Elbe ... ii
C ... iii
App. C.1 Table of possible dimensions ... iii
D ... iv
App. D.1 Trade data Hamburg 2013 ... iv
E ... v
App. E.1 Navigated areas ... v
F ... vi
App. F.1 Hinterland connections ... vi
G ... vi
App. G.1 Choice of transportation modes ... vi
H ... vii
App. H.1 Global trade and container throughput (1970 = 100) ... vii
I ... viii
App. I.1 Evolution of containerships ... viii
J ... viii
App. J.1 Cost curve of costs per TEU ... viii
K ... ix
App. K.1 Contemporary fleet and order book, indicating the TEU capacity ... ix
App. K.2 Forecasted fleet 2019 ... ix
L ... x
App. L.1 Contemporary fleet and order book, indicating the draught ... x
App. L.2 Forecasted fleet 2019 ... x
M ... xi
App. M.1 Diseconomies of scale ... xi
N ... xi
App. N.1 Effects of the last fairway adjustment ... xi
O ... xii
App. O.1 Average draught usage by vessels accessing the port of Hamburg ... xii
P ... xii
App. P.1 Prognostication of the operating fleet ... xii
Q ... xiii
App. Q.1 Prognostication of the operating fleet composition ... xiii
R ... xiv
App. R.1 Average draught per containership capacity ... xiv
S ... xv
App. S.1 Trade volume prognostication Hamburg ... xv
App. S.2 Trade volume prognostication Hamburg – East Asia ... xvi
T ... xvii
App. T.1 Examination of reduction in TEU ... xvii
App. T.2 Forecasted trade volume ... xvii
App. T.3 Total reduction in TEU ... xvii
U ... xviii
App. U.1 Port city categorization ... xviii
V ... xviii
App. V.1 Container trade dependent employment in 2013 ... xviii
App. V.2 Potential employment ... xix
App. V.3 Total reduction in container trade dependent employment ... xix
App. V.4 % Reduction in container trade dependent employment ... xx
W ... xx
App. W.1 Gross value added by container trade 2013 ... xx
App. W.2 Forecasted potential GVA ... xx
App. W.3 % Reduction of TEU ... xxi
App. W.4 Reduction of GVA ... xxi
X ... xxii
App. X.1 Gross income dependent on container trade in 2013 ... xxii
App. X.2 Forecasted potential income ... xxii
App. X.3 Reduction of container trade dependent income ... xxii
List of abbreviations
App. Appendix
DWT Dead weight tonnage EA East Asia
GVA Gross value added NR North Range
1
Introduction
2
Methodology approach
The topic of this report concerns a contemporary event without any external control and a strong real life contextual connection. The chosen method of analysis is therefore reflected by the case study. It is based on both qualitative and quantitative evidence and follows an interpretative approach, expressed in a narrative report. The case study´s purpose is mainly exploratory, but accompanied by a descriptive introduction (Yin 2014). A second case is embedded to further support the achieved results. The leading research question is: What will be the consequence for the port of Hamburg if the fairway adjustment must not be realized? To adequately examine the results this case study solely focuses on Hamburg´s central means of transport, the container trade. The following four levels of analyses include the effects on container trade dependent turnover, employment, gross value added and national income (Eisenhardt 1989).
3
The Port of Hamburg
3.1
Fairway characteristics
depths always refer to saltwater and normal height null. Saltwater implies a higher density than fresh water and hence a lower flotation depth of 30 cm. Even though the terminals are located in fresh water, all draught indications for vessels are expressed for saltwater. This means, the actual draught of ships increases in the fresh water of the port by 30 cm. But this fact is dealt with in the port´s announcements and the following examinations. Normal height null refers to the mean high-water level in Amsterdam and represents the official height dimension in Germany. The possible draught depends on the ship`s width and length. Furthermore, it differs for arriving and departing vessels. Arriving vessels can use the incoming tide wave and thus increase their draught (Project office 2007). The incoming tide wave takes about 3.5 hours to reach the port, which simplistically implies that this provides a daily time frame of one hour to expand the flotation depth (Boehlich 2003; Wellinski 2015). This time frame is, due to the contrary movement of tide wave and vessels, too short for outgoing ships (BSH 2015). App. C indicates the complex relation. In order to provide for a valid examination in the following, a general assumption, of 12.50 m tidal independent and 13.50 m tidal dependent movement is defined. The possibility to access the port with a draught of up to 14.80 m by using the tidal wave is also considered. However, it must be remembered that this only applies to ships with a smaller width and length and a time frame of one hour daily. Furthermore, ships possessing an additional width over 90 m cannot pass each other in the fairway and are forced to delay their passage (Project office 2007).
3.2
Trade development
products grew considerably and the international trade could achieve significantly higher growth rates than the production. The reduction of transport costs, based on the development of the container, the increasing ship sizes, the implementation of hub-and-spoke networks and the usage of intermodal transportation further supported this development, of which Hamburg clearly benefitted (Bräuniger/Otto/Stiller 2010). Hamburg`s favorable location, as the most eastern port of the North Range1 (NR) and 130 km inside the country, enabled the universal port to emerge to a crucial interface for different trade flows. It is the biggest bulk cargo port in Germany and contains a central relevance for the national steel and energy industry. Moreover, Hamburg represents the most important container trading port for broad parts of Germany, Czech Republic, Slovakia and Austria. The handled freight in the harbor is composed of 68 % containers and 32 % dry and liquid bulk cargo (Maatsch/Tasto 2015). Accordingly, the container embodies the main means of trade in Hamburg and therefore represents the core element of this case study. The port was able to emerge as acentral cargo delivery and distribution site, also defined as a hub (HPA 2012). This implies that containers are transferred in the port of Hamburg from extensive container ships to other modes of transport, depending on the final destination. In contrast to bulk transportation, the container trade is significantly characterized by its strict timetable (OECD/Eurostat 2014).
3.3
Hamburg`s trade relations
Hamburg`s most important container trading area is East Asia (EA). Considering trade data from the year 2013, which always combines ex-and imports, the region was responsible for 4,512,000 twenty foot equivalent units2 (TEU), representing half of the total cargo volume handled in the North German port. East and North Europe follow with a trade participation of 14 % and 11 %, respectively. The remaining 35 % were allocated to North and South
1 The NR contains, in terms of cargo handlings, the most important northern European ports,
located at the North Sea (Port technology 2011).
2 One TEU represents the standard container and the capacity descriptive determinant
4
The operating fleet
4.1
Development of vessel dimensions
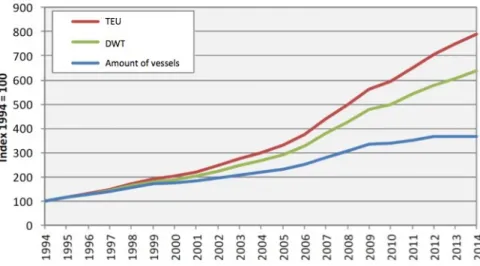
In line with the great expansion of the trade, the correspondent fleet capacity grew remarkably. Measured in deadweight tonnage (DWT), it rose by 75 % since 1993, including bulk, tank- and container vessels. The latter vessel category experienced especially substantial growth, caused by the over proportional increment of container trade, as App. H displays. The fleet gained capacity by a growing amount- and more importantly, an increasing size of ships. Between 1994 and 2014 the number of running vessels increased by 265 %, while the TEU capability even grew by 760 % (Maatsch/Tasto 2015). The largest container vessels today achieve a capacity of 19,000 TEU, a length of 400 m, a width of 59 m and a maximum draught of 16 m (Handwerk 2015). As can be seen in graphic 1, the TEU capacity progressively grows in excess of the growth in number of existing vessels.
Graphic 1 Container fleet and the TEU capacity
Source: Maatsch/Tasto 2015
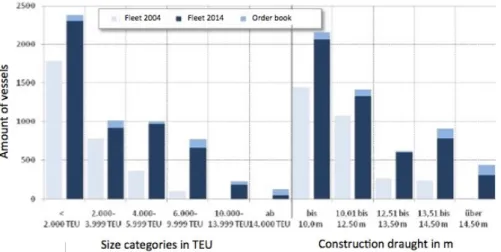
costs per TEU in terms of capital-, bunker fuel- and operating costs. However, the gained cost advantages through increasing volumes are not linear and increments provide only a diminishing marginal benefit (Monkenbusch 2015). Logically, the size expansion influences the global fleet composition. Comparing the container fleets from the year 2004 and 2014 in graphic 2, primarily illustrates the clear growth in the quantity of ships and secondly the shift to higher TEU capacities. Furthermore, the recorded orders of new ships are displayed and demonstrate the continuous trend. Expressed in numbers, the percentage of ordered ships with a capacity over 8,000 TEU equates to 52 % of all current orders. Positively correlated to the capacity, the vessels` construction draught increases. In particular, the number of ships with flotation depths above 13.50 m is growing meaningfully and is responsible for 56 % of all new orders. Forecasting the new fleet, this flotation depth class will represent 24 % of all running container vessels by 2019, including 5% of all ships with a draught over 14.8 m. The contemporary fleet, the order book and the prognosticated fleet, referring to both TEU and draught categories are respectively indicated by App. K and L.
Graphic 2 Container fleet in 2004, 2014 and the order book
Source: Maatsch/Tasto 2015
and therefore replace even smaller ships themselves (Van Marle 2013). As a result of these shifting trends, and further influenced by the shipping crisis and issue overcapacity, old and smaller container vessels are being scraped in order to reduce costs (Bräuniger/Otto/Stiller 2010). All ordered vessels are expected to launch by 2019 (Alphaliner 2015).
4.2
Fleet composition on the route to East Asia
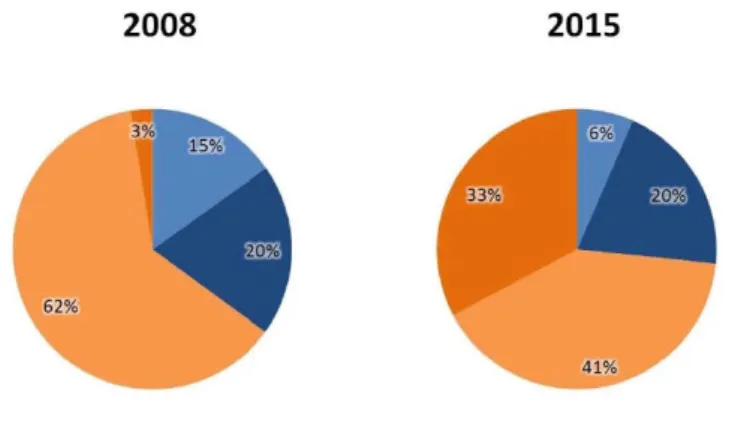
Based on the high transport volumes and the long distance, the largest ships are generally used on routes between EA and Europe (United Nations 2014). By 2008, 80 % of all vessels with a capacity of 6,000 TEU or higher serviced this connection (Bräuniger/Otto/Stiller 2010). Graphic 3 displays the fleet composition on this route in the year 2008 and provides a forecast through 2015. Seventy-four percent of vessels on this connection were predicted to provide a capacity over 6,000 TEU. The category over 10,000 TEU was supposed to experience some of the most significant growth. The diminishing share of vessels below 4,000 TEU, as well as below 10,000 TEU, help demonstrate the Cascade Effect (Lempert/Maatsch 2009).
Graphic 3 Composition of the container fleet on the route North Europe – East Asia
Source: Lempert/Maatsch 2009
4.3
The impact of large containerships on the port of Hamburg
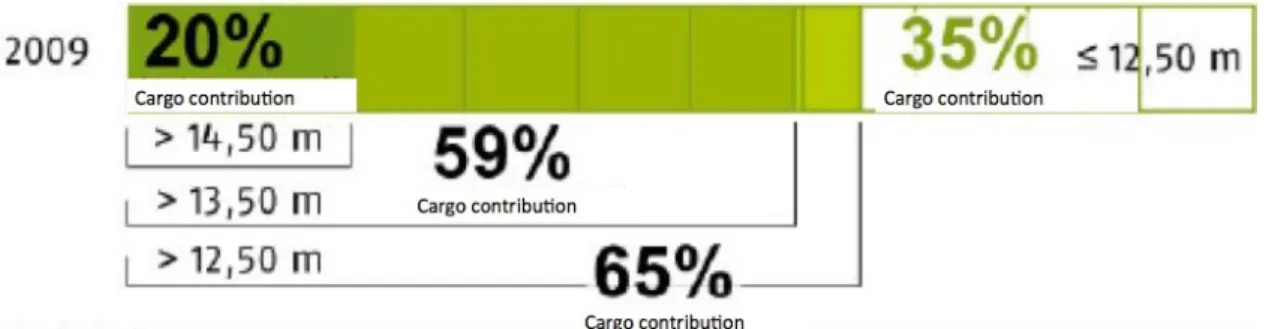
Considering the substantial amount of East Asian trade volume in the port of Hamburg indicates the meaningful influence for the city. According to the named size restrictions of the river Elbe, only ships with a maximum draught of 12.50 m can access and exit the port independently from the tides. Referencing ship movements in 2014, 1,477 vessels indicated a construction draught over 12.5 m, including 1,198 ships exceeding the 13.5 m mark. Out of all 6,329 containership movements in 2014, this results in 23 % tidal dependent traffic. Nineteen percent of the servicing vessels could not even enter the port fully loaded (data available in the attached excel file in the sheet “Container Vessel Movements”). This ratio may seem acceptable, but as previously noted, a key share of the remaining trade movements strongly depends on the incoming cargo from the EA traffic, which deploys the largest container ships. Furthermore, graphic 4 displays the amount of handled TEU by each construction draught category and demonstrates the significant impact of tidal dependent vessel activities. They transport about 65 % of all TEU handled in the port. The flotation depth categories over 13.50 m and 14.50 m are responsible for 59 % and 39 % accordingly. The tidal independent vessel class carries only the last third of TEU (Project office 2010).
Graphic 4 Cargo contribution of the draught categories
5
Case problem
As described earlier, the port has two key advantages. Primarily, it benefits from its location more than 100 km inside the country and close to the Baltic markets, which lowers transportation costs. Second, the high turnover volume implies economies of scale as well as the possibility to accumulate cargo for transshipments. However, both factors may be in jeopardy in the long run (Bräuniger/Otto/Stiller 2010). As examined, the majority of vessels running the crucial route from EA to Hamburg increased drastically in size. Referring to the fairway´s restrictions, especially the achieved dimensions of the vessels` draught and width, serve as the critical components. These considerable large vessels cannot enter the port fully loaded and have to respect the tides. Delays on the sea or in the terminal are thus, due to the potential tidal mismatch, especially harmful (Handwerk 2015). For example, the operating costs for a 19,000 TEU vessel are estimated at around 50,000 USD per day. The potential half-day delay to match the tidal wave consequently raises costs by 25,000 USD (Bossy 2015). Moreover, the underutilization of capacity diminishes the profit (Preuß 2014).
5.1
Intended adjustment
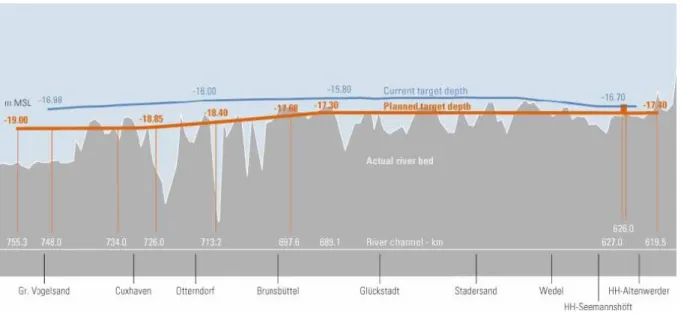
swell and wind, require distinctive depressions (Project office 2010).
Graphic 5 The intended fairway depression
Source: HPA 2012, 42
Furthermore, the width of the fairway should be extended in order to allow two ships of the model size to pass each other with the additive measurement of 92 m. Referring to the current circumstances of the fairway`s width, the expansion will include adjustments of up to 20 m. Additionally, an encounter box for extraordinary big ships should be implemented. Considering the harmful delays the current width restrictions will cause, this adjustment is as important as the depression (Project office 2007). The overall expansion work would take about 21 months and cost 400 million € (HPA 2012; Schwartz 2015). Regarding the
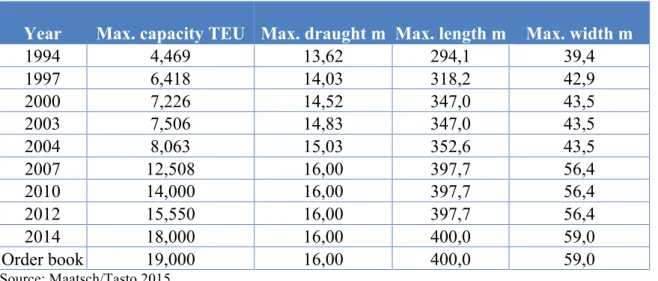
ports of the North Range, due to Hamburg´s northeastern location (Monkenbusch 2015). Nevertheless, these factors do not support argument against the fairway adjustment. As described, the vessels have reached a scantling draught of up to 16 m, which implies a design draught of 14.5 – 15.5 m. Considering the intended adjustment to enable tidal dependent passages of 14.5 m and the probability of partly unloaded container vessels, this measure seems just appropriate. Obviously multiple questions remain; will the vessel`s draught continuously increase in the future? Will the fairway adjustment need to be repeated again soon? As seen in graphic 6, a trend can be recognized. In the years up until 2007, the growing TEU capacity was in general accompanied by an increasing draught. But thereafter, the container ships experienced a drastic gain in TEU capacity, while the draught did not exceed the 16 m boundary.
Graphic 6 Development of vessel dimensions
Year Max. capacity TEU Max. draught m Max. length m Max. width m
1994 4,469 13,62 294,1 39,4
1997 6,418 14,03 318,2 42,9
2000 7,226 14,52 347,0 43,5
2003 7,506 14,83 347,0 43,5
2004 8,063 15,03 352,6 43,5
2007 12,508 16,00 397,7 56,4
2010 14,000 16,00 397,7 56,4
2012 15,550 16,00 397,7 56,4
2014 18,000 16,00 400,0 59,0
Order book 19,000 16,00 400,0 59,0
Source: Maatsch/Tasto 2015
limited amount of deep-sea ports, an ongoing increasing draught reduces the number of accessible harbors to an uneconomical extent (Preuß 2015). The fairway adjustment thus refers to the requirements of today´s container vessels, considers the cost benefit ratio and, maybe more importantly, the effects on nature. But the environmental care is primarily imposed by the environmental organizations BUND and NABU (Schwartz 2015).
5.2
Legal objections
expected in 2016 from the federal court in Leipzig (Zeit 2015). The court´s decision is uncertain and both parties, the environmental organizations and the port officials, are intensely working on their arguments (Kopp 2015). One key argument could be the effects of the last conducted fairway adjustment. The completion of the last expansion in 2001 distinctly fostered Hamburg´s market share among the NR ports in terms of deep-sea connections, as is seen in App. N. Following years of depression, the adjustment enabled ships to employ the contemporary maximum draught and henceforth increased the port´s market share rapidly by over 10 % (Maatsch/Tasto 2015). Moreover, the estimated negative environmental effects never came to fruition (Purtul 2013).
This case study aims to examine the consequences for the port of Hamburg and the nation, if the federal court in Leipzig rules in 2016 against the fairway adjustment. In the following, this should explore, whether or not the fairway adjustment is in the greater public interest.
6
Examination of the port Bremen
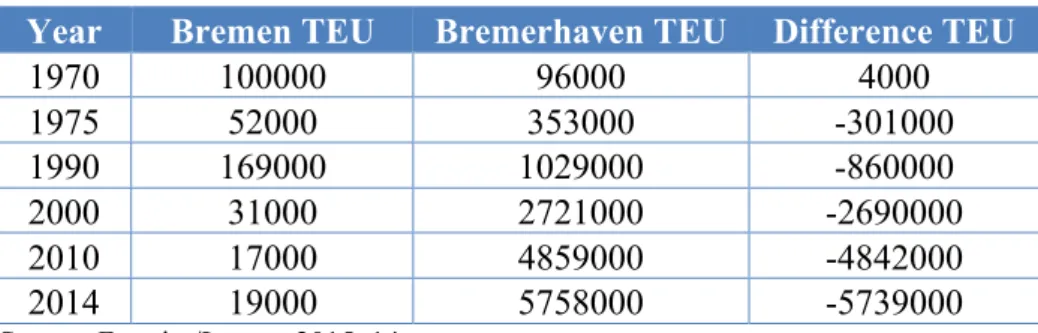
Graphic 7 Container throughput in Bremen and Bremerhaven
Year Bremen TEU Bremerhaven TEU Difference TEU
1970 100000 96000 4000
1975 52000 353000 -301000
1990 169000 1029000 -860000
2000 31000 2721000 -2690000
2010 17000 4859000 -4842000
2014 19000 5758000 -5739000
Source: Ferreira/Lattner 2015, 14
significant reduction is caused by the diminishing container turnover, the increase in efficiency as well as the shift of work to logistic centers. Bremerhaven, on the other hand, could increase the turnover dependent employment from 2000 in the year 2010 to 3.500 in 2014 (Gabriel/Salot/Ludwig 2015). As a consequence, the restrictive Weser fairway impeded the development of Bremen. Container vessels evaded the profit reducing underutilization and thus container turnover shifted to Bremerhaven and accordingly, all incremental trade emerges. Simultaneously, the dependent employment declines in Bremen, while it increases in Bremerhaven.
7
Qualitative consequences for the port Hamburg
number of ships with a draught exceeding 15.5 m already rose to 54, according to App. L. An allocation of less than 50 % to this route contradicts the facts. In consequence, the actual amount of vessels on this connection indicating a draught over 15,5 m is significantly higher (United Nations 2014).
Graphic 8 The operating fleet on the route North Europe – East Asia
Source: Lempert/Maatsch 2009
As a result, the port of Hamburg already lost market share on this trade connection. Regarding the time frame between 2008 and 2013, the corresponding market share diminished by 6.1 % (Maatsch/Tasto 2015). Due to the shipping crisis, vessels did not run with the usual flotation depth. In contrast to 2008, where ships, accessing the port of Hamburg, used almost 88 % of their possible draught, the crisis resulted in an average utilization of only 81 %, as App. O presents (Lempert/Maatsch 2009). Referring to a 14,000 TEU carrier, this indicates a difference of almost 1,000 TEU. The crisis lasted longer than expected and forced ships to operate with a smaller usage of capacity. In the case of Hamburg, the annual container turnover just recently reached the amount of 2008 again. Collaterally with the growing container handlings, the vessels` overcapacities shrink and the draught increases (Port of Hamburg 2015).
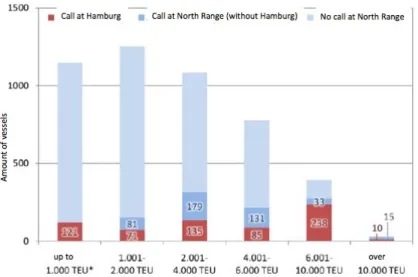
Graphic 9 TEU categories calling at the North Range and Hamburg
Source: Lempert/Maatsch 2009
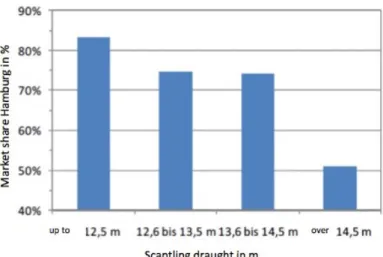
Graphic 10 Market share of Hamburg per draught category
Source: Lempert/Maatsch 2009
8
Quantification of the consequences
This chapter examines the consequences in terms of container handlings, port dependent employment, GVA, income and tax income. The quantification is neither able nor aims to examine the exact results. It is based on several assumptions and prognostications, which clearly influence the outcome. Nonetheless, the calculated reference values provide a suitable forecast and indicate the effects. Moreover, the examination follows the principle of conservatism. It expresses the results as losses per analyzed year, referring to the prognosticated amount without the fairway hindrances. However, each result should be interpreted as an unrealized value.
8.1
Quantification of the anticipated cargo loss
Graphic 11 Forecasted composition of the operating fleet
Vessels TEU Draught m Market share
103 8,000 - 10,000 13,5 - 14,5 74% 163 10,000 - 14,000 14,5 - 15 51% 131 > 14,000 15 - 16 51%
Source: Own calculation
Referring to this forecast, all employed vessels will need to respect the tides. Moreover, almost 75 %, considering the opportunity of the tidal wave usage, will not be able to call at the port without cargo deficits. Applying the analyzed market shares per draught category on the forecasted fleet allows for an estimation of the new market share. As a result, due to the increasing vessel sizes and the remaining hindrances, the respective market share of accessing ships will shrink from 72 % to only 57 %, a loss of 20.3 %. In order to transfer this reduction to the handled TEU volume, the future trade emergence between Hamburg and EA must similarly be prognosticated. According to an Institute of Shipping Economics and Logistics analysis, the trade for the NR will grow annually by 3.8 %, which is assumed to equally apply for the trade between EA and Hamburg (Maatsch/Tasto 2015). App. S charts the forecasted trade development. Consequently, the reduction of 20.3 % will cause a loss of 1,063,296.89 TEU in 2019. Additionally, as indicated, the East Asian container turnover effectuates a further transshipment of 40 %. Diminishing container turnover on the route to EA will therefore also decrease the transshipments by 425,853 TEU. In aggregate, turnover of about 1,500,000 TEU will not be realized. This calculation is further extended to the year 2030, based on the same operating fleet as prognosticated for 2019. As a result, the corresponding loss amounts to 2,240,000 TEU in total, as presented by App. T. The continuously developing fleet will even increase this volume. This reduction will further deteriorate the port´s competitiveness. Compared to other ports in the NR and the contrasting scenario, its economies of scale will significantly decrease.
8.2
Quantification of the forecasted loss in employment
8.3
Quantification of the prognosticated gross value added reduction
The GVA represents, besides the employment effects, the most central determinant for the port´s economic impact. It distinctly displays the port´s created monetary value. Solely in Hamburg the respective GVA amounted to 11.7 billion€ in 2013, which signifies 13.4 % of
the city´s total creation. Considering that the regional port dependent employment only accounted for 10.8 % of Hamburg´s entire activity implies the port´s disproportional productivity. The container transport nationwide created a GVA of 11.5 billion €, which can
be equated to the corresponding total container turnover (Planco 2014). Consequently the prognosticated trade growth rate of 3.8 % equally applies for the GVA, which is assumed to replicate the value of 2013 in 2015. As App. W proves, the forecasted reduction in container handlings will therefore cause a diminishing GVA of 1.85 billion € in 2019 and 2.8 billion €
in 2030.
8.4
Quantification of the effects on income and tax payments
Simultaneously with the reduction in port dependent employment the national income will decrease, which will subsequently reduce tax payments. The total port dependent income in Germany equaled 14.6 billion € in 2013 (Planco 2014). The container trade contributed 8.2
billion €, which was achieved by the corresponding employment of 151,983. The forecasted
employment loss of 15,544 in 2019 and 23,427 in 2030, represents a reduction of 9.12 % compared to the prognosticated potential employment associated with the fairway adjustment. This impact can be translated to the national income level, which is assumed to grow proportionally with employment resulting in increases of 12.11 % by 2019 and 68.97 % by 2030. Accordingly, referring to App. X, the lost container handlings and therefore the diminishing employment will cause an income reduction of 840 million € in 2019 and 1.27
this reduces the states income tax revenues by 210,000,000 € in 2019 and 315,000,000 € in
2030 (BMF 2015).
9
Conclusion
Bibliography
Alphaliner (2015): Cellular Fleet Forecast;
http://www.alphaliner.com/liner2/research_files/liner_studies/nofleet/Alphaliner-FleetForecast-2015-08.pdf; last checked on 20/12/2015; no page indications
Altenmüller, Irene (2015): Hamburgs Hafen: Von den Anfängen bis heute; NDR;
http://www.ndr.de/nachrichten/hamburg/hafen/geschichte/Hamburgs-Hafen-Von-Anfaengen-bis-heute,hafenhamburggeschichte101.html; last checked on 16/12/2015; quoted pages: 1
BMF (Bundesministerium der Finanzen) (2015): Lohn und Einkommensteuerrechner;
https://www.bmfsteuerrechner.de/ekst/ekst.jsp?in_einkommen=48000&in_verheiratet=0&in_ jahr=2014&berechnen=; last checked on 16/12/2015; no page indications
Bossy, Franziska / Sayami, Hans (2015): Elbvertiefung. Ja, wann baggern Sie denn?; Spiegel Online;
http://www.spiegel.de/wirtschaft/soziales/hafen-hamburg-bremen-containerwirtschaft-und-elbvertiefung-a-1031014.html; last checked on 16/12/2015; no page indications
BSH (Bundesamt für Schifffahrt und Hydrographie) (2015): Notice to Mariners, Official Maritime Publication; Volume 146; Issue 36; quoted pages: 96 – 97
Bräuniger, Michael / Otto, Alkis Henri / Stiller, Silvia (2010): Die Volkswirtschaftliche Bedeutung des Hamburger Hafens in Abhängigkeit vom Fahrrinenausbau der Unter- und
Davidson, Neil (2014): Global impacts of ship size development and liner alliances on port planning and productivity; Drewry Maritime Research; IAPH Mid-term conference Port Planning and Investment; Sidney; quoted pages: 15
Eisenhardt, Kathleen M. (1989): Building Theories from Case Study Research; Stanford University; The Academy of Management Review; quoted pages: 534 - 545
Gabriel, Steffen / Salot, Dr. Marion / Ludwig, Thorsten (2015): Strukturwandel in Bremen, Befunde und Herausforderungen; Arbeitnehmerkammer Bremen; Bremen; quoted pages: 101
Handwerk, Agnes (2015): Frachtschiffe, Alles im Lot auf´m Boot?; Deutschlandradio Kultur;
http://www.deutschlandradiokultur.de/frachtschiffe-alles-im-lot-auf-m-boot.976.de.html?dram:article_id=308222; last checked on 20/12/2015; no page indications
HK (Handeslkammer Hamburg) (2015): Hafen Hamburg Zahlen und Fakten;
https://www.hk24.de/blob/hhihk24/standortpolitik/downloads/2993762/10ccbc1dfeea20dfb5a 452b577fb4f3a/Hafen-Hamburg-auf-einen-Blick-data.pdf; last checked on 23/12/2015; quoted pages: 17 – 18
HPA (Hamburg Port Authority) (2012): The port development plan to 2025; Hamburg Port Authority / Free and Hanseatic City of Hamburg;
http://www.hamburg-port- authority.de/en/press/Brochures-and-publications/Documents/port-development-plan2025.pdf; last checked on 23/12/2015; quoted pages: 4 – 12
https://halshs.archives-ouvertes.fr/halshs-00459509/document; last checked on 23/12/2015; quoted pages: 9 – 25
Kopp, Martin (2015): Koalitionsstreit über Elbvertiefung, Umweltbehörde scheitert mit dem Vorhaben, das wichtige Verfahren zu verlängern. Machtwort beim Krisengipfel; Hamburger Abendblatt; http://www.abendblatt.de/wirtschaft/article206841669/Koalitionsstreit-ueber-Elbvertiefung.html; last checked on 19/12/2015; no page indications
Lempert, Prof. Dr. Burkhardt / Maatsch, Dr. Sönke (2009): Bedeutung der geplanten
Fahrinnenanpassung für die Schifffahrt im Hafen Hamburg; Institute of Shipping Economics and Logistics; http://www.fahrrinnenausbau.de/Projektbuero/dokumente/Downloads/
Planaenderung_3/ISL_Endbericht.pdf; last checked on 23/12/2015; quoted pages: 2 – 25
Maatsch, Dr. Sönke / Tasto, Michael (2015): Prognose des Umschlagpotenzials und des Modal Splits des Hamburger Hafens für die Jahre 2020, 2025 und 2030; Institute of Shipping Economics and Logistics;
http://www.hamburg-port-authority.de/de/presse/studien-und-berichte/Documents/Endbericht_Potenzialprognose_Mai2015_5.pdf; quoted pages: 11 – 129
Monkenbusch, Helmut (2015): Containerriesen: Der Gigantismus stößt an seine Grenzen; Hermes; https://newsroom.hermesworld.com/content/containerriesen-der-gigantismus-st%C3%B6%C3%9Ft-seine-grenzen; last checked on 20/12/2015; no page indications
NDR (Norddeutscher Rundfunk) (2015): Hamburger Hafen feiert Rekord bei Umschlag;
OECD (Organization for Economic Cooperation and Development) / Eurostat (2014): Eurostat – OECD Methodological Guide For Developing Producer Price Indices for
Services; Second edition; OECD Publishing; http://www.oecd.org/std/prices-ppp/Eurostat-OECD%20SPPI%20Guide%20Provisional%20Draft.pdf; last checked on 23/12/2015; quoted pages 155
Oßenbrügge, Jürgen (2014): Die Elbe – Internationale Schifffahrtsstraße und
Wirtschaftsmotor; published in Ratter, Beate M.W. / Holdschlag, Arnd: Das Elbe-Ästuar – Natur-, Kultur- und Wirtschaftsraum unter Nutzungsdruck; Hamburger Symposium Geographie; Volume 6; quoted pages: 56 – 64
Planco (2009): “Fahrinnenanpassung von Unter- und Außenelbe”, Aktuelle Informationen zur Bedeutung des Containerumschlags für die Beschäftigung im Hamburger Hafen; Planco Consulting GmbH; Essen;
http://www.fahrrinnenausbau.de/Projektbuero/dokumente/Downloads/Planaenderung_3/PLA NCO_Beschaeftigung.pdf ; last checked on 23/12/2015; quoted pages: 2 – 18
Planco (2014): Fortschreibung der Berechnung zur regional- und gesamtwirtschaftlichen Bedeutung des Hamburger Hafens für das Jahr 2013, Schlussbericht; Planco Consulting GmbH; Essen;
http://www.hamburg-port-authority.de/de/presse/studien-und-berichte/Documents/PLANCO-Schlussbericht2013_final.pdf; last checked on 23/12/2015; quoted pages: 3 – 74
Port technology (2011): Hamburg – Le Havre Range topped 40 million TEU in 2011;
https://www.porttechnology.org/technical_papers/hamburg_le_havre_range_topped_40_milli on_teu_in_2011/; last checked on 16/12/2015; no page indications
Preuß, Olaf (2014): Das Urteil und die Ungewissheit im Hamburger Hafen; Hamburger Abendblatt; http://www.abendblatt.de/wirtschaft/article132859475/Das-Urteil-und-die-Ungewissheit-im-Hamburger-Hafen.html; last checked on 16/12/2014; no page indications
Preuß, Olaf (2015): “Das Wachstum der Schiffe wird aufhören”; Die Welt;
http://www.welt.de/regionales/hamburg/article146305217/Das-Wachstum-der-Schiffe-wird-aufhoeren.html; last checked on 13/09/2015; no page indications
Project office (2007): Fahrinnenanpassung Unter- und Außenelbe, Das Projekt im Überblick; Projektbüro Fahrinnenanpassung von Unter- und Außenelbe;
https://www.kuestendaten.de/publikationen/Datencontainer/P/Projektbuero/Das_Projekt_im_ Ueberblick.pdf; last checked on 23/12/2015; quoted pages: 7 – 11
Project office (2010): Fahrinnenanpassung für Unter- und Außenelbe für 14,5 m tiefgehende Containerschiffe; Planänderungsunterlage III Teil 11a, Darstellung der zwingenden Gründe
des überwiegenden öffentlichen Interesses; Projektbüro Fahrinnenanpassung von Unter- und Außenelbe;
Purtul, Güven (2013): Elbvertiefung; http://purtul.de/?p=9; last checked on 22.08.2013; no page indications
Rodrigue, Jean-Paul (2013 a): The Geography of transport systems; Third Edition; New York; Routledge; quoted pages: 23 – 107
Rodrigue, Jean-Paul et. al (2013 b); The Geography of Transport Systems, Hofstra University; Department of Global Studies & Geography; http://people.hofstra.edu/geotrans; last checked on 23/12/2015; no page indications
Schröder, Axel Peter (2015): Vertiefung der Elbe in Hamburg, Darum muss gebaggert werden – oder eben nicht; Deutschlandradio Kultur;
http://www.deutschlandradiokultur.de/vertiefung-der-elbe-in-hamburg-darum-muss-gebaggert-werden.1001.de.html?dram:article_id=312410; last checked on 20/12/2015; no page indications
Schwartz, Jan C. (2015): EuGH last Hintertür für Elbvertiefung offen; finanzen.net;
http://www.finanzen.net/nachricht/aktien/EuGH-laesst-Hintertuer-fuer-Elbvertiefung-offen-4409966; last checked on 16/12/2015; no page indications
Staats, Rüdiger /Henke, Stefan (2015): Zukunft Hafen, Bilanz und Ausblick; Bremen Ports; Bremerhaven; quoted pages: 19
United Nations (2014): Review of maritime transport 2014; United Nations Conference on Trade and Development; http://unctad.org/en/PublicationsLibrary/rmt2014_en.pdf; last checked on 23/12/2015; quoted pages: 19 – 74
Van Marle, Gavin (2013): Small ports feel the heat from big box ships as cascade effect begins; The Load Star, making sense of the supply chain; http://theloadstar.co.uk/small-ports-feel-the-heat-from-big-box-ships-as-cascade-effect-begins/; last checked on 16/12/2015; no page indications
Wellinski, Patrick (2015): Zukunft der Schifffahrt, Riesenfrachter Steuert Hamburg an; Deutschlandradio Kultur; http://www.deutschlandradiokultur.de/zukunft-der-schifffahrt-riesenfrachter-steuert-hamburg-an.2156.de.html?dram:article_id=308474; last checked on 20/12/2015, no page indications
Yin, Robert K. (2014): Case Study Research, Design and Methods; Cosmos Corporation; Fifth Edition; Sage Publications Inc.; United States of America; quoted pages: 3 – 50
Interview partner
Salot, Dr. Marion (2015); Arbeitnehmerkammer Bremen: Telephone interview on 20/11/2015 Elvers, Jens Kristian (2015); Hamburg Port Authority; Strategy, Head of Port Development: Telephone interview on 10/11/2015
Oellerich, Jörg (2015); Hamburg Port Authority; Head of Corporation development: Telephone interview on 20/10/2015 and 3/11/2015