Universidade de Lisboa
Faculdade de Medicina de Lisboa
Non REM sleep pathology in REM sleep
behavior disorder
Arousal analysis
Rita Cristina Alves Louro Miguel
Orientadora:
Dr.ª Ana Rita Fernandes Peralta
Co-orientadora: Dr.ª Carla Cristina Paulo Gabriel Bentes
Dissertação especialmente elaborada para obtenção do grau de
Mestre em Neurociências
ii
A impressão desta dissertação foi aprovada pelo Conselho
Científico da Faculdade de Medicina da Universidade de Lisboa em
reunião de 21 de novembro de 2017.
iii
RESUMO
INTRODUÇÃO E HIPÓTESE
A Perturbação do Comportamento do Sono REM (RBD) é uma forma de parassónia caraterizada por perda da normal atonia muscular esquelética durante o sono REM, levando ao aparecimento de atividade motora excessiva associada a sonhos, os quais são frequentemente vívidos e sentidos como desagradáveis. Alguns estudos prévios têm sugerido que, em formas idiopáticas de RBD (RBDi), as alterações da fisiologia de sono podem também envolver o sono não REM (NREM). Tais alterações poderão contribuir para a fragmentação do sono e para o aparecimento de sintomas diurnos. Porém, a expressão clínica e polissonográfica da desregulação do sono NREM em RBDi continua por esclarecer. Tendo em conta o conhecimento atual sobre a assinatura clínica e neuropatológica desta entidade, admitimos que os reguladores do ciclo sono-vigília (circuito flip-flop), sediados no tronco cerebral superior e implicados no processo homeostático e ultradiário de regulação do sono, possam ser um possível mecanismo envolvido na desregulação do sono NREM em RBDi. Ao nível da macroestrutura do sono, a distribuição dos períodos de sono NREM e da fase N3 ao longo dos ciclos de sono sucessivos é uma medida da regulação do processo homeostático do sono. Ao nível da microestrutura do sono, os eventos fásicos relacionados com a intrusão de micro-períodos de vigília durante o sono, expressos sob a forma de padrão cíclico alternante e microdespertares, oferecem uma medida da estabilidade do circuito flip-flop durante o sono. Um possível mecanismo para o aumento esperado nos parâmetros de fragmentação e instabilidade do sono em doentes com RBDi pode ser posto em evidência através da análise da composição espetral do sinal de EEG no período imediatamente prévio aos microdespertares.
OBJETIVOS
1. Analisar a distribuição do sono NREM, estádio N3 e sono REM ao longo do período sono noturno em doentes com RBDi e controlos;
iv
2. Analisar medidas de instabilidade e de fragmentação durante o sono NREM e REM, incluindo análise do padrão cíclico alternante e microdespertares em doentes com RBDi e controlos;
3. Analisar a composição espetral do EEG no período pré-microdespertar/ despertar, incluindo: (i) o cálculo da potência relativa (PR) de seis bandas de frequência durante o período pré-microdespertar/ despertar e durante um período de baseline, (ii) o cálculo da variação do período de baseline para o período pré-microdespertar/ despertar e (iii) a comparação da variação das PRs entre doentes com RBDi e controlos para cada banda espetral.
MÉTODOS
Foram analisados retrospetivamente todos os doentes com o diagnóstico de RBDi e controlos que entre Janeiro de 2007 e Dezembro de 2015 realizaram polissonografia (PSG) no Laboratório de EEG/ Sono do Hospital de Santa Maria, Centro Hospitalar Lisboa Ocidental. Foram incluídos 10 doentes com RBDi e 15 participantes controlos, comparáveis no que respeita à distribuição por sexo e idade, sem outras co-morbilidades relacionadas com o sono e sem patologia neuroloógica diagnosyticada. Para o cumprimento do objetivo 1, as PSGs foram re-estadiadas por dois observadores independentes de forma a atingir um consenso final. As medidas convencionais da arquitetura macroestrutural de sono foram analisadas, incluindo duração e distribuição de cada fase de sono ao longo dos ciclos de sono.
Para o cumprimento do objetivo 2, os eventos fásicos de instabilidade e fragmentação do sono, incluindo o padrão cíclico alternante e os microdespertares isolados (microdespertares não associados a atividade de sincronização do tipo complexos K ou surtos de atividade delta), foram marcados por análise visual e analisados em termos de índice, taxa e duração; as fases A do padrão cíclico alternante foram classificadas em fases A1, A2 e A3 de acordo com a prevalência do componente de sincronização.
Para o cumprimento do objetivo 3, foram selecionados microdespertares ou despertares espontâneos precedidos por uma período mínimo de 120 segundos de
v
estabilidade no EEG. A potência relativa (PR) de 6 bandas de frequência do EEG foi calculada, segundo a segundo, a partir da Transformada de Fourrier no período de 30 segundos prévio a cada evento selecionado e num período convencionada de
baseline. A média das PRs no período de baseline foi normalizada para o valor 1. A
média da variação das PRs, nas diferentes frequências espetrais, no período pré-microdespertar/ despertar foi calculado em relação ao período de baseline. A média da variação das PRs foi comparada entre RBDs e controlos.
O presente trabalho foi aprovado pela Comissão de Ética do Hospital de Santa Maria.
RESULTADOS
A análise macroestrutural foi semelhante nos dois grupos, excepto por uma redução de sono REM no grupo RBDi e alterações na distribuição do estádio N3. Nos controlos, observou-se uma diminuição significativa na duração da fase N3 do primeiro para o último ciclo de sono, enquanto que nos doentes com RBDi esta variação não se verificou.
Na análise dos parâmetros microestruturais de fragmentação e instabilidade do sono, o índice de microdespertares espontâneos, total, durante o sono não REM ou durante o sono REM, foi sempre mais elevado nos doentes com RBDi, em comparação com os controlos. Durante o sono NREM, a percentagem de microdespertares isolados foi também mais elevada em doentes com RBDi, em comparação com os controlos. Os doentes com RBDi apresentaram uma menor duração e menor taxa da fase A1 do CAP, enquanto que as fases A2 e A3 do CAP não diferiram significativamente entre os dois grupos.
Na análise da composição espetral do EEG no período de pré-despertar/ microdespertar, os eventos ocorridos em sono NREM nos controlos foram caraterizados por um aumento significativo da PR da banda delta e pela redução da PR das restantes bandas teta, alfa, sigmas e beta, em relação ao período de baseline. Em doente com RBDi, este perfil foi sobreponível, exceto pelo aumento da atividade da banda teta e pela perda da diminuição das bandas sigma observada durante o estádio N2.
vi
Durante o sono REM, em ambos os grupos, os microdespertares/ despertares são precedidos de aumentos da banda delta. No grupo controlo, a atividade das frequências mais altas (alfa, sigma rápido e beta) permaneceu inalterada, enquanto que a atividade do sigma lento diminuiu. Em doentes com RBDi, este padrão modificou-se, tendo sido registada uma diminuição da actividade na banda alfa, enquanto que ambas as bandas sigma permaneceram inalteradas; registou-se ainda uma tendência para a atividade beta (p = 0.09) aumentar no período pré-despertar/ microdespertar.
Analisando despertares e microdespertares separadamente, controlos estiveram associados ao mesmo padrão (aumento da atividade da banda delta e diminuição das restantes bandas espetrais) em ambos os eventos, com exceção para a banda teta, a qual diminuiu no período pré-microdespertar mas permaneceu inalterada no período pré-despertar. Em doentes com RBDi, o aumento da banda delta e a diminuição da banda alfa foi comum a ambos os eventos, enquanto que o comportamento das restantes bandas espetrais foi distinto: os microdespertares estiveram associados a uma diminuição das bandas sigma alto e beta (sigma baixo permaneceu inalterada), enquanto que os despertares estiveram associados a uma diminuição do sigma baixo apenas (tendo as bandas sigma alto e beta permanecido inalteradas).
DISCUSSÃO
A análise polissonográfica do sono NREM em doentes com RBDi revelou alterações a nível da macro e da microestrutura.
A alteração observada na distribuição da duração dos episódios de fase N3 pode sugerir uma disrupção de mecanismos homeostáticos de regulação do sono ou estar relacionada com as alterações microestruturais observadas nos parâmetros de instabilidade e de fragmentação em RBDi. Os microdespertares em doentes com RBDi diferiram em termos de frequência e de morfologia; estas diferenças refletiram-se num aumento no índice de microdespertares espontâneos e numa maior percentagem de microdespertares não associados a atividade eletroencefalográfica do tipo sincronização. Estes dados sugerem que, nestes doentes, os microdespertares ocorrem mais frequentemente isolados, não associados a
vii
mecanismos protetores do sono, sugerindo um nível diferente de sincronização dos neurónios tálamo-corticais durante o sono NREM. Este pode ser um dos mecanismos da maior suscetibilidade destes doentes a fragmentação do sono.
Relativamente à análise espetral no período de pré-despertar/ microdespertar durante o sono NREM, com exceção da atividade sigma, o padrão observado sugere que a ativação cortical evolui no sentido de favorecer mecanismos promotores do sono, tanto em controlos como em doentes com RBDi. Estes dados mostram que, apesar da proporção de microdespertares associados a um componente de sincronização encontrar-se reduzida em doentes com RBDi, a atividade delta é passível de ser evocada no período pré-microdespertar/ despertar numa magnitude comparável à dos controlos. A perda da redução da banda sigma observada nos doentes pode dever-se à diminuição tónica da atividade sigma, presente ao longo de todo o sono e previamente descrita nesta patologia. Tendo em conta o papel que a atividade sigma parece desempenhar como elemento promotor do sono, a sua redução pode fornecer um outro mecanismo responsável pela maior fragmentação e instabilidade do sono encontrada em doentes com RBDi. Avaliando separadamente microdespertares e despertares, a análise das bandas espetrais permite ainda distinguir diferentes ambientes oscilatórios em controlos e RBDi, nomeadamente a presença de uma maior expressão de ritmos ativadores (banda beta) e menor expressão de ritmos protetores (banda sigma), podendo determinar uma maior vulnerabilidade dos doentes para despertares prolongados.
Globalmente, estes dados suportam a hipótese inicialmente colocada do envolvimento patológico do sono NREM em RBDi. Futuramente, será necessário caraterizar a repercussão clínica das alterações observadas e analisar sua evolução ao longo da história natural do RBD.
viii
ABSTRACT
INTRODUCTION AND HYPOTHESIS
There is some evidence suggesting the pathological involvement of non REM (NREM) sleep in REM sleep behavior disorder (RBD). Few studies have looked at arousal system polysomnographic expression during NREM sleep in idiopathic RBD (iRBD). Based on actual knowledge about the clinical and pathological signatures of RBD, we hypothesize that the sleep-wake regulators placed in upper brainstem may be a potential target, early involved in neurodegeneration process in iRBD, leading to widespread sleep changes including NREM sleep.
OBJECTIVES AND METHODS
To address this issue, we performed a macrostructural and microstructural polysomnographic exploration of sleep in iRBD patients and controls, considering the following objectives:
1. Analysis of distribution of NREM sleep, N3 stage and REM sleep across the sleep period;
2. Analysis of instability and fragmentation measures during NREM and REM sleep, including the CAPs and arousals;
3. Analysis of spectral composition of EEG during the pre-arousal/awakening period, including the variation of the relative power (PR) of six EEG frequencies during the pre-arousal/ awakening relative to a baseline periods and comparison of PRs variations between iRBD patients and controls, within each spectral band, sleep stage and type of arousal (arousal/ awakening).
RESULTS
Ten iRBD patients (with a median disease duration of 3.5 years) and 15 healthy control subjects were included. In control group, the stage N3 length declines across the night, with significant differences even in the first to second sleep cycles. In iRBD group, the
ix
stage N3 length distribution is significantly different across the first four sleep cycles and the decline from cycle I to cycle II was practically imperceptible in this group. iRBD patients also show less REM sleep.
iRBD registered a higher spontaneous arousals index (total, during NREM and REM sleep) and a lower subtype A1 rate and length, while phase A2 and A3 subtypes parameters did not differ between the two groups. In NREM sleep, the percentage of arousals non-associated with synchronization (K-complexes or delta bursts) was higher in iRBD.
Concerning the spectral analysis, during NREM sleep controls presented a delta activity increase and a theta, alpha, sigma and beta decrease from baseline to pre-arousal/ awakening period. iRBD patients presented a similar profile, except for theta increase and loss of sigma reduction during stage N2. During REM sleep, sigma activity remained unchanged and alpha activity decreased in pre-arousal/awakening period in iRBD patients. When analysing arousals and awakenings separately, iRBD patients differed from controls by the lack of higher sigma and beta decrease and a greater low sigma decrease during the pre-awakening period.
DISCUSSION
iRBD patients showed a less stringent decrease of stage N3 length across the night, which may reflect a homeostatic and circadian sleep system dysregulation. iRBD patients were associated with higher expression of instability and fragmentation parameters, specifically in spontaneous arousals occurring outside the protective framework of delta waves during NREM sleep, which may reflect a lower level of synchronization of thalamo-cortical neurons in iRBD. This may be a possible mechanism for the sleep fragmentation increase.
In both groups, pre-arousal/ awakening spectral changes during NREM sleep were directed toward sleep maintenance (higher delta power), except for the sigma band activity which seemed to be impaired in iRBD patients. Considering the sleep-promoting influence of sigma activity, the tonic decrease of sigma activity may predispose the cortex cerebral to greater fragmentation and instability during sleep. iRBD patients also differed in awakening spectral analysis, by the higher expression
x
of activation rhythms (higher beta) and lower expression of sleep promoting rhythms (lower sigma).
Collectively, these results support our initial hypothesis, suggesting that iRBD is a more generalized sleep disorder, also affecting NREM sleep, namely through the arousal system dysregulation. Future studies may explore the evolution of these microstructural and macrostructural parameters along the natural history of iRBD and characterize the clinical expression of NREM sleep involvement in iRBD, namely correlating the excessive diurnal somnolence with these parameters.
xi
INDEX
1. Introduction.………..………... 1
1.1 Normal sleep physiology ……….……….……...……… 3
1.2 REM sleep behavior disorder.…..……….……….. 8
1.2.1 NREM sleep pathology in iRBD………..………...…… 9
2. Hypothesis, objectives and expected results……….……….. 12
2.1 Hypothesis ………...……….……. 13 2.2 Objectives …..……… 14 2.3 Expected results ……...………..……….…… 15 3. Methods ….………... 16 3.1 Experimental setup ….………..………... 17 3.1.1 Participants ……….…….. 17
3.1.2 Nocturnal sleep recording ……….. 18
3.2 Data analysis ….………..………. Re-infor 18 3.2.1 Sleep stage scoring ………. 18
3.2.2 Seep instability and fragmentation parameters ……….. 19
3.2.3 Pre-arousal/ wake spectral EEG activity………….…………. 20
3.2 Statistical analysis ………..……….. 21
4. Results ….………... 23
4.1 Demographic and clinical characteristics ………..………... 24
4.1 Macrostructural sleep features ………... 25
4.3 Fragmentation and instability parameters ……….…………... 28
4.4 Pre-arousal/ awakening period spectral analysis ……….…. 29
5. Discussion ………... 34
6. Conclusion and study limitations ………..………... 44
7. Bibliography ………... 47
8. Appendices and annexes ………….………... 55
8.1 Sleep features expressed in polysomnographic signals ……….... 56
8.2 Diagnostic criteria for REM sleep behaviour disorders …..…….... 58
8.3 Selected arousals distribution over sleep cycles and phases…… 59
8.4 Mean RP ratios over 30-sec pre-arousal period in delta band ….. 60
xii
ABBREVIATIONS
AASM– American Association of Sleep Medicine CAP – Cyclic alternating pattern
EEG – Electroencephalogram EOG – Electrooculogram EMG – Electromyogram
EDS – Excessive diurnal somnolence FFT – Fast Fourrier Transform
Hz – Hertz
iRBD – idiopathic RBD
LDT – Laterodorsal tegmental nuclei NREM sleep– Non REM sleep
OSAS – Obstructive sleep apnea syndrome PD – Parkinson disease
PPT – Pedunculopontine tegmental nuclei PSG –Polysomnography
RAS – Reticular activation system
REM sleep – Rapid eye movements sleep RBD – REM sleep behavior disorder RSWA - REM sleep without atonia
xiii
LIST OF TABLES
Table 4.1 Demographic and clinical characteristics. 24
Table 4.2 Behavioral and polysomnographic characteristics of iRBD. 25
Table 4.3 Sleep scoring parameters. 25
Table 4.4 PSG parameters in the sleep cycles. 26
Table 4.5 Sleep fragmentation and instability parameters. 28
Table 4.6 Spectral composition of EEG during the pre-arousal/ wake
periods.
xiv
LIST OF FIGURES
Figure 4.1 Distribution of REM, NREM sleep and N3 stage across the
night.
27
Figure 4.2 Spectral composition of EEG during the pre-arousal/
awakening periods.
1
2
Sleep disruption is a major and sometimes inaugural manifestation of neurodegenerative diseases, especially for alpha-synucleinopathies.1 The evaluation
of sleep disturbance may provide a detailed window into the underlying pathophysiologic mechanism of these disorders, while the daytime functioning is still unchanged.
In this chapter, the author makes a brief review on the physiological and functional characteristics underlying the normal sleep and describes the state-of-the-art regarding the REM sleep behavior disorder, highlighting the most pertinent aspects to the present work.
3
1.1 NORMAL SLEEP PHYSIOLOGY
In the sleep laboratory, sleep is defined by measuring the electrical activity of cortical neurons and muscle cells. Scalp electrodes record the electroencephalogram (EEG), electrodes placed on skeletal muscles record the electromyogram (EMG), and electrodes placed near the ocular globe record the electrooculogram (EOG). Collectively, these electrophysiological techniques are called polysomnography (PSG).
EEG signal results from the extracellular flow of current associated with summated excitatory and inhibitory postsynaptic potentials. The recorded electrical activity is characterized by co-occurrence of interdigitate EEG rhythms, traditionally divided into frequency bands. Desynchronized low-amplitude high-frequency activity (including alpha and beta bands) is the typical expression of cortical cell activation and is implicated in brain functions as arousal and activating systems during sleep; this activity is mediated by afferents coming from the brainstem and basal forebrain. On the contrary, synchronized high-amplitude low-frequency activity (delta band) seems to reflect the intensity of recuperative functions of sleep and to play a pivotal role in homeostatic organization of brain activity across sleep period2,3; this activity is
mediated by thalamocortical neuronal circuitry, which block or attenuate the depolarizing influence of ascending signals, thus modulating the susceptibility of cerebral cortex to activating stimuli.2,3
Beyond these elementary sleep rhythms, different vigilance states - wakefulness and sleep states – are identified by visual analysis of polysomnographic recordings, based on a confluence of electrophysiological and behavioral patterns: in the normal adult, wakefulness is defined by a desynchronized, low-amplitude high-frequency EEG activity (predominantly, beta and alpha rhythms); non-rapid-eye-movement (NREM) sleep is indicated by a progressive increase of synchronized, high-amplitude low-frequency EEG activity (predominantly, theta and delta rhythms) and by a muscle tone decline; and REM sleep is characterized by a desynchronized low-amplitude higher-frequency EEG activity (predominantly, theta range activity), coupled with a complete loss of muscle tone (REM sleep muscle atonia). In the course of NREM sleep, the EEG pattern evolves from the stage N1 (with a predominant theta activity) to the stage N2 (characterized by the appearance of thalamocortical spindles and K-complexes in
4
EEG) and the stage N3 (characterized by prominent delta waves). NREM and REM sleep cycles (so-called ultradian sleep cycles) are repeated 4-6 times per night, approximately every 90 minutes, and shape the macrostructure of sleep, graphically represented by a sleep hypnogram.2 See Appendix 8.1. Generally, a healthy adult
sleeper will have a sleep efficiency ≥ 85% (that is, ≤15% of the total time in bed will be spent wake), NREM sleep accounts for 75-80% of total sleep time (TST, 1-5% of stage N1, 40-55% of stage N2 and 15-25% of stage N3) while REM sleep accounts for 20-25% of TST.3
Several regulatory mechanisms influence the sleep process. The propensity for sleep results from combined effects of the circadian system (termed process C, that is entrained by environmental factors such as light or temperature and mediated by suprachiastamic nucleus in anterior hypothalamus, causing a greater or lesser sleep propensity at specific times of the day) and the homeostatic system (termed process S, that provides the drive for sleep in response to prior wakefulness – sleep pressure).7
A reliable electrophysiological measure of homeostatic integrity of sleep can be obtained through the differential distribution of stage N3 and delta frequency power throughout the sleep period: in physiological conditions, the degree of pre-sleep homeostatic sleep pressure increases gradually with increasing time spent wake, which results in initial elevation of time spent in stage N3 during the first sleep cycles, followed by progressive decline, as the sleep pressure declines across the night; furthermore, after sleep deprivation, increased sleep drive results in increase in stage N3 time and delta power, suggesting a distinct physiological role in the homeostatic control of sleep.3
Circadian and homeostatic inputs change slowly over the course of the day. However, the normal transition from the wake state to NREM and REM sleep take place over just seconds to minutes. The ultradian system (alternation between REM-NREM sleep) is a third regulator, which mediates the level of arousability and EEG synchronization and allows the rapid transition between the three states of vigilance. This activity occurs because the reciprocal antagonism between wake- and sleep-promoting influences, originating in brainstem and hypothalamic neuronal networks.
5
The reticular activation system (RAS), at the rostral pontine-caudal midbrain, promotes the cortical desynchronization, typical of wake or REM sleep states, through two main ascending pathways:4,5
I. Dorsal pathway or thalamocortical projection system: mainly comes from cholinergic pedunculopontine and laterodorsal tegmental nuclei (PPT-LDT), which innervate the thalamic reticular and relay nuclei thus opening the way for thalamocortical transmission and cortical activation;
II. Ventral pathway: mainly contains monoaminergic neurons of the locus coeruleus, raphe nuclei, parabrachial nucleus, periaqueductal gray matter and tuberomammillary nucleus, which send axons, through the lateral hypothalamus, diffusely to the basal forebrain and cerebral cortex.
All of these circuits within the brainstem, forebrain ad hypothalamus are required for shifting the cortical electrical activity from the production of high-amplitude frequency activity (predominant during the NREM sleep), to the production of low-amplitude high-frequency activity (predominant during the wakefulness and REM sleep). The main biochemical difference between wake and REM sleep is that during REM sleep only the cholinergic ascending arousal system (dorsal pathway) is activated, which is responsible for regulating the cortical components of REM sleep. This system also sends descending projections, via ventral medulla, to the alpha motor neurons, which hyperpolarizes the spinal motor neurons and produces REM sleep atonia pattern.4,5
At sleep onset, the RAS inputs diminish under the influence of circadian and homeostatic signals. Furthermore, RAS is actively inhibited by the GABA-ergic and galaninergic inhibitory afferents, originating in the ventrolateral preoptic nuclei (VLPO), localized in posterolateral hypothalamus.4,5 The ascending activation decrease allows
synchronized thalamocortical rhythms to emerge and prevail across the NREM sleep. Later, such thalamocortical rhythms are abolished by the renewal of the RAS dorsal pathway in REM sleep, and of both RAS pathways in waking. This mutual antagonism between the wake-promoting RAS system and the sleep-promoting VLPO system, in which each half strongly inhibits the other, provides the substrate of the flip-flop switch that ensures rapid and complete transitions between wake-NREM-REM sleep states and prevents intermediate states.
6
Despite this macrostructural architecture, physiological sleep does not exclude the occurrence of phasic events of transient cortical activation. The term arousal refers to brief intrusion of wakefulness into sleep; it is defined as an abrupt shift of the ongoing EEG activity toward desynchronized activity, including alpha, theta or beta frequencies but not spindles that, contrarily to awakening, lasts up to 15 seconds.8 See Appendix
8.1.
During NREM sleep, arousal phenomena may be associated to different morphological features: besides the above mentioned desynchronization-type arousal, up to 90% of arousals are preceded by synchronized EEG activity bursts (delta activity or K-complexes) which, in a paradoxically way, reflect the mobilisation of anti-arousal and sleep-promoting swings that attenuate the cerebral cortex susceptibility to depolarizing influence of arousal system.3,9 In physiological conditions,
during NREM sleep, synchronization and desynchronization components of arousal response are structurally embedded in a spontaneous pseudo-periodic biphasic EEG rhythm called cyclic alternating pattern (CAP).10,11 CAP is characterized by a cyclic
alternation of cerebral activation sequences (phase A) followed by deactivation periods of return to background theta-delta activity (phase B). Phase A is further classified into three different subtypes (A1, A2 and A3) considering the synchronization component prevalence (A1 more than 80%, A2 from 50% to 80% and A3 less than 50%). See Appendix 8.1. The differences among these arousal-related events indicate the dynamic balance between rhythms predominantly wake-promoting (subtype A2 and A3, and isolated arousals not preceded by synchronization activity) and rhythms predominantly sleep-promoting (subtype A1). In physiological conditions, the stage progression across the NREM sleep is influenced by the differential distribution of arousal-related phasic events across the sleep cycles:3,11,12 subtype A1
appears mainly during periods of high homeostatic pressure (first sleep cycles and at the onset of each sleep cycle, where they accompany the progressive transition from N1 stage to N2 and N3 deeper sleep stages), thus promoting the process of build-up and maintenance of EEG synchronization; on the contrary, subtypes A2 and A3 and isolated arousals occur mainly when the homeostatic pressure is low (last sleep cycles and close of the end of each sleep cycle, where they prepare the progressive transition to desynchronized EEG background), thus promoting the onset of REM sleep or final wake. Therefore, the arousal phenomena during sleep are not limited to a single
7
pattern and are not randomly scattered across the sleep but appear structurally distributed within, reflecting the relationship between state arousability and the tendency of state shifts according to its position within the course of sleep. Evidence suggests that this reciprocal relationship between wake- and sleep-promoting arousal-related events would be similar to that seen with the so-called flip-flop circuitry, implicated on macrostructural regulation of sleep (ultradian NREM-REM sleep cyclicity).13,14 As at macrostructural level, the thalamocortical circuitry influence the
arousal system and the cortical activation state: more specifically, thalamocortical neuronal circuitry generate burst firing in the delta frequency range (K-complexes and delta burst) and sleep spindles in response to incoming arousing stimuli, synchronizing diencephalon and cerebral cortex, thus attenuating the cortex cerebral susceptibility to depolarizing cholinergic influence of activating inputs.2,3,15 In contrast, a transient
reduction of this oscillatory thalamic activity could provide a time window for sensorial transmission through the thalamic relay. This may be one of the mechanisms by which the ascending cholinergic pathways are able to induce desynchronization and arousal. Moreover, experimental evidence has shown that thalamic activity depends not only on ascending cholinergic influences but also on non-cholinergic preoptic anterior hypothalamic and basal forebrain regions, which could also act directly on the cortex influencing the arousal response.16
Beyond the information that sleep stage scoring and arousals analysis provides, the activity of certain frequency bands provides also reliable information about the quality of the sleep. Spectral analysis of sleep EEG microstructure in the time-frequency domain has showed how much the different rhythms coexist at all time in the sleep. Delta band (<4 Hz) has been the most intensively investigated band; its role in homeostatic and ultradian process of sleep was above described. Sigma activity (12-15 Hz, produced by sleep spindles mainly during stage N2 of NREM sleep) seems to be the expression of the thalamic filter to the passage of sensory input to the cortex, which may serve to promote sleep continuity. Spindles might also have a role in neuronal plasticity, learning and memory consolidation during the sleep.3 Higher
frequency bands, such as alpha and beta, reflects within-sleep arousal level.3,62
As already discussed, spontaneous arousal-related events are a physiological phenomenon acting as an intrinsic microstructural component of sleep organization, particularly in NREM sleep, occurring often within CAP structure and in close temporal
8
relation with stage shifts. Nevertheless, arousal-related events may also be elicited in response to sleep-disturbing factors. When pathological arousals occur in excess they may impair the sleep continuity. Sleep fragmentation reduces sleep restorative properties and may determine diurnal symptoms such as excessive daytime somnolence. In general, pathologic arousal response differ according to the specific mechanism of sleep disorders.3 In some disorders, like breathing-related sleep
disorders, exogenous or endogenous stimuli promoting arousal may be identified, however in other cases arousals may be only associated to oscillations of the arousal level. Regarding neurodegenerative disorders, despite the cause of sleep fragmentation may be attributed to several factors (including comorbid conditions, mediation and age-related modifications), the neurodegenerative process itself may play a central role. A typical example is the alpha-synucleinopathies, in which sleep dysregulation is a manifestation with instrumental value for its diagnosis.
1.2 REM SLEEP BEHAVIOR DISORDER
REM sleep behavior disorder (RBD) is a distinct parasomnia, firstly described in humans by Schenck et al in 1986.17 It is characterized by a partial or complete loss of
normal skeletal muscle atonia during REM sleep, which allow the emergence of violent nocturnal dream enactment behaviors that are potentially injurious to the patient or to the patient´s bedpartner.17 In the sleep laboratory, such activity is correlated with an
enhanced EMG activity during REM sleep, called REM sleep without atonia (RSWA). The RBD prevalence in the general population is 0.5%18 and it is more common in
people over 50 years of age.
Clinical and pathological evidence has shown that idiopathic iRBD (iRBD) precede, in 80% of cases, the later development of neurodegenerative diseases (symptomatic RBD), in particular alpha-synucleinopathies (such as Parkinson disease, dementia with Lewy bodies and multiple system atrophy) by several decades.19 These data
suggest that iRBD may represent an early clinical manifestation of an evolving neurodegenerative disorder, primarily impairing the dorsolateral pons and rostral medulla, implicated areas in the REM sleep muscle atonia, and further impairing other upper structures progressively, including midbrain and neocortex.20 The fact that iRBD
9
often heralds future Parkinsonism and/or dementia makes this entity a potential therapeutic target for future preventive treatments.
RBD is believed to arise from the degeneration of pontomedullary structures that mediate the REM sleep atonia.21 During normal REM sleep, the complete muscle
atonia of somatic musculature results mainly from the active GABA/ glycininergic inhibition of the lower motor neuron via glutaminergic neurons of the subcoeruleus (or sublaterodorsal) nucleus localized in the pons. This neuronal mechanism was primarily demonstrated in cats by Michel Jouvet in 195922,23 and only further
demonstrated in humans with acute vascular and inflammatory lesions housed in pons dorsal tegmentum and ventral part of medulla.24,25,26 Lesions in the subcoeruleus
nucleus and ventromedial medulla release the tonic inhibition on spinal motoneurons leading to RSWA. Others pontine nuclei are known to influence the REM circuitry, including the noradrenergic locus coeruleus and the cholinergic, pedunculopontine and laterodorsal tegmental nuclei, however the exact contribution of these structures to the iRBD phenotype remains under discussion.27
REM sleep dysfunction remains the hallmark of the iRBD pathophysiology. However, currently, several lines of evidence have suggested that an additional component of NREM sleep dysregulation may also be implicated in iRBD phenotype. Nevertheless, the underlying mechanisms and characterization of a presumptive NREM sleep involvement remains to be elucidated. In the following section, it will be described the actual knowledge supporting the involvement of NREM sleep in iRBD.
1.2.1 NREM SLEEP PATHOLOGY IN iRBD
A. CLINICAL DATA
The association of idiopathic or symptomatic RBD with NREM sleep comorbidities, including periodic limb movement of sleep28,29 and NREM sleep parasomnia,30,31,32
suggests an additional contribution of NREM sleep dysregulation in iRBD patients. More recently, Miguel R. and Arnulf I.33 described the first case showing the intrusion
of typical REM sleep phasic activity into NREM sleep, including iRBD-like dream-enactment behaviors, in a patient with symptomatic RBD and Parkinson disease. The
10
authors concluded that this case may illustrate a tendency of iRBD patients to exhibit a more generalized sleep motor dysregulation over the disease course.
B. PHYSIOLOGICAL DATA
Changes have been reported in relation to NREM sleep EEG abnormalities in iRBD. Two studies demonstrated that sleep spindles activity during all stages of NREM sleep is impaired in iRBD when compared to controls.34,35 The authors suggest that the sleep
spindles activity reduction in these patients may reflect the degeneration of pre-thalamic afferent fibers arising from brainstem, which is present at very early stages of alpha-synucleinopathies.
C. PATHOLOGICAL DATA
In neurodegenerative diseases in which iRBD is frequent, neuronal cell loss was early observed in structures modulating the REM sleep (including the subcoeruleus nucleus, ventromedial medulla and PPT/ LDT nucleus) and amygdala.27 Descending fibers of
the subcoeruleus are specifically responsible for RWA in iRBD. Thus, brainstem structures responsible for the pathogenesis of iRBD are also implicated in the above described cortical activation system, which modulate the sleep homeostasis and ultradian cyclicity.
To sum up, currently there is some evidence suggesting the pathological involvement of NREM sleep in iRBD. Based on this actual knowledge about the clinical and pathological signatures of iRBD, we hypothesize that the wake-promoting structures, placed in upper brainstem and implicated in ultradian and homeostatic system, may be a potential target, early involved in neurodegenerative process in iRBD.The co-localization of the structures mediating the wake cholinergic system and the clinical iRBD expression, both localized in the ponto-mesencephalic area, can provide the anatomic basis for the combined dysfunction of these two systems in iRBD patients. Few studies have looked at the arousal system polysomnographic expression during
11
NREM sleep in iRBD. The study of arousal-related events in iRBD constitutes a particularly relevant avenue to attain this question. CAPs and isolated arousals are a fertile ground for sleep disorders manifestations that are related to an unstable sleep condition. The quantitative analysis of sleep EEG may offer a better understanding of arousals and CAPs by providing more sensitive measures for the arousal phenomena study.
12
2. Hypothesis, Objectives
and Expected Results
13
2.1 HYPOTHESIS
We hypothesize that physiological changes that occur in iRBD also affect NREM sleep.
Wake-promoting system dysregulation may be a potential mechanism of NREM sleep impairment in iRBD.
Arousal-related events, expressed as CAP and isolated arousals and composing the microstructural matrix of NREM sleep, provide a sensitive and accurate measure of wake-sleep promoting system instability.
The spectral components of the EEG signal before arousals or awakening would differ between controls and iRBD patients, providing a possible cause for the presumed increase of sleep instability and fragmentation parameters in iRBD patients.
14
2.2 OBJECTIVES
2.2.1 OBJECTIVE 1
To analyze the sleep macrostructural architecture, namely the distribution of NREM sleep and N3 stage across the sleep period.
2.2.2 OBJECTIVE 2
To analyze instability and fragmentation measures during NREM and REM sleep, namely CAP and arousals analysis.
2.2.3 OBJECTIVE 3
To analyze the spectral composition of the EEG during the pre-arousal/ awakening episodes, in comparison to the baseline period.
15
2.3 EXPECTED RESULTS
Based on the hypothesis and objectives stated above, we expect to find NREM sleep changes in iRBD patients, expressed in changes in macrostructural parameters. We further expect to find an increase of sleep instability and fragmentation parameters (namely, arousals and CAPs measures during NREM sleep) in iRBD patients, when compared to controls. We also expected to find a decreased cortical activation of anti-arousal phenomena during the pre-anti-arousal/ awakening period (as demonstrated by a lower delta and/ or sigma range reactivity), thus suggesting this might be the underlying mechanism for the presumed greater instability achieved in iRBD.
16
17
3.1 EXPERIMENTAL SETUP
3.1.1 PARTICIPANTS
All patients with diagnosis of iRBD between January 2007 and December 2015 were retrospectively screened for this study from the Sleep Laboratory data base from the Department of Neurosciences and Mental Health, Hospital Santa Maria (Centro Hospitalar Lisboa Ocidental). All iRBD patients have been previously referred to a neurology or sleep disorders clinic due to a history of nocturnal motor agitation. Eligible patients for this study had a PSG-confirmed iRBD diagnosis, according to the actual International Classification of Sleep Disorders criteria.36SeeAppendix 8.2.The age of
iRBD symptoms onset, repertoire of nocturnal behaviors in iRBD patients, current medication, presence of excessive diurnal somnolence or other sleep symptoms suggesting sleep comorbidities were recorded in an interview conducted by a physician with specialized training in sleep disorders at the PSG time. All patients had a baseline neurologic examination excluding the presence of any neurodegenerative disease clinical evidence, according to UK brain bank criteria for Parkinsonism37 and
DSM-IV criteria for dementia.38
Healthy controls subjects were selected from the Sleep Laboratory database by the main investigator (R.M.). All controls have been previously observed in a neurology or sleep disorders outpatient clinic. The reasons for performing a PSG were: snoring, reevaluation of continuous positive airway pressure (CPAP) therapy indication in obstructive sleep apnea syndrome (OSAS) patients after ponderal loss and restless legs syndrome. Furthermore, the presence of RBD symptoms, or other symptoms suggesting any other uncontrolled sleep disorder, was ruled out by a structured sleep questionnaire administered to all subjects and/or to his/her bedpartner at the PSG time. In order to avoid selection bias and to increase randomness, we chose the first consecutive subjects within the same age and sex range.
Non-eligibility criteria for iRBD patients and controls inclusion were: (1) clinical or polysomnographic diagnosis of other sleep disorder (namely, apnea-hypopnea index (IAH) > 5 per hour of total sleep, respiratory disturbance index (RDI) > 10 per hour of total sleep, periodic limb movements index (PLMI) > 15 per hour, NREM sleep parasomnia, central disorders of hypersomnolence, nocturnal painful syndromes, insomnia or other condition associated with increases arousal), (2) suggestive history
18
of psychiatric or other neurological disorders (including epilepsy, brain tumors or stroke), and (3) absence of sufficient information on clinical records.
This study was approved by the Ethics Committee of the Hospital de Santa Maria (see Appendix 8.5).
3.1.2 NOCTURNAL SLEEP RECORDING
Controls and patients underwent in-laboratory or ambulatory PSG, in accordance with American Academy of Sleep Medicine (AASM) 2007 standards, which included six EEG channels (scalp electrodes located using the International 10-20 system, placed at C3, C4, O1, O2 and, in most patients, F3 and F4, all referred to the contralateral mastoid), right and left electrooculogram, bipolar submental and anterior tibialis electromyograms, electrocardiogram, oronasal air-flux, chest and abdominal respiratory effort via piezo-electric belts, and pulse oximetry. All iRBD patients performed one in-laboratory video-PSG, which included a synchronized video and audio monitoring. In both groups, the EEG signals were amplified, conditioned by filters (high-pass filter at 0.2 Hz; low-pass filter at 60 Hz), sampled with 256 Hz, digitally filtered and stored with a resolution of 125 Hz using DOMINOTM software. Some
subjects were submitted to PSG over two consecutive nights; however, in order to equalize the impact of an eventual first-night effect, in these cases it was only considered the first night PSG.
3.2 DATA ANALYSIS
3.2.1 SLEEP STAGE SCORING
Sleep staging was scored manually at 30-sec intervals based on the American Academy of Sleep Medicine (AASM) classification39,40 by two independent examiners
with specialized training in sleep and polysomnography (one of them was R.M.) in order to ensure a concordance final. The epochs with REM without atonia, respiratory events and periodic limb movements were marked manually on PSGs. Audio and video recordings were examined to detect motor-behavioral activity during REM sleep. Conventional PSG measures included: time in bed, total sleep time (time from sleep onset to the end of the final sleep epoch minus nocturnal time awake), sleep latency (time from lights out to sleep onset), REM latency (time from sleep onset to the first
19
REM sleep epoch), wake after sleep onset, sleep efficiency (ratio between total sleep time and time in bed), percentage of total sleep time spent in stage 1 (N1%), stage 2 (N2%), stage 3 (N3%) and REM sleep (REM%). Each PSG recording was subdivided into sleep cycles. All sleep cycles started with the first epoch of the NREM sleep and ended with the last epoch of the included REM episode. Cycles without REM sleep were not considered (the cycle was incorporated in the next one, in order to have REM sleep). The NREM sleep periods preceding the last awakening and not followed by REM epochs were not included in the cycle calculation. For each sleep cycle, NREM and REM sleep length were analyzed. In iRBD patients, REM sleep without atonia was calculated as % of 30-sec REM epochs with more than 50% of any EMG activity (phasic and tonic) with an amplitude more than twice the background EMG (EMG activity was scored for the chin muscle).
3.2.2 SLEEP INSTABILITY AND FRAGMENTATION PARAMETERS
Cortical arousal and CAP was visually scored by the main investigator (R.M.).
Cortical arousals were defined according to AASM criteria.40 In NREM sleep, arousals
not preceded by (or mixed with) synchronized activity (K-complexes or delta bursts) were quantified separately. See Appendix 8.1. Considering only the spontaneous arousal, arousal index (number of arousals per hour of sleep) was calculated in total sleep time, NREM and REM sleep, including isolated and arousal incorporate in CAP events.
CAPs was visually scored following the criteria published by Terzano et al.41 that define
CAP as a spontaneous rhythm during NREM sleep composed of an EEG transient pattern (phase A) separated by intervals of EEG background activity (phase B). Three phase A subtypes (A1, A2 and A3) were described according to the prevalence of the synchronization component. See Appendix 8.1. CAP data was dichotomized into A1
versus A2+A3 phases CAPs. For each phase A subtype, phase A index (number of a
given phase A subtype per hour of sleep), rate (percentage ratio of phase A time to NREM sleep time) and duration (the mean duration of each phase A subtype) were calculated. See Appendix 8.1.
20
3.2.3 PRE-AROUSAL/ AWAKENING SPECTRAL EEG ACTIVITY
It was selected the two first spontaneous arousals or awakenings for each sleep phase, and for each descending and ascending sleep slope in each sleep cycle. It was included just the ones with a minimum window of 120 seconds of stable sleep preceding their onset; the criteria of sleep stability was defined by the absence of phasic events (autonomic or cortical arousals), respiratory events, sleep phase transitions or any EEG artefacts during this period. Arousals or awakenings occurring during N1 sleep stage were not analyzed because this is considered a transitory and unstable sleep stage. The 30 seconds period immediately preceding the selected arousals/awakenings onset were selected for the further EEG spectral analysis (in relation to arousals embedded in CAP A2 or A3 phases, the beginning of event was assumed be at the exact onset of the synchronization component, determined by visual inspection). Fast Fourier Transform (FFT) analysis42 was performed on the left
derivation C3-A2 in all patients in order to reduce the potential EOG artefacts and to maximize the amplitude of synchronized patterns, as some patients did not have frontal derivation. This spectral analysis method mathematically decomposes the original EEG oscillatory activity into its pure sinusoidal components, each of a different frequency, thus allowing to quantify the EEG activity oscillations that were not visually discernible, despite being sensitive to contamination of EEG signals by even small artefacts. The EEG spectral powers were calculated for 1-sec non-overlapping epochs using the DOMINOTM software. Six frequency bands were defined: delta (0.2-4.0 Hz),
theta (4-8 Hz), alpha (8-12 Hz), low sigma (12-14 Hz), high sigma (14-16 Hz) and beta (>16 Hz) bands. For each band, the absolute power (µV2/Hz) within each 1 sec window
was calculated along the 30-sec pre-arousal/wake period. To standardize the absolute power across subjects, relative power or RP (the proportion of power in one spectral band vis-à-vis all other bands) was used in the statistical analysis. In order to avoid any interindividual variability, the RPs at each second of the pre-arousal/wake period were compared with the RPs mean during the previous baseline period according to the following equation:
( ) = ∑ ( )
30
where RP indicates the relative power, t indicates each second along the 30-second pre-arousal/ awakening period (t1, t2, t3 … up to t30), and ∑ ( ) indicates the
21
mean of RP during the baseline period. It was assumed that the baseline period corresponded to first 30-sec of the 120-sec sleep stable period previously defined for each selected arousal or awakening. Using this equation, the mean baseline RPs were normalized to the value 1 and eventual oscillations during the 30-sec pre-arousal/wake period were compared to the value 1, within each frequency band.
.
To test the hypothesis that the magnitude of potential changes of pre-arousals/wake spectral power differ between iRBD and controls, the arithmetic mean of RP ratios within each spectral band was calculated in each study group and compared between them. Appendix 8.4 is an illustrative example of that.
Assuming the continuum of arousal response hypothesis, in which arousal and awakening probably represent neurophysiological events with different activation level, these two events were analyzed separately.
3.3 STATISTICAL ANALYSIS
Data were analyzed using descriptive statistics and exploratory data analysis. Continuous variables were expressed as median ± standard deviation. Categorical variables were expressed as frequencies (percentages).
Demographic, clinical, sleep fragmentation and instability variables distributions were compared using the non-parametric Mann-Whitney U test (2 samples) and Kruskal-Wallis test (more than two samples). The results of statistical inference were presented as p-value.
Concerning the FFT spectral analysis, two comparisons were made:
1. Pre-arousal/awakening period RPs, within each spectral band, were compared with respective baseline period, considering separately iRBD patients and controls, and considering separately each sleep stage (N2, N3 and REM), and arousals or awakenings events. For this analysis, it was used the non-parametric Mann-Whitney U test and results were presented as p-value.
2. The magnitude of changes of pre-arousals/awakening spectral power was compared between iRBD and controls using the arithmetic mean of RP ratios within each spectral band, considering also separately each sleep stage and arousals or awakenings events. Because each iRBD patient and control subject was associated to several selected arousals or awakening events, the mean RP ratios were compared
22
between two groups using GLM (generalized linear model) procedure of repeated-measures (ANOVA ONE WAY with repeated repeated-measures). As the number of arousals or awakenings was different for each subject, Model with Sum of Squares Type III were chosen. The results of statistical inference were presented as p-value and
observed power (credibility of correctly rejecting the null hypothesis) or 1-observed power (credibility of correctly no rejecting the null hypothesis). Significance was taken
as a p-value ≤ 0.05.
Statistical analysis were performed under collaboration of Teresa Marques, professor in Laboratório de Biomatemática from Faculdade de Medicina da Universidade de Lisboa. It was used the IBM® SPSS® Statistics program, version 23.0.
23
24
4.1 DEMOGRAPHIC AND CLINICAL CHARACTERISTICS
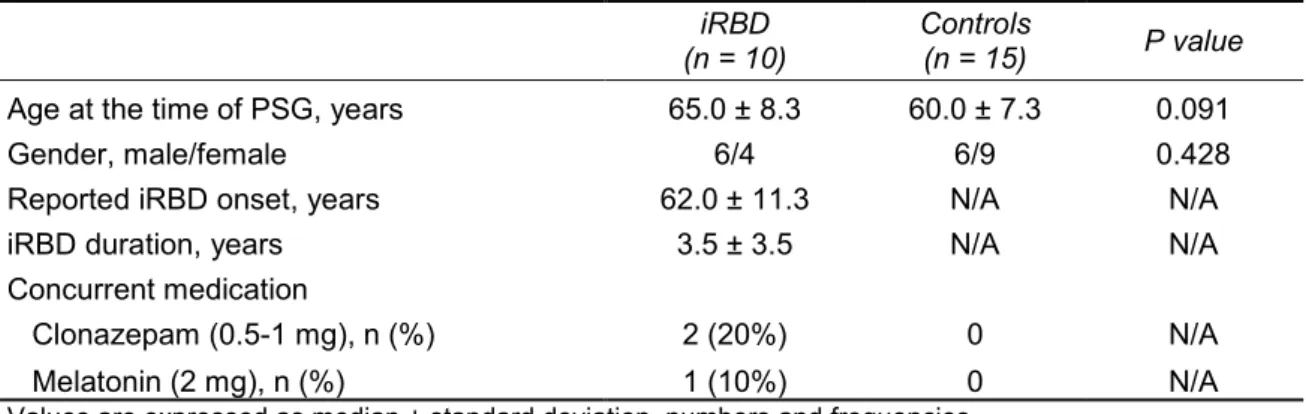
The iRBD group consisted of 10 patients, 60% men, with a median age at symptoms onset of 62 years (range 41-80 years), a median disease duration of 3.5 years (range 1-10 years) and a median age at the time of PSG of 65 years (range 50-77 years). Three iRBD patients (30%) were under iRBD-specific medication at the time of PSG (clonazepam and melatonin). The control group consisted of 15 healthy control subjects, 40% men, with a median age at the time of PSG of 60 years (range 51-77 years). There was no difference in age at PSG time or gender between the iRBD and the control group. See Table 4.1.
Table 4.1 Demographic and clinical characteristics.
iRBD
(n = 10)
Controls
(n = 15) P value Age at the time of PSG, years 65.0 ± 8.3 60.0 ± 7.3 0.091
Gender, male/female 6/4 6/9 0.428
Reported iRBD onset, years 62.0 ± 11.3 N/A N/A
iRBD duration, years 3.5 ± 3.5 N/A N/A
Concurrent medication
Clonazepam (0.5-1 mg), n (%) 2 (20%) 0 N/A
Melatonin (2 mg), n (%) 1 (10%) 0 N/A
Values are expressed as median ± standard deviation, numbers and frequencies.
CI, confidence interval; iRBD, idiopathic rapid eye movement sleep behavior disorder; N/A, not applicable.
In iRBD group, the median percentage of epochs of REM sleep without atonia was 46.65 ± 19.1% (range, 17.9-75.3%); in subgroup of naïve patient for iRBD treatment, the median percentage of of epochs of REM sleep without atonia was 32.20 ± 15.8% (range, 17.9-57.7%). All iRBD patients reported nocturnal motor-behavioral episodes suggesting dream enactment behaviors. According to patient´s bedpartner report or video-PSG, jerky movements affected at least 60% of patients, purposeful motor episodes were present in 100% of patients (including facial expressions, gesturing, punching, kicking, bicycling and jump out of bed) and vocalizations were identified in 60% of patients (including intelligible sleeptalking and crying). The results are summarized in Table 4.2.
Only one iRBD patient presented symptoms of excessive diurnal somnolence requiring wake-promoting treatment (Modafinil 100 mg per day). This patient did not have a narcoleptic-like phenotype on Multiple Sleep Latencies Test (mean sleep
25
latency of 10.5 minutes across 5 naps, without sleep onset REM episodes). Due to this low frequency, it was not possible to correlate the sleepiness with fragmentation and instability polysomnographic parameters.
Table 4.2 Behavioral and polysomnographic characteristics of iRBD.
REM sleep without atonia*, % 46.65 ± 19.1
Reported motor-behavioural episodes
1. Jerky movements, n (%) 6 (60%)
2. Purposeful motor
episodes, n (%) Facial expressions (laughing) 2 (20%)
Gesturing (pointing, grabbing, objects manipulation, throw away) 4 (40%)
Punching 4 (40%)
Kicking 5 (50%)
Others (bicycling, jump out of bed) 2 (20%)
3. Vocalizations, n (%)
Sleeptalking 5 (50%)
Crying 2 (20%)
Values are expressed as median ± standard deviation, number and frequencies.
*Calculated as % of 30-sec REM epochs with more than 50% of any EMG activity (phasic and tonic) with an amplitude more than twice the background EMG. EMG activity was scored for the chin muscle.
4.2 MACROSTRUCTURAL SLEEP FEATURES
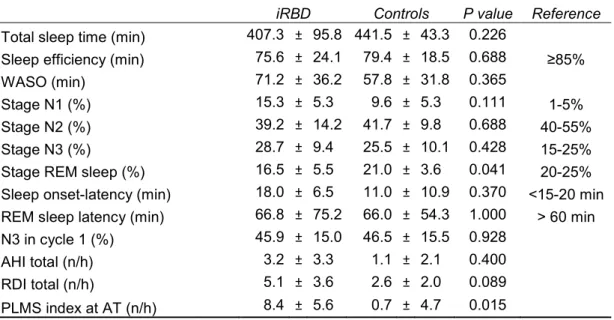
General sleep scoring parameters are described in Table 4.3. Comparing to reference values, the sleep efficiency was decreased, due to a WASO increase, and the percentage of stage N1 was increased in both groups. All sleep scoring parameters did not differ between the groups, except for lower percentage of REM sleep and higher PLMS index in iRBD.
Table 4.3 Sleep scoring parameters.
iRBD Controls P value Reference
Total sleep time (min) 407.3 ± 95.8 441.5 ± 43.3 0.226
Sleep efficiency (min) 75.6 ± 24.1 79.4 ± 18.5 0.688 ≥85%
WASO (min) 71.2 ± 36.2 57.8 ± 31.8 0.365
Stage N1 (%) 15.3 ± 5.3 9.6 ± 5.3 0.111 1-5%
Stage N2 (%) 39.2 ± 14.2 41.7 ± 9.8 0.688 40-55%
Stage N3 (%) 28.7 ± 9.4 25.5 ± 10.1 0.428 15-25%
Stage REM sleep (%) 16.5 ± 5.5 21.0 ± 3.6 0.041 20-25% Sleep onset-latency (min) 18.0 ± 6.5 11.0 ± 10.9 0.370 <15-20 min REM sleep latency (min) 66.8 ± 75.2 66.0 ± 54.3 1.000 > 60 min N3 in cycle 1 (%) 45.9 ± 15.0 46.5 ± 15.5 0.928
AHI total (n/h) 3.2 ± 3.3 1.1 ± 2.1 0.400 RDI total (n/h) 5.1 ± 3.6 2.6 ± 2.0 0.089 PLMS index at AT (n/h) 8.4 ± 5.6 0.7 ± 4.7 0.015
26
Values are expressed as median ± standard deviation, number and frequencies.
AIH, apnea-hypopnea index; AT, anterior tibialis; iRBD, idiopathic rapid eye movement sleep behavior disorder; PLMS, periodic leg movements during sleep; RDI, respiratory disturbance index; WASO, wake after sleep onset.
In iRBD and controls subjects, sleep was organized into up to five complete sleep cycles. The Table 4.4 and Figure 4.1 present the macrostructural parameters of each sleep cycle. For the statistical comparison of NREM sleep and stage N3 length across the sleep cycles, the 5th cycle data was excluded in both groups, because it was
present in only few patients from each group. In the control group, the stage N3 length declines across the night (p< 0.05). In iRBD group, the stage N3 length declines also across the night (p< 0.05) but no statically differences were observed in the post hoc analysis (p> 0.05). The decline from cycle I to cycle II was practically imperceptible in this group (see Figure 4.1).
Table 4.4 PSG parameters in the sleep cycles.
I cycle II cycle III cycle IV cycle V cycle
Comparing within each group
Group: iRBD P value Bonferroni
Subjects No. 10 10 10 8 1 TST (min) 89.5 ± 39.0 110.8 ± 53.5 117.6 ± 23.5 74.4 ± 23.0 109.5 0.070 - NREM (min) 78.6 ± 33.3 94.2 ± 50.2 96.0 ± 22.6 62.2 ± 22.0 88.5 0.097 - N3 (min) 38.3 ± 16.4 38.1 ± 42.8 24.1 ± 12.1 11.4 ± 13.7 0 0.034 All p> 0.05 REM (min) 15.8 ± 11.1 16.6 ± 9.0 21.6 ± 14.3 12.1 ± 5.1 21 0.561 - Group: Controls Subjects No. 15 15 15 12 7 TST (min) 108.7 ± 46.8 101.1 ± 25.7 98.5 ± 26.5 82.1 ± 8.7 63.7 ± 16.7 0.379 - NREM (min) 92.4 ± 44.0 76.9 ± 17.6 72.6 ± 21.5 65.9 ± 5.3 48.2 ± 19.3 0.451 - N3 (min) 48.4 ± 25 32.2 ± 18 20.5 ± 16 14 ± 14 7.2 ± 8.6 0.001 C1 > C3: p=0.001 C1 > C4: p=0.000 REM (min) 15.7 ± 7.6 24.5 ± 16.4 27.3 ± 11.2 19.9 ± 8.83 17.6 ± 2.90 0.247 -
Values are expressed as median ± standard deviation and number. NA, not possible. In iRBD control, we excluded V cycle for comparison sleep cycle length within each group.
27
Figure 4.1 Distribution of REM, NREM sleep and N3 stage across the 5 completed sleep cycles. The
values express the mean length of NREM, REM sleep and stage N3 across the sleep cycles. Notice the correspondence between each sleep cycle and the respective REM, NREM sleep and stage N3 length. The grey bars represent the REM sleep length, while the not filled bars represent the NREM sleep and stage N3 length in each sleep cycle. The last graph contains the mean time of each sleep cycle.
28
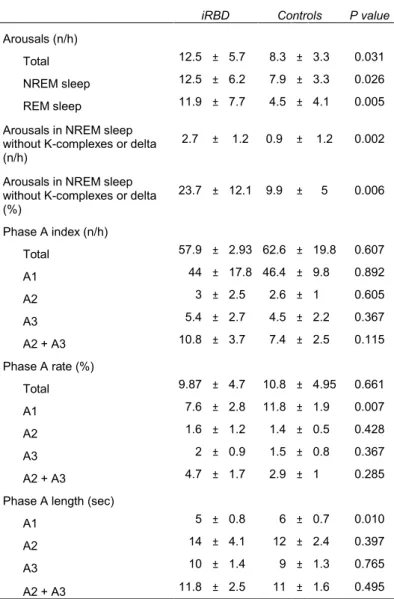
4.3 FRAGMENTATION AND INSTABILITY PARAMETERS
iRBD registered higher spontaneous arousals index, including total, during NREM and REM sleep (p < 0.05). In NREM sleep, the percentage of arousals non-associated with synchronization (K-complexes or delta) was also significantly higher in iRBD (p < 0.05). CAP parameters analysis showed that A1 phase subtype was significantly lower in iRBD patients in terms of rate and length (p < 0.05), while phase A2 and A3 subtypes parameters did not differ between the two groups. These arousals and CAP parameters results did not change when considering only the treatment-naïve iRBD patients. The results are summarized in Table 4.5.
Table 4.5 Sleep fragmentation and instability parameters.
iRBD Controls P value
Arousals (n/h)
Total 12.5 ± 5.7 8.3 ± 3.3 0.031
NREM sleep 12.5 ± 6.2 7.9 ± 3.3 0.026
REM sleep 11.9 ± 7.7 4.5 ± 4.1 0.005
Arousals in NREM sleep without K-complexes or delta (n/h)
2.7 ± 1.2 0.9 ± 1.2 0.002
Arousals in NREM sleep without K-complexes or delta (%) 23.7 ± 12.1 9.9 ± 5 0.006 Phase A index (n/h) Total 57.9 ± 2.93 62.6 ± 19.8 0.607 A1 44 ± 17.8 46.4 ± 9.8 0.892 A2 3 ± 2.5 2.6 ± 1 0.605 A3 5.4 ± 2.7 4.5 ± 2.2 0.367 A2 + A3 10.8 ± 3.7 7.4 ± 2.5 0.115 Phase A rate (%) Total 9.87 ± 4.7 10.8 ± 4.95 0.661 A1 7.6 ± 2.8 11.8 ± 1.9 0.007 A2 1.6 ± 1.2 1.4 ± 0.5 0.428 A3 2 ± 0.9 1.5 ± 0.8 0.367 A2 + A3 4.7 ± 1.7 2.9 ± 1 0.285
Phase A length (sec)
A1 5 ± 0.8 6 ± 0.7 0.010
A2 14 ± 4.1 12 ± 2.4 0.397
A3 10 ± 1.4 9 ± 1.3 0.765
A2 + A3 11.8 ± 2.5 11 ± 1.6 0.495
Values are expressed as median ± standard deviation, number and frequencies.
iRBD, idiopathic rapid eye movement sleep behavior disorder; NREM, non REM sleep; Phase A rate and percentage ratio of phase A time to NREM sleep.
29
4.4 PRE-AROUSAL/ AWAKENING PERIOD SPECTRAL ANALYSIS
To obtain insight into the mechanisms that might have contributed to the altered fragmentation and instability measures, the spectral composition of the EEG signal along the 30 seconds preceding the arousals and awakenings events was evaluated and compared with a previous baseline period. Using the selection criteria above mentioned, 143 events (arousals and awakenings) from iRBD group and 245 from controls group were included in this analysis. The distribution over the sleep cycles and sleep phases is presented in Appendix 8.3.
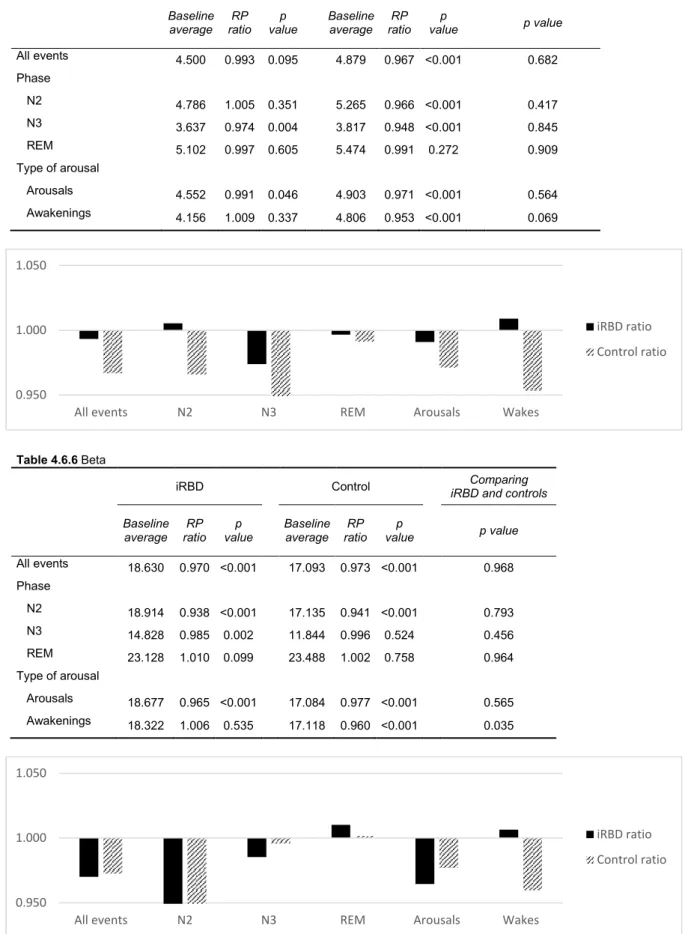
Table 4.6 shows the oscillations of spectral composition of EEG signal occurred in different sleep stages along the 30 seconds before arousal or awakening onset, relative to the baseline period. We analysed the sleep stages (NREM and REM sleep) and the arousal-related events (arousals and awakenings) separately. This analysis was repeated for each frequency band. All these results did not changed when considering only the treatment-naïve iRBD patients.
4.4.1 NREM SLEEP
Considering the patterns occurring during NREM sleep in controls, stages N2 and N3 were characterized by a significant increase of delta activity, accompanied by a decrease of theta, alpha, and sigma frequencies during the pre-arousal/awakening period, relative to the baseline period; beta activity decreased during stage N2 but remained unchanged during the stage N3.
iRBD showed a similar pattern, with delta power increase and alpha and beta power decrease in the pre-arousal/awakening period. However, the other spectral bands showed slightly different results: theta and sigma activity decreases occurred only during stage N3; in stage N2, theta activity registered even an increase and sigma activity remained unchanged.
Comparing the PR oscillations magnitude between controls and iRBD during NREM sleep, the two groups differed in the theta activity during stage N2, which decreased in controls and increased in iRBD patients. The variation magnitude within the other spectral bands was not statistically different between controls and iRBD.
30
4.4.2 REM SLEEP
Considering the patterns occurring during REM sleep, controls showed a similar pattern to NREM sleep with an increase in delta activity and a decrease in theta and sigma low activities. The main differences concerned alpha, sigma high and beta activities, which did not change during the pre-arousal/awakening period in this sleep stage.
iRBD patients showed a similar profile regarding to the delta increase and theta decrease; beta and high sigma activities remained unchanged. Contrary to controls, however, this group showed a decrease in alpha activity and unchanged sigma activity prior to arousal/ awakening.
Despite the different pre-arousal pattern, there were no differences between controls and iRBD patients when comparing the PR oscillations magnitude within each frequency band.
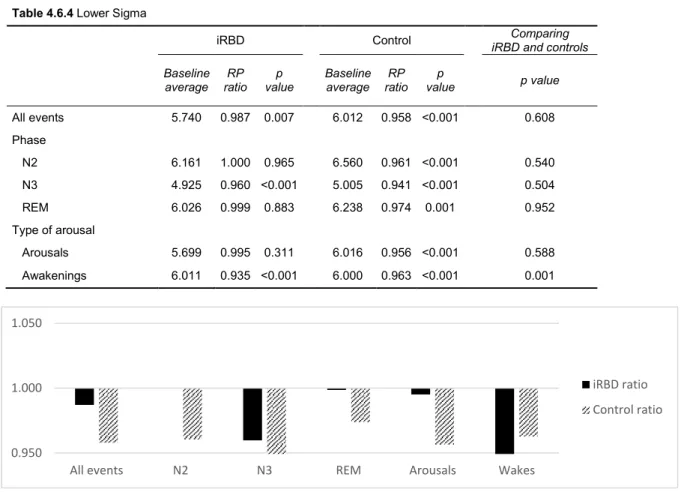
4.4.3 AROUSALS VS. AWAKENINGS
In controls, both arousals and awakenings showed increased delta and decreased alpha, sigma and beta. Theta activity decreased only during pre-arousal and remained unchanged during pre-awakening period.
For iRBD, similar trends were obtained for delta and alpha bands. The other bands had subtle changes, the most significant being that higher frequencies (beta and high sigma) did not decrease and low sigma decreased further than in controls in the pre-awakening period - the magnitude of these changes in relation to controls was significant.