Católica Lisbon – School of Business & Economics
Program “Via Verde do AVC”
Analysis of the Impact on Stroke Mortality
Sara Sofia Silvestre Silva
Student Nr. 152110077
Supervisor: Prof. Miguel Gouveia
Dissertation submitted in partial fulfillment of requirements for
the degree of MSc in Business Administration, at the Universidade
Católica Portuguesa
i | P a g e
A
BSTRACTProgram “Via Verde do AVC”
Analysis of the Impact on Stroke Mortality
Sara Sofia Silvestre Silva
Introduction: Stroke – a cardiovascular disease caused by the interruption of the blood supply to the brain – is the 3rd cause the death in the World, and the 1st in Portugal.
Aware of this burden, the program ‘Via Verde do AVC’ was implemented in Portugal, with the objective of reducing mortality by stroke, specially on ischemic stroke patients aged between 18 and 80 years old.
Objectives: This thesis focus on the performance of ‘Via Verde do AVC’, and aims to assess whether the program has achieved significant health gains, at reasonable costs.
Methodology: Individual level in-hospital data on stroke admissions, and regional level stroke mortality rates are studied, in order to assess the program’s impact on mortality. For in-hospital analysis, the impact is measured as a whole, as well as breakdown by expertise level and/or year. In the regional analysis, simple and weighted regressions are performed.
Results: The regressions performed do not show statistically significant impact of ‘Via Verde do AVC’ on ischemic stroke mortality. The health status of the patient at arrival (measured by the number of diagnosis), as well as the hospital are the most relevant explanatory variables. For regional analysis, there are significant regional asymmetries in stroke mortality, and time has also been a critical factor for mortality reduction.
Conclusions: There is little reason to believe that the program decreases mortality before or during a hospital stroke episode. Moreover, there are some aspects of the program that should be improved, namely Promotion, Training, and Post-hospital Care.
ii | P a g e
W
ORDL
ISTACS Alto Comissariado da Saúde (High Commissariat for Health)
ARS Administração Regional de Saúde (Health Regional Administration) AVC Acidente Vascular Cerebral (Stroke)
CNDCV Coordenação Nacional para as Doenças Cardiovasculares (National Coordination for Cardiovascular Diseases)
CODU Centro de Orientação de Doentes Urgentes (Orientation Center for Emergency Patients)
CVD Cardiovascular Diseases
INE Instituto Nacional de Estatística (National Institute of Statistics)
INEM Instituto Nacional de Emergência Médica (National Institute of Medical Emergency)
IT Information Tecnologies
NIHSS National Institutes of Health Stroke Scale
NINDS National Institute of Neurological Disorders and Stroke QALY Quality-adjusted Life Years
rt-PA Recombinant Tissue Plasminogen Activator WHO World Health Organization
T
ABLE OFC
ONTENTSI. INTRODUCTION
1. Health Economics – A growing field of research 1
2. The Research Topic 2
3. Stroke 3
4. Academic and Managerial Relevance 4
II. DESCRIPTIONOFVIAVERDEAVC 6
III. LITERATURE REVIEW
1. Organizational Changes and Health Outcomes 8
2. Risk Factors and Mortality Rates 9
3. Functional Status and Cost-effectiveness Analysis 10
IV. DATA COLLECTION AND METHODOLOGY
1. In-hospital Mortality
1.1. Data Sources and Criteria 12
1.2. Methodology 13
2. Regional Mortality
2.1. Data Sources and Criteria 15
2.2. Methodology 16
V. RESULTS ANALYSIS
1. Statistics
1.1. Programs’ Coverage Potential 18
1.2. Characteristics of Ischemic Stroke Patients 18 1.3. Mortality Trends of Ischemic Stroke Patients 19 2. Regression Analysis
2.1. In-hospital Mortality 21
2.2. Regional Mortality 25
3. Program’s Limitations that might explain the Results obtained
3.1. Promotion and Reach 26
3.2. Training and Expertise 27
3.3. Post-hospital Care and Rehabilitation 28
VI. CONCLUSIONS 29
APPENDICES 31
1 | P a g e
I.
I
NTRODUCTION1. Health Economics – A growing field of research
The Health Care sector, both for its increasing importance in society and peculiar characteristics, has been subject to a great deal of attention from various fields of research, and Economics is no exception.
Graph 1 – WHO Data Repository
Indeed, in the developed world, this sector is already responsible for approximately 10% of GDP - and the prediction is that this share will continue rising, pressured by technological advances, population aging and rising public expectations (Huber & Orosz, 2003).
Besides its economic importance, there are also a vast number of characteristics in the health care sector that make it different from any other.
Probably the most distinct one is the fact that access to health care services is considered an universal right in many countries which often calls for a strong role of the State in the system (Weaver & al., 2010). In Portugal, in particular, the Government is responsible for health care regulation, financing, ownership, payment and provision.
2 | P a g e In consequence, the Health Care sector is tendentially a non-profit one, and in most cases, patients and health care providers are not the ones paying for the service – and research has shown that, in such context, utilization of resources tend to be excessive and the economic principles of welfare optimization are not achieved.
Overall, this sector presents a complex and unique environment from an economic perspective. In particular, as health care expenses increase - and becausethe Government is the major payer -, tax raises, cost cuts in other areas and out-of-pocket contributions increases will be unavoidable (Watson, 2006). However, as research has shown (Anderson & Frogner, 2008), it is not obvious that higher costs bring additional health benefits. Consequently, the optimization of processes - through better allocation strategies at clinical, organizational and public policy levels - should constitute a major goal in the Health Care sector, as it maximizes the benefits achieved from the use of limited medical resources (Crowe, 2010).
2. The Research Topic
This work delves into the intersection of Health and Economics, assessing whether process optimization can be a complement of technological innovation. More specifically, it focus on the case of ‘Via Verde do AVC’, a program that intends to reduce stroke mortality in Portugal, by introducing significant changes in the process followed by stroke patients – including pre-hospital, in-hospital and post-hospital procedures.
In short, this work aims to assess whether the program ‘Via Verde do AVC’ has achieved significant health gains, at reasonable costs. In order to reach this conclusion, several questions must be answered, namely:
1. Was the program responsible for statistically significant health gains? 2. If health gains are statistically significant, what were the costs involved?
2.1. Were the health gains achieved at reasonable costs?
3. If health gains are not statistically significant, what might be the reasons for such result?
In this thesis, these questions will be answered by studying individual level in-patient hospital data on stroke admissions and by studying regional level stroke mortality rates.
3 | P a g e 3. Stroke
According to World Health Organization, a stroke is a cardiovascular disease (CVD) «caused by the interruption of the blood supply to the brain, usually because a blood vessel bursts [hemorrhagic stroke] or is blocked by a clot [ischemic stroke]. This cuts off the supply of oxygen and nutrients, causing damage to the brain tissue.» The most common symptom is sudden weakness or numbness of the face, arm or leg, but it can also be preceded by confusion, difficulty speaking, severe headache, fainting or unconsciousness. Depending on the degree of severity, it can cause immediate death.
The most relevant risk factors for stroke are tobacco smoking, poor physical activity and unhealthy diet. It is uncommon in people under 40 years, but in those cases it is mainly due to high blood pressure. (WHO, 2011)
There are 15 million people suffering from stroke every year – a trend that is expected to hold in the future. Of those, 5.5 million die and other 5 million are left permanently disable. It is the 3rd cause the death in the World (10%), only exceeded by coronary heart disease (13%) and cancer (12%) (Mackay & Mensah, 2004).
Also in Portugal, Cardiovascular Diseases are the number one cause of death, responsible for almost 40% of mortality (INE, 2010). Of those, approximately 45% are caused by stroke. In 2004, the standardized mortality by stroke was 97,6/100.000 inhabitants, with great regional asymmetries. (ACS; CNDCV, 2007)
Aware of the worldwide pressure towards government investments on stroke prevention and control programs (WHO, 2011), in Portugal, the National Health Plan and the National Program for Prevention and Control of CVD have defined specific strategies and targets to reduce both the standardized mortality rate, in particular for people below 65 years old, and in-hospital mortality by stroke (ACS; CNDCV, 2007). In order to achieve these targets, the program ‘Via Verde do AVC’ was developed and it has been implemented across the country since 2005.
4 | P a g e 4. Academic and Managerial Relevance
Given the high mortality rate associated with stroke in Portugal, the national coverage of the program and the significant level of resources devoted to it, it is academic and politically interesting to assess the real impact of such measures. Indeed, mortality rates from stroke have been decreasing in the last years, and some claim that ‘Via Verde do AVC’ played an important role of achieving those results. Nevertheless, no rigorous studies have been done so far in order to prove this link.
Target vs. Actual Mortality: 2003-2009
Graph 3 – (ACS, 2010)
Additionally, on an economic and managerial perspective, more than simply assessing the gains, it is of extreme importance to include the ‘cost-side’ of the project, in order to measure the trade-off between resources allocated and gains achieved – showing a more complete, informative, and comparable perspective, one that better supports the decision-making process.
Finally, the research also intends to present a critical analysis of the program design and implementation. The identification of its strengths - as well as its shortfalls - can be of
«Stroke mortality has decreased 33,8% [between 2000-2008]. Maria do Céu Machado [ex-High-Commissioner+ says this is the proof that “a regionally well planed and implemented intervention delivers significant gains. There was strategic, multidisciplinary planning, bringing together INEM, hospitals, and campaigns to increase populations' literacy”»
5 | P a g e great relevant in practical terms, as it will allow the replication of best practices and the correction of problems.
In the next chapter, the details of the design and implementation of the Program “Via Verde do AVC” are briefly described, followed by a chapter that gives important background information concerning stroke programs that have been implemented worldwide, and which have goals similar to those established in Portugal; the chapter also presents some relevant results of research about the impact of such programs.
The forth chapter delves into the description of the Methods and Data used in order to perform the analysis of in-hospital mortality, as well as regional mortality. In the fifth chapter, the results obtained in the statistical analysis are presented; moreover, a critical analysis of the program’s design and implementation is included, in an attempt to better understand the results obtained.
Conclusions are drawn in the last chapter, summarizing the problem analyzed and the results of the analysis carried out, and highlighting some limitations of this work and suggestions for further research.
6 | P a g e
II.
D
ESCRIPTION OF‘V
IAV
ERDE DOAVC’
Despite the efforts devoted to the development of more effective medicines (Grotta & al., 2008), intravenous rt-PA (recombinant tissue plasminogen activator) is the only approved treatment for stroke; it is only effective for acute ischemia – responsible for 80% of the total stroke episodes -, and cannot be administered in case of hemorrhagic stroke. rt-PA is used for arterial recanalization (destroying the clot that blocks the brain’s blood supply, inhibiting the evolution of the brain lesions, thus reducing the severity of the consequences), but can only be used within 3 hours after the beginning of the symptoms.
For this reason – and given the fact that up to 70% of mortality by stroke occurs before arrival to the hospital (Gomes, 2007) –, it is critical to invest not only in scientific and technical progress, but also in improved organizational systems, in which healthcare resources are organized efficiently, and treatments are applied correctly (Leciñana-Cases & al., 2009). In line with that, ‘Via Verde do AVC’ is aimed to improve the patients’ accessibility to medical care, allowing a faster and more adequate treatment, and a consequent reduction of mortality. In order to do it, the entire process followed by patients - from the beginning of the symptoms until the rehabilitation stage - was redesigned, leading to significant changes in the organization, coordination and interaction of the various services and human resources involved. Via Verde applied only to patients 18 or older and up to 80 years old.
Pre-hospital Stage – The process is initiated by a phone call to the emergency number (112) – so, the population cooperation and awareness are essential. In case of symptoms of stroke, the call is redirected to a local and specialized call center (CODU), that coordinates the operations until the arrival of the patient to the hospital: it allocates INEM resources for that emergency, determines the most suitable hospital of destination, and informs the medical team of that hospital of the eminent arrival of a stroke patient.
In-hospital Stage – When arrived at the hospital, there is a team already in place waiting for the patient. A battery of exams is done, in order to confirm the diagnosis of acute ischemic stroke (rather than hemorrhagic stroke), and certify that the patient fulfills all the medical requirements for rt-PA administration. Once these procedures are completed, and
7 | P a g e in case the requirements are met, the treatment starts – but only if less than 3 hours have passed since the beginning of the symptoms.
Post-hospital Stage / Rehabilitation – For those who survive but are not fully recovered from the stroke episode, there is a net of rehabilitation services, intended to provide assistance to the patients after the in-hospital period. It includes four services: outpatient visits, physical therapy, social assistance, and home assistance. Although this stage is included in the Program’s guidelines, its implementation is not yet fully accomplished.
8 | P a g e
III. L
ITERATURER
EVIEW1. Organizational Changes and Health Outcomes
In response to an upward trend of stroke incidence worldwide, many countries (such as USA, Denmark, Spain and Netherlands) have already introduced stroke programs. Although adjusted to local needs, all of them have required organizational changes and improvements in the healthcare network involved in the process.
First of all, it is critical to have emergency medical services capable of providing a quick identification of the acute health problems, pre-hospital notification and timely transport of patients to the hospital. In Montana - USA, for instance, investments have been made in educational programs to increase awareness of procedures for initial assessment (warning signs, recognition and triage of stroke patients), acute treatment, and transport of potential stroke patients - and positive results have been achieved (Oser, 2010).
Intra-hospital changes have also been introduced during the last decade, and American studies present some interesting conclusions. Aimed to reduce delays in medical response, IT solutions enhancing communication, immediate access to information and decision support have been implemented. Time intervals from patients' arrival to intravenous thrombolysis were significantly reduced, while the number of patients who were treated with rt-PA increased. It also eliminated the previously detected negative relationship between onset-to-door time and door-to-needle time (on average, every 25-min earlier arrival was associated with a 15-min increase in time to initiation of rt-PA therapy). Nevertheless, these changes, alone, have not attained significant health gains ((Heo & al., 2010), (Nam & al., 2007)). Similar programs have also been adopted to improve response time of in-hospital strokes, since they require, in general, greater time to be recognized than those from emergency (Cumbler & al., 2010). Moreover, patient risk stratification and implementation of best practice guidelines has led to a decreasing variation in stroke care delivery (Kavanagh & al., 2006).
More significant change in health outcomes has been achieved by programs with broader scope, which is the case of Spain. Organizational changes in both pre and intra-hospital stages, analyzed through time, have translated not only in more patients treated
9 | P a g e with rt-PA, but also in a significantly larger percentage of patients who achieve functional independence after 3 months (Simal & al., 2009).
Another important aspect is the post-hospital stage of stroke, as rehabilitation can also delivers significant health gains for stroke patients. The most relevant advantages of a treatment in dedicated rehabilitation units are shorter admission times, greater gain of independence, improvement in quality of life and greater probability of home discharge (Carod-Artal & al., 2005). However, there is less consensus about the ideal timing of the transfer. Most skeptics point out that early admission (and so early discharge from hospital) is an indicator (and not a cause) of the patient’s better condition. Indeed, there is evidence that moderately affected patients at admission will show significantly higher functional gains than severely affected patients at admission (Inouye & al., 2001), and that a few weeks difference in the admission time, once initial condition is controlled for, translate into non-significant difference in health status (Gagnon & al., 2006). Nevertheless, when considering large differences in the admission time, the functional improvements are significantly better for patients with earlier treatment (Carod-Artal & al., 2005).
A final consideration should be made concerning prevention. Since stroke presents a high recurrence rate among survivors, and most of its risk factors can be modified, attention has been given to recurrence prevention programs that facilitate the initiation and maintenance of prevention measures, in the pursue of improved long-term treatment rates and quality of life. Research shows significant improvement in treatment utilization rates at discharge, as well as after 3 months and 1 year. Moreover, there is also evidence of a decrease in the occurrence of unfavorable clinical outcomes (Ovbiagele B. , 2008).
2. Risk Factors and Mortality Rates
Several factors are known to be related to stroke, so, in order to better understand the relevance of each of them in terms of health outcomes, prediction models have been developed. Such predictions are particularly useful for patient management and resource allocation (Counsell & al., 2002), for prognostic information for family members, as well as for health policy design and monitoring (Smith & al., 2010).
For these prediction models to be useful and widely applicable in actual practice, they need to be as simple as possible, address questions of practical importance, and to be based
10 | P a g e on readily available information – nevertheless, current models are still too complex (Wang & al., 2000).
The most commonly mentioned risk factors are age, gender, and previous history of atrial fibrillation and stroke; Smith & al. also mentions mode and hour of arrival, coronary artery disease, diabetes mellitus, hypertension, and functional status expressed by National Institutes of Health Stroke Scale (NIHSS); Wang & al. includes consciousness, incontinence, admission body temperature, and hyperglycemia without a clinical history of diabetes; Counsell & al. considers that living alone, independence before stroke, arm power and ability to walk and talk are the most relevant aspects.
3. Functional Status and Cost-effectiveness Analysis
Along with mortality, the degree of disability is also very relevant in stroke episodes. In order to track changes in the functional status of patients from the onset through discharge and follow-up, both in hospital and in rehabilitation, there was the need to develop a comprehensive, reliable and standardized tool that provided medical services with information on each specific case (Chumney & al., 2010). In response to this need, neurological examination guidelines, along with functional scales summarizing the examination, have been developed worldwide. However, great variety of evaluation methods and scales, low levels of inter-rater agreement due to subjective interpretation (Wilson & al., 2002), and poor or inexistent validity and reliability of such methods (Lyden & Lau, 1991) have hindered the acceptance of an ideal measure, so that there is, until nowadays, little consensus among experts on this topic (Gocan & Fisher, 2008).
Despite their drawbacks, functional scales are still the most accurate measure of changes in stroke health status. Consequently, their uses have enlarged through time, and they have become particularly relevant in economic analysis. The most common use has been for health outcome prediction – and although they should not be seen as a sole explanatory variable (Muir & al., 1996), research shows that they can accurately predict mortality and recovery (Weimar & al., 2004).
Moreover, they are also used in cost-effectiveness analysis. Given the fact that, in general, Quality-Adjusted Life-Years (QALYs) are the economic measure used to express the health gains in these analysis, researchers have tried to establish a link between stroke scales and economic utilities. The findings indicate that different study populations (stroke
11 | P a g e survivors, at risk, healthy) and elicitation methods (Standard Gamble, Time Trade-Off, etc.) lead to different perceptions of utility. Also here, diversity in the definition of each functional status is the main cause of such variation (Post & al., 2001).
Some cost-effectiveness studies have been carried out worldwide. In the USA, research shows incremental cost savings per QALY gained with rt-PA treatment; compliance with NINDS (National Institute of Neurological Disorders and Stroke) recommendations for care of stroke patients translated into greater QALY value for rt-PA treatment, with cost savings from reduced hospital, rehabilitation and nursing home costs. Moreover, implementation of a specialized stroke program was associated with declining average cost of treating stroke patients and with lower average length-of-stay (Demaerschalk & al., 2010).
Similar outcomes have been achieved in Europe. It was estimated that the implementation of a system similar to ‘Via Verde do AVC’ in Spain would result in cost-savings, while avoiding deaths and dependencies (Leciñana-Cases & al., 2009). In Netherlands, the life-time effectiveness of a stroke service (an integration of a hospital stroke unit with nursing homes, rehabilitation centers, and home care providers) translated into cost savings (from shorter mean length of stay in hospital, and lower proportion of patients institutionalized after stroke), while generating more QALYs (Baeten & al., 2010). Similar long-term results were achieved in Denmark with the introduction of rt-PA, due to savings in rehabilitation, nurse homes and re-hospitalization, despite the short-run increase of economic costs (Ehlers & al., 2007).
In short, it can be said that, when properly planned and implemented, organizational change can, indeed, facilitate and support scientific advances, achieving both health gains and cost savings. It is then relevant to understand whether this is also the case in Portugal.
12 | P a g e
IV.
D
ATAC
OLLECTION ANDM
ETHODOLOGY1. In-hospital Mortality
1.1. Data Sources and Criteria
For this analysis, the clinical information regarding stroke patients from ARS Norte and ARS Algarve is considered, since these were the only two regions (among the existent 5) where there was complete data concerning the date of the beginning of Via Verde do AVC in all the regions’ hospitals.
The clinical information of stroke episodes was collected from the GDH (Grupos de Diagnóstico Homogéneos – Diagnosis Related Groups (DRG)) databases. The time frame considered goes from 2004 to 2009, since Via Verde do AVC was implemented for the first time in 2005. The GDH databases include almost all in-patient episodes in NHS hospitals, and the data on each episode include age, sex, date of admission, date of discharge and discharge status, the DRG and up to 20 diagnoses codes from the International Classification of Diseases, version 9 Clinically Modified (ICD 9 CM).
Data on the starting date of the program in each of the relevant hospitals was collected on official reports and press releases published by ARS Norte and ARS Algarve (as presented on Appendix 1).
Before starting the analysis itself, it was necessary to filter and organize the data. Based on the opinion of medical experts, the relevant episodes were selected based on the 1st diagnosis (ICD 9 CM), rather than on the GDH reported. Both ischemic stroke (code 433 and 434) and hemorrhagic stroke (code 430, 431 and 432) were kept on the sample - despite the fact that only the first was targeted on the program -, so that a more complete analysis can be performed, on whether the program has also had an impact on hemorrhagic stroke patients.
Episodes from ARS’s other than Norte (code 1) and Algarve (code 5) were removed from the sample. Observations in which it was not possible to determine whether the patient survived or not, due to transfers (code dsp=2) or lack of information (code dsp=99) were also eliminated.
Variables’ names were standardized throughout the various databases, so that they were comparable once merged.
13 | P a g e Moreover, as the hospital identification in 2009 had a different coding from the
previous years, it was necessary to carefully analyze and compare the data in order to match the observations. This match was performed according to: 1. volume of episodes; 2. covered regions by hospital; 3. hospital of destination by region. The matched ID codes are presented on Appendix 1.
1.2. Methodology
Some Statistics based on GDH’s data were computed before performing the actual analysis of effectiveness, in order to have some insights on the sample’s trends across time, regions and demographics, as well as mortality patterns.
Regression analysis was performed with Stata 10, using a logistic function.
Besides the variables presented in the GDH databases, some others needed to be generated.
1. DMort: dummy variable, referring the final outcome of the patient. Value ‘1’ represents ‘Dead’ (code dsp=20), and value ‘0’ represents ‘Alive’ (remaining cases).
2. Nddx: numerical variable, counting the number of diagnosis. It ranges from 1 (only stroke diagnosis) to 20 (stroke and 19 other diagnosis).
3. age2: numerical variable, it is the age squared. It attempts to capture non-linear effects of age on mortality
5. age3: numerical variable, it is the age cubic. It attempts to capture non-linear effects of age on mortality.
6. isch: dummy variable, referring the type of stroke the patient had. Value ‘1’ represents ‘Ischemic stroke’ (code 433 and 434), and value ‘0’ represents ‘Hemorrhagic stroke’ (remaining cases).
4. VV: dummy variable, referring the existence of Via Verde do AVC. It captures the overall effect of the program on mortality. Value ‘1’ represents ‘Existence of VV-AVC’ (ent1>= date of beginning of the program in a specified hospital), and value ‘0’ represents ‘Non Existence of VV-AVC’ (remaining cases)
5. VV1 – VV5: dummy variables (5), referring the longevity of the program in each hospital. VVk equals “1” for the observations that occurred within the kth *k Є {1;5}] year of the program in the specific hospital, and 0 otherwise. These variables capture the effect of
14 | P a g e expertise (through the practice acquired with Via Verde do AVC) on mortality. In line with findings from studies already mentioned, it is expectable that, the longer the existence of the program, the better the system performs, which ultimately translates into a greater impact on clinical outcomes.
1. VV05 – VV09: dummy variables (5), referring the existence of Via Verde do AVC in a given year. VVk equals “1” for the observations that occurred in the year 20k *k Є (05;09)], in an hospital with VV AVC. They capture the effect of Via Verde do AVC in a specific year – the more people are aware, prone and able to use the program, the greater the impact it can attain in the overall. However, since this process of change is generally slow, it is predictable that, as time passes, the program enlarges its coverage and, consequently, the average impact on the target population increases. 2. VV05_1 – VV09_5: dummy variables (15), referring the longevity of the program for each hospital, in a given year. VVk_j equals “1” for the observations that occurred in the year 20k [k Є (05;09)], in a hospital in which the program is in its jth *j Є (1;5)+ year of implementation. These variables combine the effects captured by the previous two: the impact that different stages of longevity/ expertise, as well as the passage of time have on the effectiveness of Via Verde do AVC.
The variables considered are:
Table 1 – Variables included on In-hospital regression analysis
Variables Range Source Comments Info Category
Mortality {0;1} GDH Dependent Variable Clinical
Outcome
Age ]18;80[ GDH Linear? Include Age2 and Age3
Demographics
Gender {0;1} GDH -
N. of
Diagnosis {1;20} GDH - Clinical History
Hospital {0;1} GDH - Expertise Year {0;1} GDH - Via Verde AVC {0;1} ARS1; ARS5; Health Portal
Date of implementation by Hospital. Overall effect; breakdown by year or/ and
time since implementation
15 | P a g e The regression analysis performed included age, gender, number of diagnoses, hospital and year dummy variables, and limited the sample to the ischemic stroke patients with age higher than 18 and lower than 80 years old.
However, some variations were tried in order to better predict the program’s impact: - The overall impact of Via Verde do AVC: measured by a single VV variable
o The base case: ischemic stroke patients
o Restricting the geographic area of the sample (ARS Norte) o Restricting the number of diagnosis of the sample (Nddx=1)
o Restricting to non-target patients (hemorrhagic stroke patients, aged ]18;80[)
- The breakdown impact of Via Verde do AVC
o By Expertise: measured by VV1 – VV5 variables o By Year: measured by VV05 – VV09 variables
o By Expertise and Year: measured by VV06_1 – VV09_5 variables
2. Regional Mortality
2.1. Data Sources and Criteria
While in the analysis of in-hospital mortality each observation corresponds to a single stroke episode, and only the episodes treated in an hospital are considered, the regional analysis is based on regionally aggregated data, taking into account all the cases in which stroke was stated as being the cause of death. Moreover, while in the previous approach, the clinical outcome was survival or death (of stroke patients), in this case the outcome is a mortality rate (by stroke, per 100.000 inhabitants).
This analysis is limited to ARS Norte’ region, since this was the only ARS for which it was possible to find detailed information concerning stroke mortality through time and by region. The data concerning stroke mortality (standardized mortality rate – SMR – and gross mortality rate – GMR) by region, year, gender and age group was made available by ARS Norte. The primary source of data is INE, and Public Health Department of ARS Norte performs the treatment of this data. Given the fact that SMR already controls for the demographics in each region, this was the chosen variable to measure mortality, and data on age groups and gender were not used as covariates in the analysis. It was not possible to
16 | P a g e limit the analysis to the program’s target population that is to ischemic strokes in the 18 to 80 population, so all deaths by cerebrovascular diseases, for all ages, were included. The time frame considered was from 2001 to 2009.
Data on population by region through time was collected from INE databases. The information previously collected concerning the starting date of Via Verde do AVC in each hospital was also used for this analysis.
Since ARS Norte data was organized by pre-defined regions, INE data on population was organized by “concelhos”, and data on starting date of the program referred to hospitals, it was necessary to standardize all the information into a unique criteria – ARS Norte regions were chosen as the standard.
Information on “concelhos” that compose each of the 24 ARS Norte regions was collected in ARS Norte Portal. Based on this match (region/”concelhos”), INE data on population by “concelhos” was grouped into population by ARS Norte regions.
Moreover, data on covered “concelhos” by hospital was found in the Health Portal. Since each hospital’s covered areas perfectly (or almost perfectly) fit to ARS Norte regions, it was possible to match hospitals tp regions and thus determine the starting date of "Via Verde do AVC" in each region. It is also relevant to mention that the information on “concelhos” covered by each hospital (based on Health Portal’s data) was compared to the actual origin of patients in each hospital (based on GDH data) and, indeed, they match the large majority of the observations (the majority of patients from a given “concelho” are actually treated in the hospital that covers that area), so that it is reasonable to assume the link between region/hospital used in thie analysis.
A table resuming the match hospital /”concelhos”/ region is presented on Appendix 2.
2.2. Methodology
Regression analysis was performed with Stata 10, using multiple linear regression. Besides the collected variables, a dummy variable VV was created. It refers to the existence of "Via Verde do AVC". VV is equal to “1” for observations that occurred in a year and region in which there is Via Verde do AVC. For the year of implementation of the program in a given hospital/ region, VV equals “1” only if such implementation occurred before June 30th (more than half a year with Via Verde do AVC). Value ‘0’ represents ‘Non Existence of VV-AVC’ (remaining cases).
17 | P a g e Moreover, and in line with what was done with in-hospital data, the impact of the program was broken down by expertise level (VV1 – VV5), year of the observation (VV05 – VV09) and both (VV05_1 – VV09_5). However, since the results of this analysis did not differ considerably from the simplest approach, they are not presented in this work.
So, the variables considered were:
Table 2 – Variables included on Regional regression analysis
The analysis was then performed using two different approaches: - Simple linear regression
- Linear regression weighted by regional population
Variables Range Source Comments Info Category
SMR rate ARS Norte Dependent Variable Clinical Outcome
Region {0;1} ARS Norte 24 regions
Expertise
Year {0;1} - 2001-2009
Population - INE - Weight
Via Verde
AVC {0;1} ARS Norte
Date of implementation by Hospital/
18 | P a g e
V.
R
ESULTSA
NALYSIS1. Statistics
1.1. Programs’ Coverage Potential
After the information has been filtered and properly organized, the database was composed by 51.603 observations. Excluding hemorrhagic stroke episodes (ICD9 CM codes 430, 431 and 432) , the number of observations reduces to 43.807, a 15% reduction.
Among episodes of ischemic stroke, data was excluded even further, in order to contain only those cases which met the age criteria of the program: more than 18 years and less than 80. At this point, only 28.842 episodes were eligible to the activation of "Via Verde do AVC" – which represents approximately 56% of the total number of stroke episodes during the period of 2004-2009.
Graph 4 – Program’s Coverage Potential
1.2. Characteristics of Ischemic Stroke Patients
93% of the observations used in the sample are from ARS Norte. Among these, the distribution in terms of hospital of destination is fairly uneven, with Hospital de S. João receiving 14% of the patients, while some others have almost 0% (Espinho, IPO Porto). On the contrary, in Algarve, each one of the two hospitals are responsible for approximately 50% of the stroke episodes in the region.
In terms of age distribution, there is a clear dominance of episodes in patients with ages between 60 and 90 years old. Give the eligibility criteria of the program, approximately 65% of all the ischemic stroke patients are potential beneficiaries of Via Verde.
19 | P a g e
Graph 5 – Sample distribution by Hospital and ARS (%) Graph 6 – Sample distribution by Age (cum %)
When gender is considered, the incidence of stroke is similarly distributed among men and women, and this trend has been maintained through time. In what concerns the overall health state of stroke patients, the large majority presents 3 diagnosis other than stroke, and almost 80% have 5 or less secondary diagnosis.
Graph 7 - Distribution by Gender/ Year (%) Graph 8 - Distribution by Number of Diagnosis (%)
1.3. Mortality Trends of Ischemic Stroke Patients
Although there is no clear trend on mortality for ischemic stroke patients with less than 40 years (mainly explained by the small number of observations), there is an observable positive relation between average mortality and age, as patients get older.
Moreover, the total mortality by stroke has decreased since 2004 from 16% to 13% of stroke episodes; however, this trend is not so clear for ischemic stroke patients, nor for the program’s target patients, for whom mortality has remained around 11%-13%, and 8%, respectively. So, the decrease in the total mortality can only be explained by a sharp decrease in mortality of hemorrhagic stroke patients to percentages similar to those observed in ischemic stroke patients.
20 | P a g e
Graph 9 - Average mortality rate (%) by age Graph 10 - Average mortality (%) by year
When comparing mortality by gender for all ages, data shows a higher fraction of women dying from stroke; moreover, when age is controlled, this difference remains, although the mortality rates are lower, at around 7,5% and 9% for men and women, respectively.
Additionally, there is an upward relationship between the stroke patients’ health status (measured by the number of diagnosis) and mortality by stroke, especially in the case that only the target patients are considered.
Graph 11 - Average mortality rate (%) by gender Graph 12 - Average Mortality by Health Status (%)
21 | P a g e 2. Regression Analysis
2.1. In-hospital Mortality
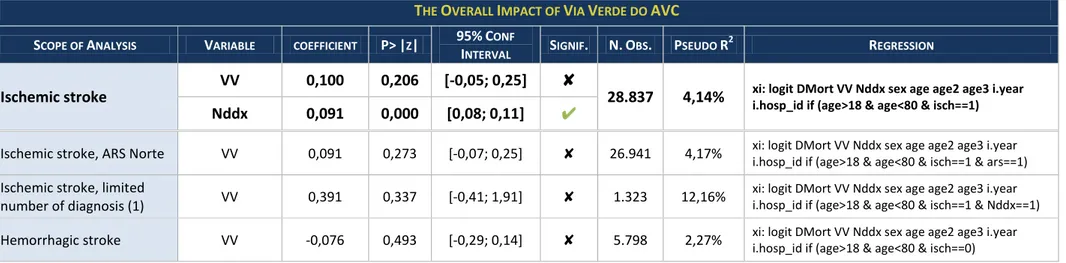
Table 3 – The Overall Impact of Via Verde do AVC: results of In-hospital analysis
THE OVERALL IMPACT OF VIA VERDE DO AVC
SCOPE OF ANALYSIS VARIABLE COEFFICIENT P>|Z| 95%CONF
INTERVAL SIGNIF. N.OBS. PSEUDO R 2
REGRESSION
Ischemic stroke VV 0,100 0,206 [-0,05; 0,25] ✘ 28.837 4,14% xi: logit DMort VV Nddx sex age age2 age3 i.year i.hosp_id if (age>18 & age<80 & isch==1) Nddx 0,091 0,000 [0,08; 0,11] ✔
Ischemic stroke, ARS Norte VV 0,091 0,273 [-0,07; 0,25] ✘ 26.941 4,17% xi: logit DMort VV Nddx sex age age2 age3 i.year
i.hosp_id if (age>18 & age<80 & isch==1 & ars==1)
Ischemic stroke, limited
number of diagnosis (1) VV 0,391 0,337 [-0,41; 1,91] ✘ 1.323 12,16%
xi: logit DMort VV Nddx sex age age2 age3 i.year i.hosp_id if (age>18 & age<80 & isch==1 & Nddx==1)
Hemorrhagic stroke VV -0,076 0,493 [-0,29; 0,14] ✘ 5.798 2,27% xi: logit DMort VV Nddx sex age age2 age3 i.year
22 | P a g e
Table 4 – The Breakdown Impact of Via Verde do AVC: results of In-hospital analysis
THE BREAKDOWN IMPACT OF VIA VERDE DO AVC SCOPE OF
ANALYSIS
VV
VARIABLE COEFFICIENT P>|Z|
95%CONF
INTERVAL SIGNIF. N.OBS. PSEUDO R
2 R
EGRESSION
Breakdown by Expertise
VV1 0,109 0,204 [-0,06; 0,28] ✘
28.837 4,14% xi: logit DMort VV1 VV2 VV3 VV4 VV5 Nddx sex age age2
i.year i.hosp_id if (age>18 & age<80 & isch==1)
VV2 0,097 0,346 [-0,11; 0,30] ✘ VV3 -0,002 0,985 [-0,26; 0,25] ✘ VV4 -0,017 0,922 [-0,36; 0,33] ✘ VV5 0,176 0,624 [-0,53; 0,88] ✘ Breakdown by Year VV05 O,575 0,097 [-0,10; 1,25] ✘
28.837 4,16% xi: logit DMort VV05 VV06 VV07 VV08 VV09 Nddx sex age
age2 i.year i.hosp_id if (age>18 & age<80 & isch==1)
VV06 0,014 0,928 [-0,28; 0,31] ✘ VV07 0,202 0,101 [-0,04; 0,44] ✘ VV08 0,128 0,306 [-0,12; 0,37] ✘ VV09 -0,025 0,842 [-0,28; 0,23] ✘ Breakdown by Expertise and Year VV05_1 0,559 0,112 [-0,13; 1,25] ✘ 28.837 4,19%
xi: logit DMort VV05_1 VV06_1 VV06_2 VV07_1 VV07_2 VV07_3 VV08_1 VV08_2 VV08_3 VV08_4 VV09_1 VV09_2 VV09_3 VV09_4 VV09_5 Nddx sex age age2 i.year i.hosp_id if (age>18 & age<80 & isch==1)
VV06_1 -0,018 0,920 [-0,36; 0,33] ✘ VV06_2 0,075 0,824 [-0,59; 0,74] ✘ VV07_1 0,184 0,271 [-0,14; 0,51] ✘ VV07_2 0,184 0,284 [-0,15; 0,52] ✘ VV07_3 0,119 0,762 [-0,65; 0,88] ✘ VV08_1 0,018 0,920 [-0,33; 0,36] ✘ VV08_2 0,137 0,440 [-0,21; 0,48] ✘ VV08_3 0,076 0,688 [-0,29; 0,45] ✘ VV08_4 0,498 0,138 [-0,16; 1,16] ✘ VV09_1 0,128 0,427 [-0,19; 0,44] ✘ VV09_2 -0,072 0,686 [-0,42; 0,28] ✘ VV09_3 -0,134 0,454 [-0,49; 0,22] ✘ VV09_4 -0,145 0,466 [-0,54; 0,25] ✘ VV09_5 0,123 0,736 [-0,59; 0,84] ✘
23 | P a g e The tables above summarize the results of in-hospital analysis.
When considering the impact of the program on the target group (ischemic stroke patients with age above 18 and below 80 years old), measured by a single VV variable, there is no statistical evidence of impact of Via Verde do AVC on mortality (p-value=21%>5%). Moreover, sex, age, age2 and age3 are not significant; however, once age3 is excluded from the regression, age2 become a positively significant variable. In what concerns time-effects, 2008 is the only year that shows significant improvements when compared to 2004, but if the variables are jointly tested, they are not statistically different from zero (P> χ2 = 30,4%).
On the other hand, the differences among the various hospitals are captured in the regression, and their coefficients show jointly statistical difference from zero (P> χ2 = 0,00%). Moreover, the impact of the number of diagnosis on mortality is also highly significant. The explanatory power of this analysis (R2) is around 4%.
Furthermore, in none of the cases analyzed with a single VV variable, has the outcomes shown statistical significance: not for other stroke types (Hemorrhagic stroke episodes), not for a specific region (ARS Norte episodes), nor for episodes with restricted health status (limited number of diagnosis).
So, based on this analysis, it is not possible to conclude that the program was able to improve the health status of stroke patients, through the decrease of in-hospital mortality.
Based on the second approach, using the breakdown effect of the program, the results obtained show similar conclusions. When only the degree of expertise is controlled (VV1-VV5), there is no evidence of statistically significant impact on ischemic stroke mortality, and so it is not clear whether the program can actually improve health status of these patients as a result of the increased experience of the team involved. Furthermore, when the impact of ‘Via Verde do AVC’ is only controlled by the year in which the observation occurred, the results achieved are not better, as shown in the table above. Also, in the case that the effect of the program is broken-down according to both year of the episode, and the degree of expertise of the hospital, there is no statistically significant decrease in mortality of ischemic stroke patients captured in any the VV variables. In all of these analyses, the number of diagnosis is highly significant, as well as age2 (once age3 is removed), or age (once age2 is removed). In all of these approaches, differences among hospitals are jointly significantly
24 | P a g e different from zero (P > χ2 = 0,00%), while there is no jointly statistical evidence that time has contributed for a shift on stroke mortality (P > χ2 = 44%, 40% and 46%, respectively).
So, there is no evidence that the program can reduce ischemic stroke mortality in-hospital, even if the impact is broken down by degree of expertise and/or year of observation. Details on the in-hospital regression are presented on Appendix 4.
Nevertheless, it is interesting to notice that, in cases that Via Verde exists, a greater proportion of patients with worse health status (measured by number of diagnoses) arrives at the hospital, than in the cases without the program.
N. of Diagnosis Distribution (%), by existence of VV
Graph 13 – Health Status distribution (%): all observations Graph 14 – Health Status distribution (%): S. João Hospital
This fact could be a result of the type of hospitals that have the program, rather than the program itself - since it is generally implemented in central hospitals that, a priori, receive more complex cases than those without it. However, this pattern holds even if we consider Hospital S. João – the largest in the region: although, without Via Verde, it receives a higher percentage of complex cases than the average hospitals, this percentage is even higher since Via Verde was implemented.
Based on this finding, it is possible to speculate on the impact of the program not in terms of decreased in-hospital mortality, but instead on change in the overall probability of mortality – so that the greatest value-added of the program would be in the ability of the patients to arrive to the hospital before they are dead. In this sense, once the patient arrives to the hospital alive, there is no great impact on having the program. Nevertheless, having the program allows that a greater percentage of patients arrive to the hospital alive, where their probability of survival is higher than if they were somewhere else. These effects should then be tested based on regional/population level (rather than in-hospital) data.
25 | P a g e 2.2. Regional Mortality
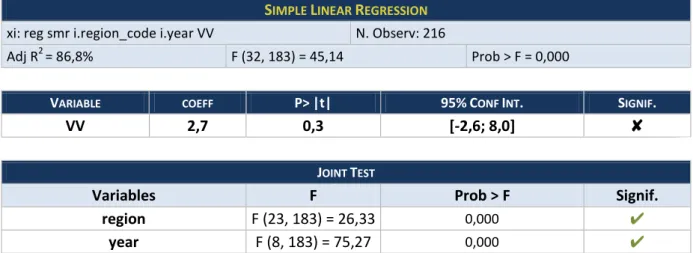
Table 5 – Simple Linear Regression: results of Regional analysis
Table 6 - Population-Weighted Linear Regression: results of Regional analysis
According to the results obtained in both approaches (simple, and population-weighted) of the regional analysis, there is, once again, no statistical evidence that the existence of ‘Via Verde do AVC’ in the regions translate into better health results for stroke patients (p-value=30% and 10%, respectively).
On the other hand, there are large differences among regions and throughout the years, since the joint tests show that the respective coeficients are stastically different from zero (P > F =0,00%). It is also relevant to notice that mortality by stroke has been decreasing sharply since 2002: taking 2001 as reference, the coefficients of the years’ variables present negative values, ranging from -14,0/100.000 in 2002, to -60,7/100.000 in 2009), which mean
SIMPLE LINEAR REGRESSION xi: reg smr i.region_code i.year VV N. Observ: 216
Adj R2 = 86,8% F (32, 183) = 45,14 Prob > F = 0,000
VARIABLE COEFF P>|t| 95%CONF INT. SIGNIF.
VV 2,7 0,3 [-2,6; 8,0] ✘
JOINT TEST
Variables F Prob > F Signif.
region F (23, 183) = 26,33 0,000 ✔
year F (8, 183) = 75,27 0,000 ✔
POPULATION-WEIGHTED LINEAR REGRESSION xi: reg smr i.region_code i.year VV [w=pop] N. Observ: 216
Adj R2 = 87,7% F (32, 183) = 48,96 Prob > F = 0,000
VARIABLE COEFF P>|t| 95%CONF INT. SIGNIF.
VV 4,1 0,1 [-1,1; 9,2] ✘
JOINT TEST
Variables F Prob > F Signif.
region F (23, 183) = 29,14 0,000 ✔
26 | P a g e that mortality has been decreasing over time, far before the beginning of ‘Via Verde do AVC’. Moreover, the explanatory power of both regression are very high (R2 of around 87%).
Detailed information on the results of regional analysis are presented on Appendix 5. In what concerns the program’s impact on mortality, and answering the hypothesis raised in the previous section, these results do not confirm it. There is no evidence that overal stroke mortality decreased due to ‘Via Verde do AVC’. Since the previous results had shown that in-hospital mortality did no change, any changes in global mortality would have to come from periods not "in hospital". One possibility was that thanks to ‘Via Verde do AVC’, pre-hospital survival would have improved. However,these last results show that such explanation is not valid. There is little reason to believe that the program decreases mortality before or during a hospital stroke episode.
3. Program’s Limitations that might explain the Results obtained
Given the fact that none of the analysis performed showed significant effectiveness of the program ‘Via Verde do AVC’, it is not relevant to further analyse the costs involved in the program, and the consequent cost-effectiveness relationship.
Nevertheless, it would be interestig to focus on the program’s design and implementation strategy, in order to better understand the possible causes that are limiting its success.
3.1. Promotion and Reach
The trigger of the whole process is the people’s intervention, by calling the emergency services and being able to identify the ocurrence of a stroke episode. In this sense, promotion and informative campaigns to increase the population’s awareness is critical for the success of the program. However, in Portugal, the program has not been heavily promoted and many people are still not aware of its existence.
Indeed, when considering the North region (the one with the largest adherence rates), and through time, as more hospitals implement the program, the population covered in regional terms, as well as the percentage of patients that arrive at hospitals with Via Verde increases dramatically (from around 20% to 70%). However, the percentage of patients that are actually using it – although increasing at a similar rate –, is only about half of the potential number of episodes that could have used the program.
27 | P a g e Program’s Potential vs. Actual Reach
Graph 15 – (INE; ARSN, 2011), (GDH, 2004-2009), (ACS; CNDCV, 2010)
Based on this figures, it is possible to argue that it is not enough to create more infrastructures to tackle the problem: it is also critical to involve the population on this program, to make them aware of its existence and thus, to translate potential impact on actual impact. Indeed, the current potential capacity of the program is twice as much as the number of patients currently served by it.
3.2. Training and Expertise
In order to achieve the best outcomes possible, it is important that everybody involved in the process is fully capable and knowlegeable about it. In this sense, training should be continuously implemented – and, indeed, this issue is constantly mentioned in the document that stablishes the guidelines of the program (“Documento Orientador das Vias Verdes de EAM e de AVC”).
The ability to readily identify the syptoms, along with a quick response from emergency and medical teams, in order to initiate the trombolitic treatment in due time, are of major importance.
When considering data on the time elapsed since the beginning of syptoms until arrival to the hospital (“onset-to-door”), not much improvement has been achieved since the implementation of the program, and approximately 50% of the patients transported by INEM take longer than 1hour to arrive to the hospital (however, since INEM only publishes data since 2007, it is not possible to assess the differences between the period before and after the program’s implementation).
28 | P a g e Along with this, goes the fact that, of all the episodes that meet the program’s requirements (ischemic stroke patients with age between 18 and 80), only a small fraction has been treated with rt-PA (from 1% in 2005 to 7% in 2008), which means that the ultimate purpose of the program (providing the stroke patients with trombolitic treatment) is very rarely achieved and only a very small fraction of the target population is actually beneficting from the process in full.
“Onset-to-door” time – 2007-2009 Target Episodes vs. Number of Trombolysis
Graph 16 – (INEM) Graph 17 – (GDH, 2004-2009), (ARSN, 2009)
3.3. Post-hospital Care and Rehabilitation
Another very relevant stage of the stroke process is post-hospital care. As mentioned before, many countries have adopted programs that include rehabilitation treatment, in order to improve the patients health conditions and their functional status, since many of those who survive are still limited in their phisical conditions.
In Portugal, in particular, although there is the intention to include this stage in the process, there is not much information concerning its actual implementation and monitoring. Also, there is no systematic track of the patients’ health status after hospital discharge, and thus, no information on their evolution over time.
For this reason, and now that the pre and intra-hospital stages are already implemented, it would be important to focus on this issue and to develop mechanisms that would allow stroke patiens to have comprehensive access to post-hospital health care services – properly designed, implemented, and monitored –, thus maximizing the program’s reach throughout the whole process of stroke treatment.
29 | P a g e
VI.
C
ONCLUSIONSThe worldwide burden of mortality by stroke has created the need to develop actions focused on this issue and, in line with what has been done in many countries, Portugal created the program ‘Via Verde do AVC’, aimed to ultimately reduce stroke mortality in the country.
Since the program’s implementation in 2005 until nowadays, data has shown a sharp and steady decrease on stroke mortality in Portugal. However, according to the analysis performed in this thesis, considering both in-hospital observations, as well as population level data, there is no statistical evidence that such decrease is related to the implementation of ‘Via Verde do AVC’.
Moreover, once only the program’s target population (ischemic stroke patients aged between 18 and 80 years old) is considered, the declining trend on mortality is not so clear. Indeed, the overall trend observed seems to be mainly due to the decrease of mortality rates in hemorrhagic stroke patients.
Besides that, it is also worth mentioning that stroke mortality shows declining rates since 2001 - far before the implementation of "Via Verde do AVC".
In an attempt to understand the reason for this results, some possible explanations were presented. First of all, the efforts on Promotion and Information campaigns about the program might have not been enough to reach as many people as it would be possible and desireable. Second, despite the large investments on infrastructures and equipment to allow a faster and better transport and treatment of patients, there is still a very small fraction of the target population being treated with rt-PA medicin as they should . Finally, the poor implementation of post-hospital care might further limit the results of the overall program, given the fact that at this stage is very important to give the patients access to rehabilitation services and thus improving their overall health status.
The analysis itself also has some limitations. As it focus on a limited number of regions, it is not possible to reach conclusions for the whole country. Moreover, in the case of regional analysis, the data was too aggregated, so that it was not possible to clearly define the implementation date of the program in each region (since the data was on a
yearly-30 | P a g e basis), nor to exclude observations that did not meet the program’s requirements (there was only one stroke category, and age groups were different from those established by the program). Nevertheless, it is important to mention that the North region – the main focus of the analysis – is, indeed, the region with the longest period of implementation, the greatest adherence rates, and with the lowest degree of patient flows across regions; so, if one single region should be chosen, this is, apparently, the best one to choose.
Given these limitations, it would be interesting to further explore the topic in future research, including more regions, as well as more accurate data on regional analysis.
In a more technical perspective, and given the fact that stroke is a health problem that, besides death, also tends to cause significant disability on those who survive, it is equally relevant to evaluate the impact of the program not only based on mortality, but also assessing the improvement on functional status of stroke patients since the implementation of ‘Via Verde do AVC’, both at hospital discharge and after rehabilitation.
In short, although the results obtained do not show a very positive picture, it brings to light some important insights of what can be done differently. In this sense, this work should be interpreted as a driving force to continuously strive for the development of better and more effective mechanisms, in which resources are properly alocated and used – afterwards, “Improvement” is a never-ending process.
31 | P a g e
A
PPENDICESAppendix 1: Hospitals – hosp_id Match and Starting Date of “Via Verde do AVC”
hosp_id 2009
hosp_id Hospital Starting date VV
1
AMAR - H. S. Gonçalo -
ANTO P010 H Geral S António 15-11-2005
BARC P013 H. Sta. Maria Maior -
BRAC P017 U. H. Bragança 19-01-2009
BRAG P018 H S. Marcos 05-02-2007
CHAV P027 U. H. Chaves -
FAFE - U.H. Fafe -
FAMA P068 U. H. Famalicão -
FEIR P071 H S. Sebastião 15-11-2005
GAIA P074 H Eduardo Santos Silva 03-03-2008
GUIM P079 U. H. Guimarães 01-04-2009
IPOP P093 IPO Porto -
JOAO P094 H. S. João 15-11-2005
LAME - U.H. Lamego -
MACE P101 U. H. Macedo de Cavaleiros -
MATO P107 H. Pedro Hispano 01-09-2008
MIRA P108 U. H. Mirandela -
OLIV P112 H. São Miguel -
REAL P128 H. S. Pedro deVila Real 03-03-2007
TIRS - U.H. Sto Tirso -
VALE P141 H. Pe. Américo, V. Sousa 22-06-2009
VALO P142 H. N. Sra. Da Conceição do Valongo -
VARZ P143 U.H. Póvoa Varzim -
VIAN P145 H. Sta Luzia de Viana do Castelo 01-09-2009
FARO P070 H. Faro 01-08-2007
PMAO P121 H. Portimão 01-08-2007
1
32 | P a g e Appendix 2: Hospital – “Concelhos” – Region Match (only Hospitals with VV)
hosp_id Concelhos2 Region3
ANTO Porto - Gondomar Porto; Gondomar
BRAC Bragança - Miranda do Douro - Mogadouro - Vimioso -
Vinhais Nordeste
BRAG Amares - Braga - Póvoa de Lanhoso - Terras de Bouro - Vieira
do Minho - Vila Verde Gerês/ Cabreira; Braga
FEIR Arouca - Santa Maria da Feira - Oliveira de Azeméis - Ovar -
São João da Madeira - Vale de Cambra
Feira/ Arouca; Aveiro Norte
GAIA Espinho (Aveiro) - Vila Nova de Gaia(Porto) Gaia/ Espinho
GUIM Cabeceiras de Basto - Celorico de Basto - Fafe - Guimarães -
Vizela
Guimarães/ Vizela; Terras de Basto
JOAO Porto – Maia – Valongo Porto; Maia; Valongo
MATO Matosinhos Matosinhos
REAL
Alijó - Mesão Frio - Mondim de Basto - Murça - Peso da Régua - Ribeira de Pena - Sabrosa - Santa Marta de Penaguião - Vila Pouca de Aguiar - Vila Real
Marão e Douro Norte
VALE Amarante - Baião - Felgueiras - Paços de Ferreira - Paredes -
Penafiel
Vale Sousa Norte; Vale Sousa Sul; Baixo Tâmega
VIAN Caminha - Melgaço - Monção - Valença - Viana do Castelo -
Vila Nova de Cerveira Alto Minho
2
(Portal da Saúde > Prestadores) 3
33 | P a g e Appendix 3: Descriptive Statistics of In-hospital data (GDH 2004-2009)
STATS
VAR
MEAN STD.DEV RANGE N.OBSERV
Total Program Criteria Total Program Criteria Total Program Criteria Total Program Criteria DMort 14,6% 8,1% 35,3% 27,3% [0 = Alive; 1 = Dead]
51.603 28.842
sex 49,8% 43,6% 50,0% 49,6% [0 = Man; 1 = Woman]
age 72,6 67,3 12,6 10,3 [0-113] [19-79]
Nddx 5,25 5,26 3,50 3,46 [1-20]
34 | P a g e Appendix 4: In-hospital Analysis - detailed results
1. Ischemic stroke
DMort Coef. Std. Err. z P>|z| [95% Conf. Interval]
VV 0,100 0,079 1,26 0,21 -0,05 0,25 Nddx 0,091 0,008 11,46 0,00 0,08 0,11 sex 0,078 0,044 1,76 0,08 -0,01 0,16 age 0,115 0,147 0,78 0,43 -0,17 0,40 age2 -0,193 0,248 -0,78 0,44 -0,68 0,29 age3 0,139 0,138 1,01 0,31 -0,13 0,41 _Iyear_2005 -0,053 0,077 -0,7 0,49 -0,20 0,10 _Iyear_2006 -0,054 0,077 -0,7 0,48 -0,20 0,10 _Iyear_2007 -0,050 0,080 -0,63 0,53 -0,21 0,11 _Iyear_2008 -0,200 0,087 -2,29 0,02 -0,37 -0,03 _Iyear_2009 -0,106 0,093 -1,14 0,26 -0,29 0,08 _Ihosp_id_2 -0,314 0,180 -1,74 0,08 -0,67 0,04 _Ihosp_id_3 -0,168 0,191 -0,88 0,38 -0,54 0,21 _Ihosp_id_4 0,333 0,210 1,59 0,11 -0,08 0,74 _Ihosp_id_5 0,012 0,165 0,07 0,94 -0,31 0,33 _Ihosp_id_6 -0,106 0,190 -0,56 0,58 -0,48 0,27 _Ihosp_id_8 0,141 0,199 0,71 0,48 -0,25 0,53 _Ihosp_id_9 -0,604 0,210 -2,88 0,00 -1,02 -0,19 _Ihosp_id_10 0,027 0,188 0,15 0,89 -0,34 0,40 _Ihosp_id_11 -0,311 0,186 -1,67 0,10 -0,68 0,05 _Ihosp_id_12 -0,162 0,166 -0,97 0,33 -0,49 0,16 _Ihosp_id_13 -0,410 0,165 -2,48 0,01 -0,73 -0,09 _Ihosp_id_14 0,453 0,508 0,89 0,37 -0,54 1,45 _Ihosp_id_15 -1,035 0,174 -5,94 0,00 -1,38 -0,69 _Ihosp_id_16 0,020 0,211 0,09 0,93 -0,39 0,43 _Ihosp_id_17 0,280 0,197 1,42 0,16 -0,11 0,67 _Ihosp_id_18 0,341 0,166 2,06 0,04 0,02 0,67 _Ihosp_id_19 0,856 0,188 4,57 0,00 0,49 1,22 _Ihosp_id_20 -0,337 0,226 -1,49 0,14 -0,78 0,11 _Ihosp_id_21 0,244 0,177 1,38 0,17 -0,10 0,59 _Ihosp_id_22 0,229 0,165 1,39 0,16 -0,09 0,55 _Ihosp_id_23 -0,411 0,243 -1,69 0,09 -0,89 0,07 _Ihosp_id_24 -0,255 0,165 -1,55 0,12 -0,58 0,07 _Ihosp_id_25 -0,561 0,267 -2,1 0,04 -1,08 -0,04 _Ihosp_id_26 0,064 0,194 0,33 0,74 -0,32 0,44 _Ihosp_id_27 -0,190 0,161 -1,18 0,24 -0,51 0,13 _cons -6,091 2,826 -2,16 0,03 -11,63 -0,55 Stats Number of obs = 28837 LR χ2 (36) = 673.53 Prob > χ2 = 0.0000 Pseudo R2 = 0,0414 Joint Tests year χ2 (5) = 6.02 Prob > χ2 = 0.3040 hospital χ2 (25) = 257.27 Prob > χ2 = 0.0000
35 | P a g e Stats Number of obs = 26941 LR χ2 (34) = 627,85 Prob > χ2 = 0,0000 Pseudo R2 = 0,0417 Joint Tests year χ2 (5) = 5.64 Prob > χ2 = 0.3040 hospital χ2 (25) = 242.68 Prob > χ2 = 0.0000 2. ARS Norte
DMort Coef. Std. Err. z P>|z| [95% Conf. Interval] VV 0,091 0,083 1,100 0,273 -0,072 0,255 Nddx 0,090 0,008 11,050 0,000 0,074 0,106 sex 0,067 0,046 1,460 0,143 -0,023 0,158 age 0,181 0,155 1,160 0,244 -0,123 0,485 age2 -0,314 0,263 -1,200 0,231 -0,829 0,200 age3 0,210 0,145 1,440 0,149 -0,075 0,494 _Iyear_2005 -0,050 0,078 -0,640 0,522 -0,202 0,103 _Iyear_2006 -0,041 0,079 -0,520 0,603 -0,195 0,113 _Iyear_2007 -0,060 0,082 -0,730 0,464 -0,222 0,101 _Iyear_2008 -0,198 0,089 -2,220 0,026 -0,372 -0,024 _Iyear_2009 -0,104 0,096 -1,080 0,280 -0,292 0,085 _Ihosp_id_2 -0,305 0,181 -1,680 0,092 -0,659 0,050 _Ihosp_id_3 -0,164 0,191 -0,860 0,391 -0,539 0,211 _Ihosp_id_4 0,332 0,210 1,580 0,113 -0,079 0,743 _Ihosp_id_5 0,016 0,165 0,100 0,924 -0,308 0,339 _Ihosp_id_6 -0,106 0,190 -0,560 0,578 -0,478 0,266 _Ihosp_id_8 0,139 0,199 0,700 0,485 -0,251 0,530 _Ihosp_id_9 -0,605 0,210 -2,880 0,004 -1,017 -0,193 _Ihosp_id_11 -0,305 0,187 -1,630 0,103 -0,672 0,062 _Ihosp_id_12 -0,159 0,167 -0,950 0,342 -0,485 0,168 _Ihosp_id_13 -0,410 0,165 -2,480 0,013 -0,733 -0,086 _Ihosp_id_14 0,460 0,508 0,910 0,365 -0,535 1,456 _Ihosp_id_15 -1,018 0,176 -5,800 0,000 -1,362 -0,674 _Ihosp_id_16 0,019 0,211 0,090 0,928 -0,394 0,432 _Ihosp_id_17 0,280 0,197 1,420 0,156 -0,107 0,667 _Ihosp_id_18 0,342 0,166 2,060 0,039 0,017 0,667 _Ihosp_id_19 0,853 0,188 4,550 0,000 0,486 1,221 _Ihosp_id_20 -0,331 0,226 -1,460 0,143 -0,774 0,112 _Ihosp_id_22 0,233 0,165 1,410 0,158 -0,091 0,557 _Ihosp_id_23 -0,411 0,243 -1,690 0,091 -0,887 0,065 _Ihosp_id_24 -0,253 0,165 -1,540 0,124 -0,577 0,070 _Ihosp_id_25 -0,557 0,267 -2,090 0,037 -1,079 -0,034 _Ihosp_id_26 0,065 0,194 0,330 0,739 -0,316 0,446 _Ihosp_id_27 -0,190 0,161 -1,180 0,238 -0,507 0,126 _cons -7,200 3,002 -2,400 0,016 -13,084 -1,316