DIAS, J. M. and LOPES, J. F., 2006. Calibration and validation of hydrodynamic, salt and heat transport models for Ria de Aveiro lagoon (Portugal). Journal of Coastal Research, SI 39 (Proceedings of the 8th International Coastal Symposium), 1680 - 1684. Itajaí, SC Brazil, ISSN 0749-0208.
Ria de Aveiro is a very complex shallow water coastal lagoon located on the northwest of Portugal. Important issues would be left unanswered without a good understanding of hydrodynamic and transport processes occurring in the lagoon. Calibration and validation of hydrodynamic, salt and heat transport models for Ria de Aveiro lagoon are presented. The calibration of the hydrodynamic model was performed adjusting the bottom friction coefficient, through the comparison between measured and predicted time series of sea surface elevation for 22 stations. Harmonic analysis was performed in order to evaluate the model's accuracy. To validate the hydrodynamic model measured and predicted SSE values were compared for 11 stations, as well as main flow direction velocities for 10 stations. The salt and heat transport models were calibrated comparing measured and predicted time series of salinity and water temperature for 7 stations, and the RMS of the difference between the series was determined. These models were validated comparing the model results with an independent field data set. The hydrodynamic and the salt and heat transport models for Ria de Aveiro were successfully calibrated and validated. They reproduce accurately the barotropic flows and can therefore adequately represent the salt and heat transport and the heat transfer processes occurring in Ria de Aveiro.
ADDITIONAL INDEX WORDS: Coastal lagoon, numerical modelling, harmonic analysis. ABSTRACT
Calibration and Validation of Hydrodynamic, Salt and Heat Transport Models for
Ria de Aveiro Lagoon (Portugal)
J.M. Dias† and J.F.Lopes‡
INTRODUCTION
STUDY AREA
NUMERICAL MODELS
Hydrodynamic Model
A mathematical model is by definition an attempt toapproximate and reproduce real phenomena. The approximations and parameterizations used for the synthesis of the model lead to discrepancies and deviations of model results from nature. The optimization of the model operation is a complicated task and before using a model for operational applications the model should be verified, calibrated and validated. However, there is no widely accepted procedure for carrying out these tasks , 1991). Model calibration and validation appears in various forms, dependent on data availability, characteristics of water body, and most of all, the perceptions and opinions of modellers (HSU ., 1999).
The aim of this paper is to present the calibration and validation of the hydrodynamic, the salt and the heat transport models for Ria de Aveiro lagoon.
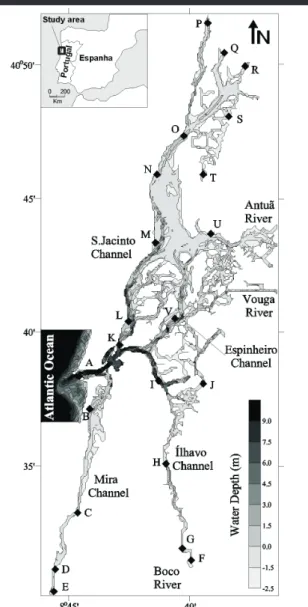
Ria de Aveiro (Figure 1) is a shallow vertically homogeneous lagoon with a very complex geometry, located on the northwest coast of Portugal (40º38'N, 8º45'W). It is 45 km long and 10 km wide and it is characterized by narrow channels and large areas of mud flats and salt marshes, covering 83 km at high tide in a spring tide, which is reduced to 66 km at low tide.
Ria de Aveiro is a mesotidal lagoon (DAVIES, 1964), and the tides, which are semidiurnal, are the main forcing action. It receives freshwater mainly from two rivers, Antuã (5 m s average flow) and Vouga (50 m s ) (MOREIRA ., 1993; DIAS ., 1999). Boco river, at the southern end of Ílhavo cannel, has a negligible flow, as well as Caster and Gonde rivers, discharging at the north end of S.Jacinto channel. There is another freshwater source at the southern end of Mira channel, that consists in a small system of ponds and rivers, from which flow is not well known.
A prior hydrological characterization of Ria de Aveiro (DIAS ., 1999) lead to the conclusion that the lagoon can be considered as vertically homogeneous.
One of the objectives of this work is to develop a system of mathematical models able to simulate tidal flows and transport in Ria de Aveiro. Considering the characteristics of the Ria de Aveiro a 2DH model was considered to be a right choice to simulate the hydrodynamics and the transport of salt and heat in this lagoon (DIAS, 2001).
A two-dimensional vertically integrated hydrodynamic model was applied. This model was developed from the SIMSYS2D model (LEENDERTSE and GRITTON, 1971; LEENDERTSE, 1987 (CHENGet al. et al et al et al et al 2 2 3 -1 3 -1
where and are the depth integrated velocity components in the (eastward) and (northward) directions, respectively, is the surface water elevation, is the water height, is the time, is the Coriolis parameter, is the acceleration of gravity, is the water density, is the kinematical turbulent horizontal viscosity, and are, respectively, the magnitude of the wind stress on the water surface and the magnitude of the bottom shear.
The model adopts the quadratic empirical relationship between the wind stress and the surface wind proposed by
Ekman ). U V x y H t f g A z r t t t h s b s
(DRONKERS,1964;LEENDERTSEandGRITTON,1971 †Departamento de Física,
Universidade de Aveiro, 3810-193 Aveiro, Portugal [email protected]
Journal of Coastal Research Special Issue 39, 2006 ‡ Departamento de Física, Universidade de Aveiro, 3810-193 Aveiro, Portugal [email protected] 0 ) ( ) ( = ¶ ¶ + ¶ ¶ + ¶ ¶ y HV x HU t V (1) (2) (3) U A H x g fV y U V x U U t U h b x s x- + Ñ2 + ¶ ¶ -= ¶ ¶ + ¶ ¶ + ¶ ¶ r t t V V A H y g fU y V V x V U t V h b y s y- + Ñ2 + ¶ ¶ -= ¶ ¶ + ¶ ¶ + ¶ ¶ r t t V
The bottom stress is assumed proportional to the square of the horizontal velocity
where is the Chézy coefficient. In the present work the Chézy coefficient is determined from the Manning roughness coefficient,
(DRONKERS, 1964; LEENDERTSE
GRITTON,
(CHOW,
(LEENDERTSE GRITTON, DIAS,
(DIAS,
(LEONARD,
NSTITUTOHIDROGRÁ FICO
(BURAU CHENG, CHENG GARTNER, and
1971):
1959):
The system of equations (1)-(3) was discretized using a finite difference method and the difference equations solved by the ADI method (alternating direction implicit), using a
space-staggered grid and 1971; 2001).
With appropriate boundary and initial conditions, this system of equations constitutes a well-posed problem whose solution describes the depth-averaged circulation in a tidal basin. The numerical bathymetry (Figure 1) has the dimensions = 100m, resulting in 160 cells in the direction and 393 cells in the direction. At the ocean open boundary the water elevation over the reference level was imposed using tidal harmonics constituents. Constant current velocity was imposed at the rivers boundaries. The initial conditions were horizontal level and null velocity in all the grid points. Along the solid boundaries a null normal velocity was imposed and a free slip condition was assumed.
Knowing the horizontal velocity field determined by the hydrodynamic model it is possible to determine the salt and the temperature distributions, solving the transport equations of salt and heat 2001):
where nd are the depth integrated salinity and water temperature, and are the horizontal turbulent salt and heat diffusivities, respectively, is a source term representing the heat flux through a horizontal surface and is the air specific heat at constant pressure.
The model adopted uses the flux corrected transport algorithm (FCT) in order to discretize the advection term
1979).
Initial conditions for the transport models are salinity and temperature fields obtained by interpolation of available data. Salinity and temperature condition at the open boundary corresponds to variable ocean salinity and temperature in each time step of the computation. Different boundary river conditions were imposed for the diverse simulations performed during the execution of this work.
The calibration was performed adjusting the bottom friction coefficient for the entire lagoon, through the comparison between measured and predicted time series of sea surface elevation (SSE) for 22 stations distributed throughout the main channels of the lagoon. The data consisted of hourly measurements performed by the Hydrographical Institute of the Portuguese Navy (IH) using temporary tide gauge stations
(I , 1991).
From the observation of the SSE data it can be concluded that the friction at the bottom dissipates energy as the tidal wave propagates landward from the lagoon mouth. Considering lagoon geometry and the tidal range at the mouth defined, the magnitude of the bottom friction coefficient determines the tidal range variation along the lagoon channels. The remaining parameter subjected to adjustment during the model calibration is therefore the bottom stress represented by the Manning-Chézy formulation (equations 4 and 5). Previous modelling experience and 1988) and results of data analysis ( and 1985) suggest a stronger influence of the water depth in the bottom stresses than the Manning-Chézy relation does. This effect can be introduced into the computations by allowing Manning's to vary as a function of water depth. In this model, Manning's values are rather assigned to a range of water depth than to every point water depth (Table 1).
C n D Dx y= x y S a T K K F C n n
Salt and Heat Transport Models
MODELS CALIBRATION
Hydrodynamic Model
S T
p
Journal of Coastal Research Special Issue 39, 2006
2 2 / 1 2 2 2 2 / 1 2 2 ) ( and ) ( C V U U g C V U U g by b x =r + t =r + t (4) n H C 6 = (5) S H K y HVS x HUS t HS S 2 ) ( ) ( Ñ = ¶ ¶ + ¶ ¶ + ¶ ¶ (6) F C T H K y HVT x HUT t HT p T r 1 ) ( ) ( = Ñ2 -¶ ¶ + ¶ ¶ + ¶ ¶ (7)
Table 1. Bottom friction coefficient.
Water Depth (m) Manning's value
-2.5 < -2.0 0.042 -2.0 < -1.5 0.038 -1.5 < -1.0 0.034 -1.0 < -0.5 0.030 -0.5 < 0.0 0.027 0.0 < 0.5 0.024 0.5 < 1.0 0.022 1.0 < 3.0 0.020 3.0 < 10.0 0.018 10.0 0.015 n h h h h h h h h h h £ £ £ £ £ £ £ £ £ ³ Figure 1. Ria de Aveiro lagoon, with the locations of the stations
Journal of Coastal Research Special Issue 39, 2006
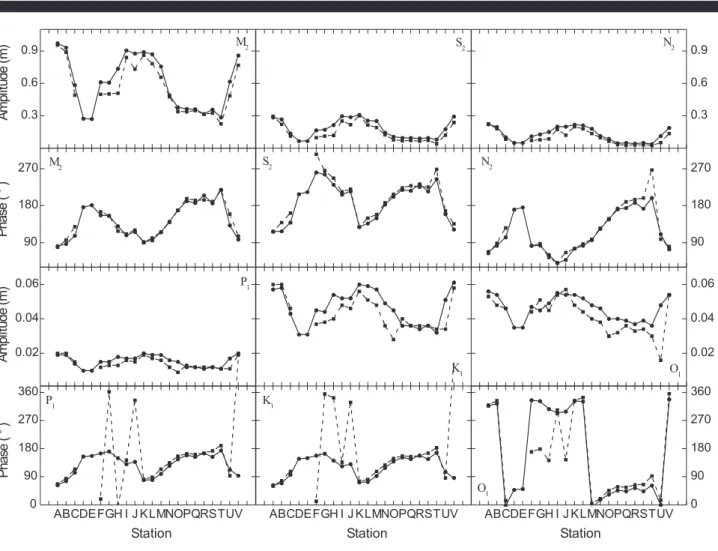
Harmonic analysis (F , 1977; and
1989) was performed on 29 days length time series of observed and predicted SSE for all the stations. Figure 2 shows the comparison between tidal amplitude and phase for , , , , and harmonic constituents determined from the predicted and observed time series of SSE. The agreement between the predicted and observed values is rather good both in amplitude and in phase for the semidiurnal constituents, which are the major tidal constituents in Ria de Aveiro. For the constituent, which amplitude is the highest one, the mean difference between predicted and observed amplitudes is about 7 cm. The results for the other semidiurnal and diurnal constituents seem less accurate, but nevertheless still reveal a good agreement between the predicted and the observed constants. The comparison between these values reveals that the amplitude of the major constituents may be considered well represented by the numerical model for the entire lagoon, with average differences lower than 4 cm.
The tide propagation of the and constituents for all the stations is also well represented by the predicted phase. A good agreement between the predicted and the observed values for all the stations, leads to the conclusion that the model calibration was successfully achieved. However there are some features that must be referred. It is crucial to refer that the agreement between the predicted and observed values at station A (mouth of the lagoon) is not perfect, as it may be expected. The model is forced imposing at the open boundary the tide synthesized from the harmonic constituents determined from SSE observed at station A. For the diurnal constituents the agreement may be considered good for all the stations, except stations F, G, H and J. The large errors found for these stations may be explained by an inaccurate definition of the bathymetry in the model for a specific area of this channel or by the shallowness of these areas. In fact, between stations H and I there is a strong constriction in the channel, with a width of
about 10 m where very strong currents occur. This region is very difficult to represent in the numerical bathymetry using a cell 100 m width, and therefore it was found impossible to
OREMAN FOREMAN HENRY, M S N P K O M M , S N 2 2 2 1 1 1 2 2 2 2 improve the agreement between the predicted and observed surface elevation for the stations located southward of this constriction. In fact, upstream of the constriction in Ílhavo channel the phase predicted results for the diurnal constituents are not reliable.
Assuming that the barotropic flows (tidal and freshwater flows) have been calibrated and validated, the procedure to calibrate the salinity transport model consists in matching the observed and computed salinity time series
Once the salinity transport model is considered calibrated, the transport processes may be well represented by the model. Therefore, the calibration of the heat transport model is related only to the parameterization of the heat and the radiative fluxes.
A set of salinity and temperature data was measured between 9/7/96 and 28/7/96, and was available for comparison with model results. These data include long time series of salinity and temperature measured each 10 minutes at the mouth of the lagoon (station A). It also includes 25 hours time series of hourly measured values at 7 different stations distributed throughout the lagoon channels. These data were measured after a long period without precipitation, a typical situation of the Summer season, where the freshwater inputs from the rivers are expected to be low.
The salinity and the temperature values were specified at the western open boundary. The freshwater inflows through the upstream boundaries are not known, and in this study are used as calibration parameters. The freshwater discharge values imposed at the rivers boundaries were the following: Vouga river - 2 m s ; Antuã river - 0.5 m s ; Boco river - 0.1 m s ; Mira - 0.2 m s ; Caster river - 0.08 m s ; Gonde river - 0.01 m s . The freshwater salinity was specified as 0, the Vouga and Antuã
Salt and Heat Transport Models
3 -1 3 -1 3 -1 3 -1 3 -1 3 -1 0.3 0.6 0.9 90 180 270 90 180 270 0.3 0.6 0.9 0.02 0.04 0.06 ABCDEFGH I J KLMNOPQRSTUV 0 90 180 270 360 ABCDEFGH I J KLMNOPQRSTUV 0.02 0.04 0.06 ABCDEFGH I J KLMNOPQRSTUV 0 90 180 270 360 A m plitu de (m ) M2 Ph as e ( o ) M2 S2 S2 N2 N2 A m plitu de (m ) P1 P1 Ph as e ( o ) Station Station K1 K1 O1 O1 Station
Journal of Coastal Research Special Issue 39, 2006 freshwater temperature as 23 ºC and the remaining freshwater
temperatures as 25 ºC.
Figure 3 shows the comparison between the predicted and observed salinity and temperature time series for station H. The root-mean square ( ) value was computed and is presented in the plot.
The agreement between the predicted and observed salinity values may be considered good for all the stations, accurately representing the salinity time evolution and amplitude variation. The maximum absolute value was determined for station O, with a value of 0.64, which represents about 10% of the local salinity amplitude. The values for the other stations are also around 10% of the local salinity amplitude.
In general there is a good agreement between the predicted and the observed temperature values. The values are typically about 5% of the local temperature amplitude.
According to these results it may be considered that the transport processes in Ria de Aveiro are well simulated by the numerical models. The heat transfer between the atmosphere and the water surface may also be considered well represented in the transport model.
To validate the model water level and velocity measurements performed in June 1997 were used. Hourly measurements of the SSE at 11 different stations and of the current velocity at 10 stations are compared with model predictions. The simulation was performed without changing the values of the friction coefficient determined in calibration procedure. The ocean boundary condition was the SSE synthesized for the period of measurements. At the rivers boundaries typical high freshwater discharge values were imposed: Vouga river - 450 m s ; Antuã river - 46 m s ; Boco river - 2.5 m s ; Mira - 42 m s ; Caster river - 2.0 m s ; Gonde river - 1.2 m s . The remaining input variables were left unchanged.
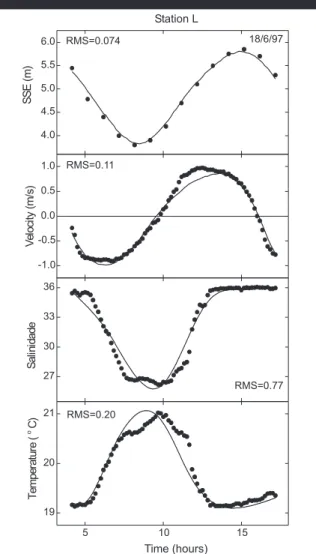
The comparison between the predicted and observed SSE for station L is plotted in Figure 4. The values are around 5% of the local tidal range for all the stations. The agreement between the values is rather good, revealing that there are no discrepancies between model predictions and field measurements.
In order to compare the current velocities the main flow direction at each station was determined. Predicted and observed current velocities were projected along these
directions. The comparison between the predicted and the observed along flow velocities for station L is plotted in Figure 4, showing a good agreement between them. The model therefore properly simulates the temporal variation of velocity in terms of current amplitude and phase.
Based on the results, the hydrodynamic numerical model for Ria de Aveiro has been considered successfully validated.
The salt and heat transport models were validated comparing the model results with an independent data set. Salinity and temperature values measured in June 1997 at 11 different stations were used. These data correspond to a very wet period, where high rivers runoffs are expected. Therefore, the transport models were validated for conditions different from those used during their calibration.
The salinity and the temperature values measured every 10 minutes at the mouth of the lagoon were used as model inputs at the western open boundary. The rivers freshwater inflows were the same specified in the previous section, and the temperature values the same specified for the calibration procedure. The remaining input variables were left unchanged.
reveals a good agreement between the model results and observed values. The salinity values range from around 4% (Station C) to 11% (Stations D and F) of the local salinity amplitude. The temperature values are slightly higher than those found during calibration procedure, ranging from about 6% (Station D) to about 17% (Station I) of the local temperature amplitude. RMS RMS RMS RMS RMS RMS RMS
MODELS VALIDATION
Hydrodynamic Model
Salt and Heat Transport Models
3 -1
3 -1 3 -1 3 -1
3 -1 3 -1
The comparison between the predicted and observed salinity and temperature values for station L is shown in figure 4, and
30 32 34 20 21 22 RMS=0.33 RMS=0.35 20 1 6 11 15 20/7/96 Station H Sa lin ity Te m per at ur e ( oC) Time (hours) 4.0 4.5 5.0 5.5 6.0 -1.0 -0.5 0.0 0.5 1.0 27 30 33 36 5 10 15 19 20 21 RMS=0.074 18/6/97 Station L SSE (m ) RMS=0.11 Vel oc ity (m /s ) RMS=0.77 S al ini da de RMS=0.20 T empe rat ur e ( oC) Time (hours)
Figure 3. Comparison of time series of salinity and temperature for station H, used in the salt and heat transport models calibration ( data;· model).
Figure 4. Comparison of time series of SSE, along flow direction velocity, salinity and temperature for station L, used in models validation ( data;· model).
Journal of Coastal Research Special Issue 39, 2006 From these results the salt and the heat transport models have
been considered validated, simulating well the transport and heat transfer processes in Ria de Aveiro, even in situations of high rivers freshwater input.
According to the results obtained the hydrodynamic and the salt and the heat transport models for Ria de Aveiro have been successfully calibrated and validated. These models reproduce accurately the barotropic flows and adequately simulate the salt and heat transport, as well as the heat transfer processes occurring in Ria de Aveiro.
The models can therefore be used in the future to study important issues concerning the lagoon hydrodynamic and water quality.
This research was supported by FCT through ModelRia and Proteu projects.
J.R. and R.T., 1988. Predicting tidal currents in San Francisco Bay using a spectral model.
, 634-639.
R.T. and J.W., 1985. Harmonic analysis of tides and tidal currents in South San Francisco Bay,
California. , 21, 57-74.
R.T.; J.R. and J.W., 1991.
Interfacing data analysis and numerical modelling for tidal hydrodynamic phenomena. In: PARKER, B.B. (ed.),
. New York, USA, John Wiley & Sons, p 201-219.
V.T., 1959. , New York, USA:
McGraw-Hill, 680p.
J.L., 1964. A morphogenetic approach to world
shorelines, ., 8, 27-42.
J.M., 2001. Contribution to the study of the Ria de Aveiro hydrodynamics. Aveiro, Portugal: University of Aveiro, Ph.D. thesis, 288p.
J.M.; J.F., and I., 1999. Hydrological characterization of Ria de Aveiro, in early summer
, 22, 473-485.
J.J., 1964. Tidal Computations in Rivers and Coastal Waters. Amsterdam, The Netherlands: North-Holland Publishing Company.
M.G.G., 1977.
. Victoria, Canada: Inst. of Ocean Sciences, Pac. Mar. Sci. Rep., 77-10.
M.G.G. and R.F., 1989. The harmonic analysis of tidal model time series.
, 12, 109-120.
M.H.; A.Y.; J.T. and W.C., 1999.
Procedure to calibrate and verify numerical models of estuarine hydrodynamics.
, 166-182. 1991.
Relatório FT.MC. 5/87. Lisboa, Portugal: Instituto Hidrográfico.
J.J., 1987.
. Report R-3572-USGS. New York, USA: The Rand Corporation.
J.J. and E.C., 1971.
. Memorandum R-708-NYC. New York, USA: The Rand Corporation.
B.P., 1979. A stable and accurate convective modelling procedure based on quadratic upstream
interpolation. 19, 59-98.
H.M.; H.; M.M., and
M.R., 1993. Environmental gradients in a southern estuarine system: Ria de Aveiro, Portugal, Implication for soft bottom macrofauna colonization.
, 27(2-4), 465-482.
CONCLUSIONS
ACKNOWLEDGEMENT
LITERATURE CITED
BURAU, CHENG, CHENG, GARTNER,CHENG, BURAU, GARTNER,
CHOW, DAVIES,
DIAS,
DIAS, LOPES, DEKEYSER,
DRONKERS, FOREMAN, FOREMAN, HENRY, HSU, KUO, KUO, LIU, INSTITUTO LEENDERTSE, LEENDERTSE, GRITTON, LEONARD,
MOREIRA, QUEIROGA, MACHADO, CUNHA,
Proceedings 1988 ASCE National Conference Hydraulic Engineering
Estuarine, Coastal and Shelf Science
Tidal Hydrodynamics
Open Channel Hydraulics
Zeit. Geomorphol
. Oceanologica Acta
Manual for tidal heights analysis and predictions Advanced Water Resources Journal of Hydraulic Engineering Recolha e processamento de dados de marés, correntes, temperaturas e salinidades na Ria de Aveiro.
Aspects of SIMSYS2D, a system for two-dimensional flow computation
A Water--Quality Simulation Model for Well--Mixed Estuaries and Coastal Seas: Volume II, Computation Procedures
Comp Methods Appl Mech Eng,
Netherlands Journal of Aquatic Ecology