Probing the Structure of Liquids with
129
Xe NMR Spectroscopy:
n‑Alkanes, Cycloalkanes, and Branched Alkanes
Pedro Morgado,
†Rui Bonifa
́cio,
†Luís F. G. Martins,
‡and Eduardo J. M. Filipe*
,††Centro de Química Estrutural, Instituto Superior Técnico, Universidade Técnica de Lisboa, 1049-001 Lisboa, Portugal ‡Centro de Química de Évora, Universidade de Évora, Rua Romão Ramalho, 59, 7000-671 Évora, Portugal
ABSTRACT: The liquid organization of linear, branched, and cyclic alkanes was studied using atomic 129Xe as a NMR probe. 129Xe chemical shifts have been experimentally determined for xenon dissolved in a total of 21 alkanes. In order to allow the comparison of the different solvents at similar thermodynamic conditions, the measurements were performed over a wide range of temperatures, from the melting point of the solvent up to 350 K. The results were rationalized in terms of the density, nature, and organization of the chemical groups within xenon’s coordination sphere. Additionally, molecular dynamics simulations were performed using established atomistic force fields to interpret and clarify the conclusions suggested by the experimental results. The analysis is able to interpret previous results in the literature for ethane and propane at very different experimental conditions.
■
INTRODUCTIONThe properties of liquids and liquid mixtures are known to depend largely on the organization of the fluid, for which molecular shape (i.e., repulsion forces) is a key factor. Nevertheless, and in spite of considerable efforts, modeling and predicting the structure of liquids remains a major challenge even to state of the art theories of fluids and to detailed computational models. Thermodynamic data, although largely used for this purpose, is unable to provide direct structural information at the molecular level. Therefore, combining thermodynamic studies with microscopic informa-tion obtained, for example, from spectroscopic techniques can be an important step toward the elucidation of the structure of liquids.
In this context, systems involving n-alkanes and noble gases have been extensively studied and used as model systems for testing statistical theories of liquids. These chemical families provide a range of molecules whose physical properties gradually change within the homologous series or periodic group, and are therefore especially suited to study the role of size, shape, andflexibility on the properties of liquid mixtures. The interaction between xenon and the n-alkanes, in particular, has been extensively studied. Xenon is highly soluble in lipids and fats and shows anesthetic properties at subatmospheric pressures. Given its chemical inertia, nontoxicity, and non-flammability (which make it an easy and safe gas to handle), xenon could be considered the perfect anesthetic; its use was submitted for regulatory medical approval in Europe.1A further important application of xenon in nuclear medicine involves the use of 133Xe isotope to study cerebral blood flow and pulmonary functions.2
At the molecular level, xenon is a spherical and structureless particle, with a high polarizability that enhances dispersion
forces. Its intermolecular potential is therefore relatively well characterized. Additionally, 129Xe, with spin I = 1/2 and a natural abundance around 26%, has a NMR active nucleus. Because of their large and highly polarizable electron cloud, xenon atoms are very sensitive to the local molecular environment around them. In xenon chemical compounds, the range of chemical shifts of129Xe is larger than 6000 ppm, and even for atomic xenon, this range exceeds 200 ppm.3 The sensitivity of the129Xe chemical shift to the molecular medium, combined with its size and inertness, makes this noble gas an excellent NMR probe, used in studies of condensed phases, microporous materials, biological systems, and their proper-ties.4−8
Very often, the use of molecular probes presents disadvantages, as many of the observed effects cannot be unambiguously separated from those caused by the presence of the probe itself. In the case of xenon, however, we have shown in previous studies9−11 on mixtures of liquid xenon with a number of different substances that xenon can be modeled as a sphere with almost the same diameter and intermolecular potential as those suited to describe the n-alkanes.12Xenon can thus be viewed as the smallest alkane, and when dissolved in a liquid, it will produce the least possible perturbation in the structure of the solvent. In this respect, xenon can be considered the ideal probe. This is in agreement with the fact that the diameter of the xenon atommeasured, for instance, in terms of its van der Waals radiusmatches the cross-sectional diameter of the n-alkanes with more than three carbon atoms.
Received: March 6, 2013 Published: July 8, 2013
Several NMR studies in the literature have tried to find relations between the129Xe chemical shift in solution and the nature of the solvent. One of the first, by Miller et al., was motivated by the fact that xenon is an anesthetic substance; the 129Xe chemical shift was obtained in several solvents and in solutions of proteins and biological membranes, aiming to achieve a better understanding of the mechanism of anesthesia.13 Other studies followed, proposing relations between solvent properties and the xenon chemical shift; many of these works use reaction field models14,15 where the chemical shift is correlated with the refractive index of the solvent, treated as a continuum. The importance of adopting a microscopic description of the liquid was soon recognized.5,16,17 This approach implies obtaining information on the local arrangement of solvent molecules around the xenon atom, for example, from molecular simulations. Luhmer and Bartik,17for example, reported 129Xe chemical shifts at 293 K in several series of organic solvents (n-alkanes, cycloalkanes, n-alkanols, etc.) as a function of chain length (n). Recognizing the importance of the solvent density (ρ) to the observed medium shifts (δm), they have shown that molar medium shifts (δ*m= δm/ρ) change linearly with n, displaying similar slopes for all studied families (with the exception of cycloalkanes), setting the basis for a group contribution method. Furthermore, they have shown that, contrarily to Lim and King,5 the molar contribution to the129Xe chemical shift of the CH3group (3.95 ppm M−1) is larger than that of CH2(3.289 ppm M−1). As for cycloalkanes, the fact that different δ*(CH2) values are found for cycloalkanes and n-alkanes was attributed, qualitatively, to differences in the arrangement of CH2groups around the Xe atom, as a consequence of geometric constraints imposed by the cyclic structure. Additionally, the authors observed that the chemical shifts in the shortest members of the series deviate from the general trend depicted by the long-chain solvents. This effect was partially attributed, once again, to particular features of the short-chain solvents that affect the structure of the xenon solvation shell.
All of these studies, however, have tried to rationalize the variation of the129Xe chemical shift with the solvent properties based on measurements at constant temperature. Although we understand the value of data at a single temperature, in particular for some applications, we would like to emphasize the fact that, at the same absolute temperature, different solvents can be in radically different thermodynamic conditions such as density and thermal agitation. For example, at room temper-ature, hexadecane is a dense liquid, close to its melting point, with a very low vapor pressure; in contrast, at the same temperature, butane is above its normal boiling point, and with a 25% lower mass density.
More recently, methods have been reported which allow the prediction of 129Xe chemical shifts in liquids from first principles.18−21 Sears et al.18reported isotropic chemical shift functions obtained from quantum mechanical calculations for a large number of configurations of the Xe−CH4 system. As explained by the authors, these additive site−site (Xe−C and Xe−H) shielding functions are not entirely transferable to solutions of xenon in other alkanes. The difference between results obtained from using configurations of the Xe−CH4 system and from Xe−C2H6was found to be of the order of 5%. In ref 19, these shielding functions were used together with classical molecular dynamics simulations for averaging the chemical shift through the different configurations of xenon− alkane solutions. Following our suggestion, the authors were
able to show the importance of comparing results for different systems at the same thermodynamic state. For example, it was shown that the molar contribution to the129Xe chemical shift of the CH3group is larger than that of CH2, in agreement with the results of Luhmer and Bartik.17In a subsequent study,20 the same methodology was applied to investigate solutions of xenon in cycloalkanes. In this work, cycloalkanes were modeled as flexible molecules. It was found, however, that good predictions of the xenon chemical shift required cross interaction parameters similar to those needed for the interaction between xenon and the n-alkanes modeled as rigid bodies. This was interpreted as a consequence of (i) the rigidity of cycloalkanes as compared with n-alkanes and (ii) the reduced accessibility of some of the CH2 groups in cycloalkanes to interact with xenon as a result of its cyclic structure.
Very recently, Standara et al.21calculated the chemical shift of atomic xenon dissolved in liquid benzene combining classical molecular dynamics and quantum chemical calculations of the 129Xe nuclear magnetic shielding. The chemical shift was calculated quantum chemically for a high number of snapshots obtained from molecular dynamics simulations of a system consisting of a xenon atom dissolved in a periodic box of benzene molecules. The authors sustain that this method has the advantage of avoiding the difficulty of parametrizing the chemical shift functions. Evaluating each configuration quantum mechanically, the response of the xenon atom to the environment details is obtained directly from quantum chemical calculations without any parametrization. The quantum chemical calculations of the 129Xe chemical shift were conducted using nonrelativistic density functional theory as well as relativistic Breit−Pauli perturbation corrections. The molecular dynamics simulations were carried out using a standard AMBER forcefield to model the benzene molecules, which uses Lennard-Jones potential sites to describe the nonbonded interactions. For xenon, a simple Lennard-Jones potential was used. Excellent agreement was found between theoretical and experimental results without the need of any particular fitting of the cross interaction potential between solvent and solute.
In the present work, we have investigated the liquid organization of linear, branched, and cyclic alkanes using atomic129Xe as a NMR probe. As previously explained, given the similarity of the behavior, in terms of size and intermolecular potential, between xenon and the n-alkanes,12 xenon−solvent intermolecular interactions should be very similar to those between solvent molecules, thus introducing minimum perturbation in the probed liquid structure. 129Xe chemical shifts have been experimentally determined for xenon dissolved in a total of 21 substances. In order to allow the comparison of the different solvents at similar thermodynamic conditions, the measurements were performed over a wide range of temperatures, from the melting point of the solvent up to 350 K, which is the maximum operating temperature of the experimental setup used. Additionally, in order to find links between the solvent structure within xenon’s first coordination sphere and the experimentally obtained chemical shifts, the solutions were studied by molecular dynamics simulation, using a well established atomistic force field to model the alkane solvents, the optimized potentials for liquid simulations (OPLS-AA),22 and an optimized Lennard-Jones potential for liquid xenon.23We have used these and other forcefields in a number of previous studies24−26 in which several thermodynamic properties for solutions of xenon in alkanes (Henry’s constants,
excess volumes, excess enthalpies, etc.) were calculated and compared with theoretical results and our own experimental data. Consequently, in this work, we have concentrated on obtaining structural information in terms of number, nature, orientation, and distance of the chemical groups surrounding the xenon atoms and relating this information to the experimental chemical shifts.
■
EXPERIMENTAL SECTIONXenon gas (99.995%, natural abundance) was purchased from Air Liquide and n-butane (99.95%) from Linde. n-Pentane (99%) and cyclohexane (99%) were obtained from Lab-Scan. Hexane (99.0%), heptane (99.5%), octane (99.0%), n-hexadecane (99%), 2,2-dimethylbutane (99%), 2,3-dimethylbu-tane (98%), 2-methylpen2,3-dimethylbu-tane (99+%), 3-methylpen2,3-dimethylbu-tane (99+ %), cycloheptane (98%), cyclooctane (99+%), and cyclodecane (95%) were purchased from Sigma-Aldrich. n-Nonane (98.5%) and n-tetradecane (99%) were supplied by BDH. n-Undecane (99.5%), n-tridecane (99.5%), and 2,2,4-trimethylpentane (99.5%) were purchased from Merck. 2,2-Dimethylpropane (99.99%) was obtained from Matheson and cyclopentane (99%) from Acros. All substances were used as received, without further purification.
The samples for the determination of 129Xe chemical shifts were prepared by bubbling xenon through the solvent for at least 1 min in a standard 5 mm NMR tube; the tube was then capped and sealed with Parafilm. For the reference, a standard 5 mm NMR tube wasfilled with xenon (which is denser than air), at atmospheric pressure, and capped in a similar way. All samples were prepared at room temperature, except in the case of 2,2-dimethylpropane and butane which were condensed to the NMR tube inside a water + ice + sodium chloride mixture at around−10 °C, with the xenon then bubbled through the condensed liquid; the NMR tubes for these samples were also equipped with a valve.
Two spectrometers were used in this work, a Bruker MSL 300 P and a Bruker Avance III 500 MHz; both were equipped with multinuclear probes for liquid samples in 5 mm tubes, and the spectra were recorded without spinning the sample. Radio frequency pulses with a duration of 5 μs, with an interpulse delay of 10 s, were used to record each free induction decay (FID). A sealed capillary glass tube filled with deuterated methanol was introduced in the sample tubes for the measurements with the 500 MHz spectrometer, in order to allow the use of a deuterium frequency lock; this procedure was not needed with the 300 MHz spectrometer. Between 20 and 200 scans were necessary, at each experimental point, to obtain spectra with good signal-to-noise ratios, and an exponential line broadening of 5 Hz was applied to the recorded FIDs. The spectrum of the reference sample was obtained in the beginning and at the end of each day of measurements to ensure that no drift occurred during the experiences.
The temperature of the NMR probes was controlled with digital controllers, connected to an electrical resistance as a heat source, and using a liquid nitrogen evaporator or a compressed airflow (according to the target temperature) as simultaneously the cold source and the thermostatic fluid. This system was calibrated (sample T vs set T) using a specially constructed platinum resistance thermometer (Pt100) mounted inside a NMR tube, which allowed not only the precise determination of temperature but also an estimate of the time necessary to achieve thermal equilibrium in the sample after a change in the set temperature, as well as of the temperature stability. Both the
accuracy and stability of the control system are expected to be of about 0.5 K.
Most of the analysis presented below relies on the knowledge of the liquid solvent densities. The densities of all n-alkanes except n-butane were calculated using the correlations of Cibulka,27the density of butane from a correlation of literature data by Bonifácio,28the densities of the four branched isomers of hexane from correlations in the book by Yaws,29the density of cyclodecane from McLure et al.,30and all the other branched and cyclic alkanes from the paper by Cibulka and Takagi.31In the few cases where the temperature of the NMR experiments exceeded the (lower) temperature limit of the used correlations, the densities below the limit were calculated using linear extrapolations.
■
SIMULATION DETAILSThe interaction between xenon and liquid alkanes was also studied by computer simulation: radial distribution functions were obtained for the coordination sphere of xenon in five linear alkanes (ethane, butane, hexane, undecane, and n-hexadecane), five branched alkanes (2,dimethylpropane, 2-methylpentane, 3-2-methylpentane, 2,2-dimethylbutane, and 2,3-dimethylbutane), and five cycloalkanes (cyclopentane, cyclo-hexane, cycloheptane, cyclooctane, and cyclodecane), using molecular dynamics. The OPLS-AA22force field was used to model all the hydrocarbons, whereas xenon was modeled as a single Lennard-Jones sphere with the parametersσ = 3.9478 Å and ε = 1.8945 kJ/mol, as proposed by Bohn et al.23 The adequacy of this forcefield to model solutions of xenon in n-alkanes has been previously examined in a number of studies, in which we have obtained Henry’s constants in close agreement with experimental data.24,28Cross interaction parameters were obtained using the geometric mean rule. All intramolecular vibrations and torsions were considered, except for the vibrations of bonds involving hydrogen atoms, which have been constrained to their equilibrium distances using the SHAKE algorithm.
The molecular dynamics simulations were performed using the DL_POLY Classic32code, with studied systems consisting of one xenon atom and between 40 and 150 solvent molecules, to which periodic boundary conditions were applied in all directions. The initial liquid box sizes were established according to the experimental densities. Systems were equilibrated in the NpT ensemble for 0.5 ns, and then 6 ns (for linear and branched alkanes) or 3 ns (for cycloalkanes) long production runs were performed to accumulate averages. For both runs, a time step of 2 fs was used.
A cutoff distance of 13 Å was used for both nonbonded Lennard-Jones and electrostatic potentials. The Ewald summation technique was used to account for the electrostatic interactions beyond the cutoff, and standard analytic tail corrections for the energy and virial were added. A neighbor list, with a radius of 14.3 Å, was used, which is updated around every 20 time steps.
Simulations were done at atmospheric pressure and, for n-alkanes and cyclon-alkanes, at the same solvent reduced temperature (Tr= 0.538). In the case of the branched isomers of hexane, their critical temperatures are very close to each other and a single temperature (273 K) was chosen. 2,2-Dimethylpropane was simulated at 260 K, corresponding to a reduced temperature of 0.599. In Table 1, the temperature and the number of solvent molecules for each simulation are collected. In all the simulations, temperature and pressure were
controlled by the Nosé−Hoover thermostat and barostat with coupling constants of 0.5 ps for temperature and 2.0 ps for pressure.
■
RESULTS AND DISCUSSIONThe chemical shift of a nucleus can be expressed33as the sum of the chemical shift in the isolated molecule, δ0, the contribution due to the bulk magnetic susceptibility of the sample, δb, and the chemical shift due to intermolecular interactions,δm(eq 1). The quantityδmis also named medium shif t.
δ=δ0+δb+δm (1)
In this work, since the concentration of xenon is always very low, δb can be considered only affected by the magnetic susceptibility of the solvent andδmonly due to xenon−solvent interactions (infinite dilution conditions). δ0, corresponding to the chemical shift of an isolated Xe atom, was taken as the reference (δ = 0); it was determined by measuring the chemical shift of129Xe at atmospheric pressure in a standard NMR tube and correcting to zero pressure using the known pressure dependence of the chemical shift.34The bulk susceptibility term (or correction, as it is often named) δb results from the difference in the intensity of the local magnetic field between the reference and experimental conditions, which is due to the secondaryfield generated by the electronic circulation in the molecules of the sample.35 It can be shown that, for a cylindrical sample with the axis parallel to the applied magnetic field, the bulk susceptibility correction depends on the volume susceptibilityχvof the solvent according to
δ = 4πχ
3 v
b (2)
The intermolecular term δm can be further decomposed into several terms:
δm=δassoc+ δa+ δw+δe+ δe2 (3)
where δassoc arises from strong specific intermolecular effects leading to supramolecular association, δa is the contribution from the magnetic anisotropy of solvent molecules,δwfrom the van der Waals forces between solute and solvent, δe from electrostatic interactions between solvent and solute permanent dipoles, and δe2 from the interactions between solvent permanent dipoles or multipoles and the solute induced dipole.
Since Xe is a spherical monatomic species and does not form molecular aggregates,δassocandδeare zero;δaandδe2are also negligible in the present work, since alkanes are nonpolar and magnetically isotropic. Hence, the 129Xe chemical shift is dominated by the intensity of the van der Waals forces between xenon and the solvent molecules.
To calculate the bulk magnetic susceptibility term in eq 1, it was assumed that the molar susceptibilityχmis a constant for a given substance; the volume susceptibility in eq 2 is then obtained by multiplying χmby the molar density. In terms of the mass densityρ,
χv =χ ρm· /M (4)
where M is the molar mass. Bulk magnetic susceptibilities were calculated for all the substances studied using tabulated values36 of χm, except in the case of cyclodecane where the molar susceptibility was linearly extrapolated from the smaller members of the cycloalkane series (cyclopentane to cyclo-octane).
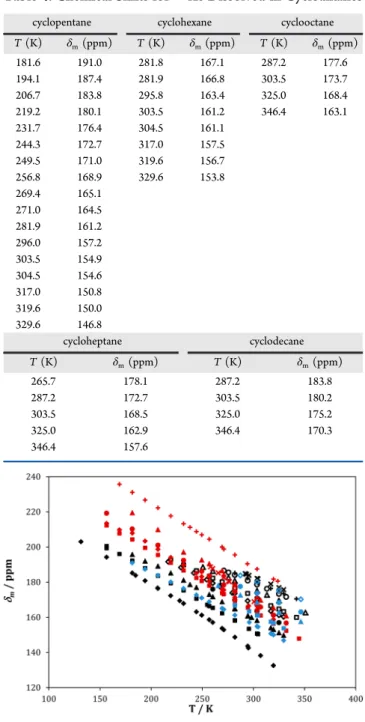
129Xe NMR spectra have been obtained, as a function of temperature, for solutions of xenon in 10 linear alkanes (butane, pentane, hexane, heptane, octane, nonane, undecane, tridecane, tetradecane, and hexadecane), 6 branched alkanes (dimethylpropane, 2-methylpentane, 3-methylpentane, 2,2-dimethylbutane, 2,3-2,2-dimethylbutane, and 2,2,4-trimethylpen-tane), and 5 cycloalkanes (cyclopentane, cyclohexane, cyclo-heptane, cyclooctane, and cyclodecane). The chemical shifts were measured, for almost all solutions, between the melting point of the solvent and the lowest of 350 K or the normal boiling point. The medium shifts, δm, as a function of temperature, corrected for the pressure of Xe in the reference tube and for the bulk susceptibility of the solvent (vide. eqs 1 and 2), are reported in Tables 2−4 and plotted in Figure 1.
The 129Xe medium shifts in alkanes range from 130 to 240 ppm and decrease linearly with temperature in all systems. For the linear and cyclic alkanes, the Xe chemical shift increases with the size of the molecule and, when comparing solvents with the same number of carbons, the chemical shift follows the order linear < cyclic < branched. However, as previously explained, different alkanes at the same temperature can be in very different thermodynamic conditions. As previously said, at room temperature, hexadecane is a dense liquid with a very low vapor pressure, whereas butane is above its normal boiling point, with a 25% lower mass density. Hence, the interactions of xenon with the different alkanes should not be compared at the same temperature but at similar thermodynamic conditions. Afirst attempt is made in Figure 2, where the Xe chemical shift is plotted as a function of the reduced temperature of each alkane. As can be seen, the Xe chemical shift in all n-alkanes now practically falls in one same line. We have included data for ethane and propane from ref 38. Both solvents seem to correlate well with the behavior displayed by the other n-alkanes. Similarly, all studied cycloalkanes also seem to fall on the same line which, however, is different from that of the n-alkanes.
The experimental Xe chemical shift can be viewed as the time average of the pairwise additive intermolecular shielding functionσs and can be written as37
∫
∫
∫
δ = πρ Ωσ Ω Ω Ω ∞ r r r g r 4 d d ( , ) ( , )/ d m 0 2 s (5)whereρ is the solvent density, r is the distance from the xenon atom,Ω are the angular variables describing the xenon−solvent Table 1. Temperatures (T) and Number of Solvent
Molecules (N) Used in Simulations
solvent T (K) N n-butane 230 150 n-hexane 273 100 n-undecane 344 60 n-hexadecane 389 40 2,2-dimethylpropane 260 120 2,2-dimethylbutane 273 100 2,3-dimethylbutane 273 100 2-methylpentane 273 100 3-methylpentane 273 100 cyclopentane 275 150 cyclohexane 298 120 cycloheptane 325 110 cyclooctane 348 100 cyclodecane 398 80
molecular orientation, and g(r, Ω) is the xenon−solvent pair distribution function, which describes the local arrangement of the solvent molecules around the xenon atom. Equation 5 shows that the chemical shift depends on the number, nature, distance and orientation of the chemical groups within xenon’s coordination sphere. The number/distance of groups can be quantified by the density of the solvent. The linear decrease of the chemical shift with temperature for each compound seems to support that this dependence is indeed a dominant factor. This also suggests that the data should be plotted as a function of the solvent density in order to compare different solvents. However, an appropriate density scale should be used which allows comparing different systems at similar thermodynamic states. Mass or molar densities are obviously not good choices, as the studied solvents span over a large range of molecular sizes (and masses), from butane to hexadecane. Alternative convenient scales are mean molar densities of the relevant
chemical groups making up the solvent molecules. These can be calculated from the solvent mass/molar density assuming a uniform distribution of the groups throughout the liquid.
The 129Xe chemical shifts are represented in Figure 3 as a function of the mean molar density of carbon atoms in linear and cyclic solvents. This allows comparing the interactivity of the different alkane segments (in this case CH2 and CH3) toward xenon. This comparison assumes that the local density of the solvent in the vicinity of xenon atoms is equal to the mean bulk density. It also assumes that the dissolved xenon atoms are randomly distributed within the solvent; i.e., no specific locations are preferred by the solute. Branched alkanes were omitted in this representation for the sake of simplicity.
Two striking features are immediately seen in this plot: (i) cycloalkanes now form a separate group from the n-alkanes; (ii) the n-alkanes display a series of almost parallel curves and, at constant segment density, the chemical shift decreases with the Table 2. Chemical Shifts for129Xe Dissolved in Linear Alkanes
butane hexane octane undecane tridecane
T (K) δm(ppm) T (K) δm(ppm) T (K) δm(ppm) T (K) δm(ppm) T (K) δm(ppm) 131.4 203.0 181.6 195.8 216.7 191.6 250.6 188.6 271.0 186.6 156.5 194.2 194.1 192.0 229.2 188.3 260.3 186.3 275.6 185.5 181.6 185.2 206.7 189.2 241.8 185.3 275.6 182.6 281.8 184.1 184.9 183.8 219.2 185.2 254.3 181.4 281.8 180.8 294.5 180.9 194.1 180.8 231.7 181.1 260.3 179.4 303.5 175.1 303.5 178.7 206.4 176.7 238.0 178.7 266.9 177.7 313.3 172.8 313.3 176.2 206.7 176.4 244.3 177.0 279.4 173.9 325.0 169.6 325.0 173.3 219.1 172.3 256.8 173.0 281.8 173.6 350.9 162.7 332.1 171.6 228.0 169.5 260.3 171.7 294.3 169.4 231.7 167.9 269.4 168.9 303.5 167.3 244.3 163.1 281.8 165.2 304.5 166.8 249.5 161.2 281.9 164.8 317.0 163.6 256.8 158.6 294.3 160.7 325.0 161.1 260.3 157.1 294.6 161.0 329.6 160.3 269.4 153.7 298.2 160.0 271.0 152.9 303.5 158.2 281.9 148.7 317.0 154.0 294.5 143.6 319.6 153.1 295.1 142.5 325.0 151.2 307.0 138.2 329.6 149.8 319.5 132.6
pentane heptane nonane tetradecane hexadecane
T (K) δm(ppm) T (K) δm(ppm) T (K) δm(ppm) T (K) δm(ppm) T (K) δm(ppm) 156.5 199.4 260.3 176.0 219.2 193.1 281.8 185.2 292.0 184.8 156.5 200.5 281.8 169.9 231.7 189.8 282.0 185.1 292.6 184.7 169.0 196.1 303.5 163.4 244.3 186.6 294.3 182.3 293.2 184.5 181.6 192.2 325.0 157.0 256.8 183.4 303.5 179.9 295.7 183.9 194.1 187.9 260.3 182.3 304.5 179.6 303.5 182.1 206.7 183.6 269.4 180.2 317.0 176.4 304.5 181.9 219.2 179.4 281.8 176.5 325.0 174.6 317.0 178.9 231.7 175.3 281.9 176.9 329.6 173.5 325.0 176.9 244.3 170.6 294.3 173.6 342.1 170.5 329.6 175.7 254.9 167.2 303.5 170.6 256.8 166.4 304.5 169.9 260.3 165.4 317.0 166.6 269.4 162.3 325.0 164.7 281.8 158.3 329.6 163.3 281.9 158.1 342.1 159.9 295.6 153.4 303.5 150.8 304.5 150.4
increase of chain length (higher methylene proportion). This indicates that methyl groups are more interactive than methylene groups, since the solvents with higher proportion of the former induce higher Xe chemical shifts. As it will be seen, the results for the branched alkanes corroborate this, since these compounds display higher chemical shifts than those for the corresponding n-alkanes. The low shifts displayed by cycloalkanes are also consistent with a higher interactivity of the methyl group. This is an expectable result, since the CH3group has an additional interactive center when compared with CH2. Furthermore, these findings are in agreement with the conclusions of Luhmer and Bartik.17
The regular change of chemical shift in n-alkanes as the proportion of CH3/CH2changes, as well as the linear variation with temperature for each alkane, allows the estimation of the shift that would be observed in an alkane formed exclusively by CH2segments, e.g., molten polyethylene, or exclusively by CH3 segments, ethane. This was obtained through a multilinear
regression of the 129Xe medium shifts in all studied linear alkanes as a function of the density of CH2 and CH3. The resulting correlation (δm/ppm = 4.464ρ(CH2) + 6.401ρ(CH3) − 72.960), which reproduces the experimental medium shifts with a standard deviation of 0.4 ppm, was then used to calculate the chemical shifts in an all-CH2and an all-CH3alkane, which are represented in Figure 3 by the dashed and the dotted lines, respectively. As expected, the line for the alkane formed exclusively by CH2segments is located at considerably lower Table 3. Chemical Shifts for129Xe Dissolved in Branched
Alkanes
2,2-dimethylpropane 2-methylpentane 3-methylpentane T (K) δm(ppm) T (K) δm(ppm) T (K) δm(ppm) 258.1 188.7 156.5 213.5 156.5 212.3 260.3 187.8 169.0 209.8 169.0 207.8 265.7 185.2 181.6 207.9 181.6 204.3 271.0 182.7 194.1 203.4 194.1 199.6 275.6 180.6 206.7 198.7 206.7 195.5 276.4 180.2 219.2 194.0 219.2 191.1 281.8 177.7 231.7 189.7 231.7 186.7 300.7 168.9 244.3 185.1 244.3 182.4 249.5 183.1 249.5 180.7 256.8 180.5 256.8 178.1 269.4 176.0 269.4 173.8 271.0 175.6 271.0 173.2 281.9 171.4 281.9 169.6 295.3 166.5 294.5 165.5 303.5 164.4 303.5 162.2 319.6 158.8 307.0 161.1 319.5 156.4 319.6 156.6 332.1 152.4 344.6 147.9 2,2-dimethylbutane 2,3-dimethylbutane 2,2,4-trimethylpentane T (K) δm(ppm) T (K) δm(ppm) T (K) δm(ppm) 181.6 219.5 156.5 219.3 169.0 235.7 206.7 209.9 181.6 210.3 181.6 231.2 231.7 197.1 206.7 201.0 194.1 226.8 249.5 192.6 231.7 192.4 206.7 222.3 256.8 190.5 249.5 186.2 219.2 217.7 269.4 186.5 256.8 183.5 231.7 213.2 271.0 184.2 271.0 178.4 238.0 211.2 281.9 179.0 281.9 174.7 244.3 208.8 303.5 171.6 303.5 166.9 249.5 207.0 307.0 169.8 307.0 165.8 256.8 204.4 319.6 165.3 319.6 161.3 269.4 200.0 332.1 160.9 332.1 156.7 271.0 198.8 281.9 195.5 294.2 190.4 303.5 187.5 319.6 181.7 323.8 180.6
Table 4. Chemical Shifts for129Xe Dissolved in Cycloalkanes
cyclopentane cyclohexane cyclooctane
T (K) δm(ppm) T (K) δm(ppm) T (K) δm(ppm) 181.6 191.0 281.8 167.1 287.2 177.6 194.1 187.4 281.9 166.8 303.5 173.7 206.7 183.8 295.8 163.4 325.0 168.4 219.2 180.1 303.5 161.2 346.4 163.1 231.7 176.4 304.5 161.1 244.3 172.7 317.0 157.5 249.5 171.0 319.6 156.7 256.8 168.9 329.6 153.8 269.4 165.1 271.0 164.5 281.9 161.2 296.0 157.2 303.5 154.9 304.5 154.6 317.0 150.8 319.6 150.0 329.6 146.8 cycloheptane cyclodecane T (K) δm(ppm) T (K) δm(ppm) 265.7 178.1 287.2 183.8 287.2 172.7 303.5 180.2 303.5 168.5 325.0 175.2 325.0 162.9 346.4 170.3 346.4 157.6
Figure 1.129Xe medium shifts in the studied systems, as a function of temperature. n-Alkanes are represented by black symbols: butane (◆), pentane (■), hexane (▲), heptane (●), octane (◇), nonane (□), undecane (△), tridecane (○), tetradecane (+), hexadecane (×); cycloalkanes in blue: cyclopentane (◆), cyclohexane (■), cyclo-heptane (▲), cyclooctane (●), cyclodecane (◇); branched alkanes in red: 2,2-dimethylpropane (×), 2-methylpentane (◆), 3-methylpen-tane (■), 2,2-dimethylbutane (▲), 2,3-dimethylbutane (●), 2,2,4-trimethylpentane (+).
shifts when compared with n-hexadecane but still at higher shifts when compared with the smallest cycloalkane, which is cyclopentane. On the other hand, the line for the all-CH3 alkane can be compared with the experimental Xe chemical shift in ethane at 23°C, obtained by Lim et al.38(green circle in Figure 3). As can be seen, ethane seems to be more interactive than predicted by the correlation. Using the same method, we have calculated the Xe chemical shift that would be observed in a solvent formed by a CH2group and two CH3groups, which corresponds to propane (dot-dashed line in Figure 3). In this case, the prediction is able to accurately reproduce the Xe chemical shift in liquid propane at 23°C.38In conclusion, the interactivity of propane toward xenon can be predicted from the behavior of higher n-alkanes, whereas ethane doesn’t seem to follow the same trend. Formed by two methyl groups only, the ethane molecule does not display the zigzag structure that characterizes the most stable conformation of higher n-alkanes. Consequently, the cross diameter of the ethane molecule is smaller than that of the longer n-alkanes, probably leading to a higher local concentration of CH3groups around xenon. This
behavior is not surprising, as ethane (like methane) is known to deviate slightly from the correlations of the thermodynamic properties of n-alkanes. As mentioned in the Introduction, Luhmer and Bartik17observed that thefirst members of each of the studied types of solvents deviate from the behavior displayed by the other members of the series. We now show that this anomaly extends to the n-alkanes.
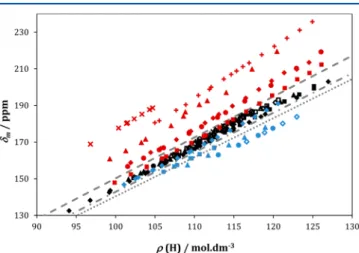
Also revealing is the fact that the curves for cycloalkanes do not superimpose, displaying different chemical shifts at the same CH2density, in spite of all being formed by the same CH2 units. This is a clear indication that in cycloalkanes the CH2 groups do not contribute equally to the Xe chemical shift. Since their chemical nature is the same, we are led to the conclusion that some of the groups are less accessible to the xenon atoms in solution. Again, this was observed and commented by Luhmer and Bartik,17 although based on data at a single temperature. The effect is also seen in Figure 4 where the Xe
chemical shift is now plotted as a function of the mean molar density of hydrogen atoms. As before, the Xe chemical shift is not the same in all cycloalkanes, decreasing with chain length. However, it is also seen that these differences become smaller as the chain length increases. The longest cycloalkanes, cyclooctane and cyclodecane, display essentially the same chemical shift. This can be explained by the differences in the molecular structure of the cycloalkanes. Cyclopentane has a quasi-planar geometry, with all hydrogen atoms pointing “outwards”, equally accessible to interacting with xenon. The longer compounds adopt a globular conformation, in which an increasing number of hydrogen atoms are located“inside” the molecule and thus less accessible to xenon. This effect should become essentially constant after a particular chain length. Also significant is the fact that the Xe chemical shift of cyclopentane is, in this representation, similar to that of the lower n-alkanes, n-butane and n-pentane.
Figure 4 displays another remarkable feature. In this representation, the Xe chemical shift in n-alkanes (hence, the xenon−alkane interactions) is very similar for all solvents, showing that the interactions between xenon and hydrogen atoms are equivalent irrespectively of being part of a CH2or CH3group. Given the molecular structure of the n-alkanes, this is not unexpected. To some extent, this representation is comparable to that of Figure 2, where the Xe chemical shift was plotted as a function of the reduced temperature of the solvent.
Figure 2.129Xe medium shifts in the studied liquids, as a function of the reduced temperature of the solvent. The green symbols represent the Xe chemical shifts in ethane (●) and propane (■) from ref 38. Remaining symbols as in Figure 1.
Figure 3.129Xe medium shifts in linear and cyclic alkanes, as a function of the mean molar density of carbon atoms of the solvent. The symbols represent experimental data, legend as in the previousfigures. The lines represent the estimated 129Xe medium shifts for solvents: formed exclusively by CH3 groups (dotted), formed exclusively by CH2groups (dashed), with a 2/1 proportion between CH3and CH2 groups (dot-dashed).
Figure 4.Xe medium shifts in linear alkanes, branched alkanes, and cycloalkanes, as a function of the mean hydrogen molar density. Legend as in the previousfigures.
Figure 4 also shows that, at a constant mean molar density of hydrogen, the longer chains display a higher chemical shift, although the differences are not very large (less than 6 ppm higher for n-hexadecane than for n-butane). These differences can be the result of two effects: (i) A temperature effect: at constant density, the change of the chemical shift with temperature can be of the order of +0.1 ppm/K.39 (ii) The differences of xenon chemical shift within the n-alkanes at a constant density of hydrogen atoms can be an indication that xenon is not randomly distributed throughout the liquid. In fact, it is reasonable to expect that the xenon atoms might tend to be located in cavities at the end of the n-alkane chains, surrounded by a larger number of CH3 groups than in a random cavity, in which the ratio of CH2/CH3would reflect its molecular proportion.
The Xe chemical shifts in branched alkanes are also shown in Figure 4. As can be seen, for the branched compounds, the chemical shifts are consistently higher than those in the n-alkanes. The less interactive is 3-methylpentane, where methyl groups are all well separated, followed by 2-methylpentane and 2,3-dimethylbutane, displaying practically the same chemical shift, 2,2-dimethylbutane, 2,2,4-trimethylpentane (iso-octane), and 2,2-dimethylpropane (neo-pentane). The interactivity seems to follow the global number/proportion of methyl groups in the solvent molecule and the number/proportion of methyl groups connected to the same carbon atom, which in most cases corresponds to having more CH3 groups in the terminal position. The limit case is neo-pentane, which exposes four CH3 groups to xenon. Again, this trend can be an indication that xenon is not randomly distributed throughout the liquid but preferentially located in cavities in which it is surrounded by as many CH3 groups as possible. Further interpretation of these results is difficult without looking at the effect of the individual molecular structures of each solvent.
In order to establish links between the observed chemical shifts and the structure of xenon’s coordination shell (in terms of number, distance, and arrangement of groups), we have performed molecular dynamics simulations to obtain the radial distribution functions [gαβ(r)] between each atomic type of the various solvents (H, C in CH3, C in CH2, etc.) and xenon. The simulations were made roughly at the same solvent reduced temperature, as described in the previous section.
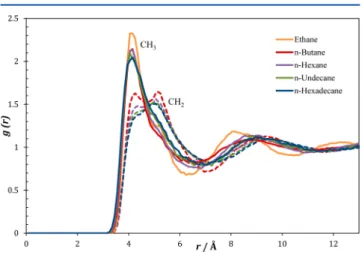
In Figure 5, Xe−CH2 and Xe−CH3 radial distribution functions are shown for a number of n-alkanes. As can be seen,
the Xe−CH3 peaks are very similar for all the n-alkanes. However, that of ethane is considerably more intense than the others, in agreement with the higher Xe chemical shift in ethane, when compared with that expected from the behavior displayed by the other n-alkanes. Also, interestingly, it can be seen that CH3groups can approach xenon at closer distances, in spite of their larger volume. Finally, at short distances, Xe− CH3peaks are systematically more intense than Xe−CH2, and the intensity of the Xe−CH2 first peak decreases with the increase of chain length. This seems to confirm that the xenon atoms have an enhanced tendency to be located in the vicinity of methyl groups and that this tendency increases with chain length.
To further check this hypothesis, we have integrated the radial distribution functions, thus obtaining the number of interaction sites (N) of each type in a coordination shell around the reference site as
∫
π ρ = N 4 g r r( ) r r 2 1 2 (6)where r1and r2are the inner and outer radii of the coordination shell andρ is the segment bulk density. Given the uncertainty in defining the limits of the coordination sphere, we have calculated the number of sites of a given group around xenon, as a function of the distance from its center. This is shown in Figure 6 for the CH3 and CH2 groups of n-butane around
xenon. As can be seen, although the number of CH3and CH2 groups in n-butane is the same, there is a clear prevalence of CH3in the coordination sphere of xenon when small radii are considered (up to 5.3 Å), with the inverse being true for intermediate radii (from 5.3 Å to around 7.5 Å).
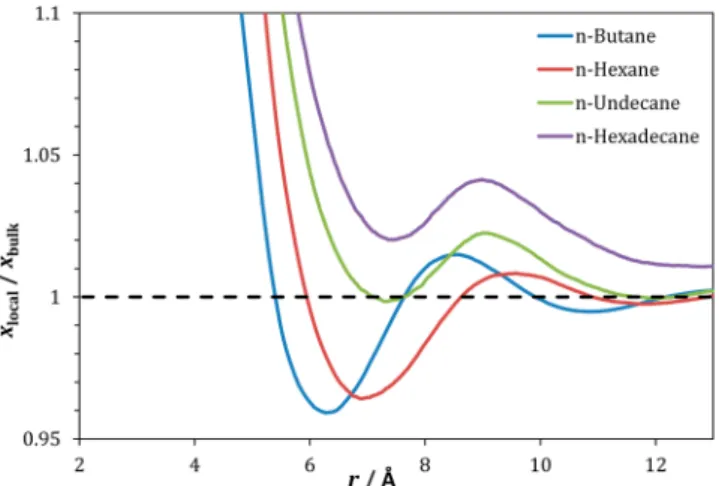
In Figure 7, the ratio between the local molar fraction of CH3 groups around xenon and their bulk molar fraction, as a function of the radius r of the coordination sphere, is shown for all the n-alkanes studied. As can be seen, the fraction of CH3 groups is always higher than the bulk value at low r, tending to the bulk value for large r. In the case of n-butane and n-hexane, the fraction of CH3 groups becomes smaller than the bulk fraction for intermediate values of r, but in the case of the longest n-alkanes (n-undecane and n-hexadecane), the fraction
Figure 5.Radial distribution functions between CH3(solid lines) or CH2carbons (dashed) and xenon atom in linear alkanes.
Figure 6.Number of carbon sites of methyl (black) and methylene groups (red) around xenon as a function of distance for n-butane.
of CH3is always larger than the global value at all r. This is a clear indication of a local enrichment of CH3 around xenon over the global composition at short distances from xenon and that this enrichment is more pronounced as the n-alkane chain length increases.
In Figure 8, the Xe−H and Xe−C radial distribution functions are shown for the methylene group in all studied
cycloalkanes. It is immediately seen that, in spite of the identical nature of the groups in all the molecules, the curves do not superimpose. Both the Xe−H and Xe−C curves are very similar in shape for all the systems but display different intensities. The Xe−C curves present two peaks in the first coordination sphere (implying carbon atoms at two different mean distances from xenon); thefirst one decreases progressively with the increasing chain length, whereas the decreasing trend of the second peak is less evident. For cyclodecane, for example, the second peak is already more intense than the first one. All of these observations reinforce the idea that the CH2groups in different cycloalkanes are not equivalent in terms of accessibility to xenon and justify the experimentally observed Xe chemical shifts. From the trend presented by radial distribution functions, we cannot conclude that the methylene groups from cycloalkanes become more similar as the chain length increases.
The radial distribution functions for xenon in branched alkanes are shown in Figures 9 (2-methylpentane and 3-methylpentane) and 10 (2,2-dimethylbutane, 2,3-dimethylbu-tane, and 2,2-dimethylpropane).
Regarding 2-methylpentane and 3-methylpentane, it should be noted that these molecules are positional isomers: their molecular structures only differ in the position of the CH3and CH groups. As can be seen in Figure 9, the gαβ(r) curves for each group are very similar in both isomers, in terms of shape, position, and intensity, except for that of the CH group whose maximum is less intense and appears at higher distance for 3-methylpentane than for 2-3-methylpentane. The radial distribu-tion funcdistribu-tions tell us that, when the methyl group is attached to the central carbon atom (position 3), the CH group becomes less accessible to interact with xenon. This can explain the lower Xe chemical shift in 3-methylpentane when compared to 2-methylpentane.
A similar effect seems to be observed in Figure 10, where the gαβ(r) curves for 2,2-dimethylbutane and 2,3-dimethylbutane are compared. The former has a quaternary carbon atom
Figure 7. Ratio between the local molar fraction of CH3 groups around xenon and the bulk molar fraction, as a function of distance in linear alkanes.
Figure 8.Radial distribution functions between carbon (solid lines) or hydrogen atoms (dashed) and xenon in cycloalkanes.
Figure 9.Radial distribution functions between xenon and primary carbon (CH3, solid lines), secondary (CH2, dotted), tertiary (CH, long dashed), or hydrogen atoms (short dashed) in 2-methylpentane (black) and 3-methylpentane (red).
Figure 10.Radial distribution functions between xenon and primary carbon (CH3, solid lines), secondary (CH2, dotted), tertiary (CH, dot-dashed), quaternary (C, long dot-dashed), or hydrogen atoms (short dashed) in 2,2-dimethylpropane (black), 2,2-dimethylbutane (red), and 2,3-dimethylbutane (green).
adjacent to a methylene group, while the latter has two tertiary CH groups and no methylene groups. The Xe−H and Xe−CH3 peaks are identical for both solvents, whereas the peak for the quaternary carbon atom for 2,2-dimethylbutane is significantly more intense (and shifted to slightly lower distances) than the CH peak for 2,3-dimethylbutane. Additionally, 2,2-dimethylbu-tane has a methylene group whose g(r) curve displays three peaks, thefirst one at relatively small distances from xenon. The higher Xe chemical shift in 2,2-dimethylbutane can be attributed to the presence of this CH2 group and the higher accessibility of the quaternary carbon atom, in comparison with the two CH groups in 2,3-dimethylbutane.
Finally, 2,2-dimethylpropane (neo-pentane) and dime-thylbutane are also compared in Figure 10. While 2,2-dimethylpropane has four methyl groups bonded to a quaternary carbon atom, in 2,2-dimethylbutane, one of these has been replaced by an ethyl group. In other words, 2,2-dimethylbutane has an additional methylene group (located between the quaternary carbon atom and a methyl group). This will be sufficient to lower the Xe chemical shift of 2,2-dimethylbutane when compared to 2,2-dimethylpropane, as the additional methylene group is less interactive than the methyl. This is indeed found experimentally and corresponds to the same effect found in the n-alkane series. Additionally, the g(r) curves show that the peak for the quaternary carbon atom for dimethylbutane is less intense than that for 2,2-dimethylpropane. The extra CH2group in 2,2-dimethylbutane reduces the probability of xenon approaching the quaternary carbon atom. The Xe−H and Xe−CH3peaks are very similar for both solvents.
■
CONCLUSIONSThe liquid structure of linear, branched, and cyclic alkanes was studied using129Xe as a NMR probe.129Xe chemical shifts have been experimentally determined for xenon dissolved in a total of 21 alkanes (linear, branched, and cyclic). In order to allow the comparison of the different solvents at similar thermody-namic conditions, the measurements were performed over a wide range of temperatures, from the melting point of the solvent up to 350 K. The results were rationalized in terms of the density, nature, and organization of the chemical groups within xenon’s coordination sphere. The analysis is able to interpret previous results in the literature for ethane and propane at very different experimental conditions. For linear alkanes, the interactivity between xenon and each solvent is seen to depend on the number and proportion of methyl/ methylene groups. It is clearly shown that methyl is the most interactive group. For branched alkanes, the interactivity depends also on the position of the methyl groups. For linear and branched alkanes as solvents, the results suggest that xenon is not randomly distributed throughout the liquid, being more probably located in cavities near the end of solvent molecules, which results in an enrichment of CH3 around xenon in comparison with bulk proportion. The results from molecular dynamics simulations seem to confirm this hypothesis. It is also shown that cycloalkanes are less interactive than a hypothetical alkane composed exclusively by methylene groups. This is an indication that CH2 groups in cycloalkanes are not all equivalent in terms of interaction, some of them being less accessible to xenon. Again, the simulation results seem to confirm this assumption. In the case of branched alkanes, the structure of xenon’s coordination spheres obtained by simulation helps to rationalize the experimentally observed
chemical shifts in terms of the different accessibility of xenon to CH groups and quaternary carbons in each solvent.
■
AUTHOR INFORMATIONCorresponding Author
*E-mail: efilipe@ist.utl.pt. Phone: +351218419261.
Notes
The authors declare no competingfinancial interest.
■
ACKNOWLEDGMENTSWe would like to thank Dr. Teresa G. Nunes (CQE, IST) for her invaluable help and useful discussions. Her expertise was essential when setting up thefirst NMR experiments. We also acknowledge the Portuguese National NMR Network (RNRMN), supported with funds from “Fundação para a Ciência e a Tecnologia” (FCT, Portugal). P.M. wishes to thank Fundação para a Ciência e Tecnologia for financial support through Grant No. SFRH/BPD/81748/2011.
■
REFERENCES(1) Lynch, C., III; Baum, J.; Tenbrinck, R. Xenon Anesthesia. Anesthesiology 2000, 92, 865−868.
(2) Pollack, G. L. Solubility of Xenon in Normal-Alkanes− Normal-Pentane through Normal-Hexadecane. J. Chem. Phys. 1981, 75, 5875− 5879.
(3) Gerken, M.; Schrobilgen, G. J. The Impact of Multi-NMR Spectroscopy on the Development of Noble-Gas Chemistry. Coord. Chem. Rev. 2000, 197, 335−395.
(4) Pollack, G. L. Why Gases Dissolve in Liquids. Science 1991, 251, 1323−1330.
(5) Lim, Y.-H.; King, A. D., Jr. NMR Chemical Shifts of 129Xe Dissolved in Liquid n-Alkanes and Their Mixtures. J. Phys. Chem. 1993, 97, 12173−12177.
(6) Romanenko, K. V. Xe-129 NMR Studies of Xenon Adsorption. Annu. Rep. NMR Spectrosc. 2010, 69, 1.
(7) Raftery, D. Xenon NMR Spectroscopy. Annu. Rep. NMR Spectrosc. 2006, 57, 205−270.
(8) Ratcliffe, C. I. Xenon NMR. Annu. Rep. NMR Spectrosc. 1998, 36, 123−221.
(9) Dias, L. M. B.; Filipe, E. J. M.; McCabe, C.; Calado, J. C. G. Thermodynamics of Liquid (Xenon + Methane) Mixtures. J. Phys. Chem. B 2004, 108, 7377−7381.
(10) Filipe, E. J. M.; Gomes de Azevedo, E. J. S.; Martins, L. F. G.; Soares, V. A. M.; Calado, J. C. G.; McCabe, C.; Jackson, G. Thermodynamics of Liquid Mixtures of Xenon with Alkanes: (Xenon plus Ethane) and (Xenon plus Propane). J. Phys. Chem. B 2000, 104, 1315−1321.
(11) Filipe, E. J. M.; Martins, L. F. G.; Calado, J. C. G.; McCabe, C.; Jackson, G. Thermodynamics of Liquid Mixtures of Xenon with Alkanes: (Xenon plus n-Butane) and (Xenon plus Isobutane). J. Phys. Chem. B 2000, 104, 1322−1325.
(12) Filipe, E. J. M.; Dias, L. M. B.; Calado, J. C. G.; McCabe, C.; Jackson, G. Is Xenon an“Ennobled” Alkane? Phys. Chem. Chem. Phys. 2002, 4, 1618−1621.
(13) Miller, K. W.; Reo, N. V.; Schoot Uiterkamp, A. J. M.; Stengle, D. P.; Stengle, T. R.; Williamson, K. L. Xenon NMR − Chemical-Shifts of a General Anesthetic in Common Solvents, Proteins, and Membranes. Proc. Natl. Acad. Sci. U.S.A. 1981, 78, 4946−4949.
(14) Stengle, T. R.; Reo, N. V.; Williamson, K. L. Nuclear Magnetic Resonance Solvent Shifts of Xenon. A Test of the Reaction Field Model. J. Phys. Chem. 1981, 85, 3772−3775.
(15) Walton, J. H.; Miller, J. B.; Roland, C. M. Reaction Field Model with Free Volume for the NMR Chemical Shift of129Xe Dissolved in Organic Solvents. Appl. Magn. Reson. 1995, 8, 535−547.
(16) Luhmer, M.; Dejaegere, A.; Reisse, J. Interpretation of the Solvent Effect on the Screening Constant of Xe-129. Magn. Reson. Chem. 1989, 27, 950−952.
(17) Luhmer, M.; Bartik, K. Group Contribution Analysis of Xenon NMR Solvent Shifts. J. Phys. Chem. A 1997, 101, 5278−5283.
(18) Sears, D. N.; Jameson, C. J. The Xe Shielding Surfaces for Xe Interacting with Linear Molecules and Spherical Tops. J. Chem. Phys. 2004, 121, 2151−2157.
(19) Yuan, H.; Murad, S.; Jameson, C. J.; Olson, J. D. Molecular Dynamics Simulations of Xe Chemical Shifts and Solubility in n-Alkanes. J. Phys. Chem. C 2007, 111, 15771−15783.
(20) Yuan, H.; Jameson, C. J.; Gupta, S. K.; Olson, J. D.; Murad, S. Prediction of Henry’s Constants of Xenon in Cyclo-Alkanes from Molecular Dynamics Simulations. Fluid Phase Equilib. 2008, 269, 73− 79.
(21) Standara, S.; Kulhánek, P.; Marek, R.; Horníček, J.; Bouř, P.; Straka, M. Simulations of129Xe NMR Chemical Shift of Atomic Xenon Dissolved in Liquid Benzene. Theor. Chem. Acc. 2011, 129, 677−684. (22) Jorgensen, W. L.; Maxwell, D. S.; Tirado-Rives, J. Development and Testing of the OPLS All-Atom Force Field on Conformational Energetics and Properties of Organic Liquids. J. Am. Chem. Soc. 1998, 118, 11225−11236.
(23) Bohn, M.; Lago, S.; Fischer, J.; Kohler, F. Excess Properties of Liquid Mixtures from Perturbation Theory: Results for Model Systems and Predictions for Real Systems. Fluid Phase Equilib. 1985, 23, 137− 151.
(24) Bonifácio, R. P.; Filipe, E. J. M.; McCabe, C.; Costa Gomes, M. F.; Pádua, A. A. H. Predicting the Solubility of Xenon in n-Hexane and n-Perfluorohexane: a Simulation and Theoretical Study. Mol. Phys. 2002, 100, 2547−2553.
(25) Bonifácio, R. P. M. F.; Martins, L. F. G.; McCabe, C.; Filipe, E. J. M. On the Behavior of Solutions of Xenon in Liquid n-Alkanes: Solubility of Xenon in n-Pentane and n-Hexane. J. Phys. Chem. B 2010, 114, 15897−15904.
(26) Martins, L. F. G.; Carvalho, A. J. P.; Ramalho, J. P. P.; Filipe, E. J. M. Excess Thermodynamic Properties of Mixtures Involving Xenon and Light Alkanes: A Study of Their Temperature Dependence by Computer Simulation. J. Phys. Chem. B 2011, 115, 9745−9765.
(27) Cibulka, I. Saturated Liquid Densities of 1-Alkanols from C1to C10 and n-Alkanes from C5 to C16: A Critical Evaluation of Experimental Data. Fluid Phase Equilib. 1993, 89, 1−18.
(28) Bonifácio, R. P. M. F. Ph.D. Thesis, Instituto Superior Técnico, Lisboa, Portugal, 2003.
(29) Yaws, C. L. Thermophysical Properties of Chemicals and Hydrocarbons; William Andrew: Norwich, NY, 2008.
(30) McLure, I. A.; Barbarin-Castillo, J. M. Density of Cyclodecane from 25 to 192°C. J. Chem. Eng. Data 1985, 30, 253−254.
(31) Cibulka, I.; Takagi, T. P-ρ-T Data of Liquids: Summarization and Evaluation. 6. Nonaromatic Hydrocarbons (Cn, n≥ 5) except n-Alkanes C5to C16. J. Chem. Eng. Data 1999, 44, 1105−1128.
(32) Smith, W.; Forester, T. R.; Todorov, I. T. The DL_POLY Classic User Manual; Daresbury Laboratory: U.K., 2012.
(33) Buckingham, A. D.; Schaefer, T.; Schneider, W. G. Solvent Effects in Nuclear Magnetic Resonance Spectra. J. Chem. Phys. 1960, 32, 1227−1233.
(34) Jameson, A. K.; Jameson, C. J.; Gutowsky, H. S. Density Dependence of129Xe Chemical Shifts in Mixtures of Xenon and Other Gases. J. Chem. Phys. 1970, 53, 2310−2321.
(35) Gil, V. M. S.; Geraldes, C. F. G. C. Ressonância Magnética Nuclear - Fundamentos, Métodos e Aplicações; Fundação Calouste Gulbenkian: Lisboa, Portugal, 1987.
(36) Lide, D. L., Ed. CRC Handbook of Chemistry and Physics, 87th ed.; Taylor and Francis: Boca Raton, FL, 2007.
(37) Gray, C. G.; Gubbins, K. E. Theory of Molecular Fluids Vol.1; Clarendon Press: Oxford, U.K., 1984.
(38) Lim, Y. H.; Nugara, N. E.; King, A. D. NMR Chemical Shifts of Xenon-129 in Liquid Carbon Dioxide, Nitrous Oxide, Ethane, and Propane at 23°C. J. Phys. Chem. 1993, 97, 8816−8819.
(39) Kanegsberg, E.; Pass, B.; Carr, H. Y. Temperature and Density Dependence of the Local Magnetic Field in Dense Xenon Gas. Phys. Rev. Lett. 1969, 23, 572−574.