R E S E A R C H A R T I C L E
Open Access
Potassium urinary excretion and dietary intake: a
cross-sectional analysis in 8
–10 year-old children
Ana Catarina Oliveira
1, Patrícia Padrão
1,2, André Moreira
3,4, Mariana Pinto
1, Mafalda Neto
1,5, Tânia Santos
1,5,
Joana Madureira
6, Eduardo de Oliveira Fernandes
6, Pedro Graça
1,7, João Breda
8and Pedro Moreira
1,9*Abstract
Background: Data from studies assessing the intake of potassium, and the concomitant sodium-to-potassium ratio are limited. The aim of this study was to evaluate potassium and sodium-to-potassium ratio intake in 8–10 year-old children. Methods: A cross-sectional survey was carried out from January to June 2014 and data from 163 children (81 boys) were included. Potassium intake was estimated by 24-h urine collection and coefficient of creatinine was used to validate completeness of urine collections. Urinary sodium and sodium-to-potassium ratio were also analysed. A 24-h dietary recall was used to provide information on dietary sources of potassium. Height and weight were measured according to international standards.
Results: The mean urinary potassium excretion was 1701 ± 594 mg/day in boys, and 1682 ± 541 mg/day in girls (p = 0.835); 8.0 % of children met the WHO recommendations for potassium intake. The mean sodium excretion was 2935 ± 1075 mg/day in boys and 2381 ± 1045 mg/day in girls (p <0.001) and urinary sodium-to-potassium ratio was 3.2 ± 1.4 in boys, and 2.5 ± 1.1 in girls (p = 0.002). The mean fruit and vegetable intake was 353.1 ± 232.5 g/day in boys, and 290.8 ± 213.1 g/day in girls (p = 0.101).
Conclusions: This study reported a low compliance of potassium intake recommendations in 8–10 year-old children. Health promotion interventions are needed in order to broaden public awareness of potassium inadequacy and to increase potassium intake.
Keywords: Potassium, Sodium, Children, 24-h urinary excretion, 24-h dietary recall questionnaire, Fruit and vegetable Background
According to the World Health Organization (WHO), non-communicable diseases (NCDs) are the main con-tributor to mortality and morbidity globally, killing more people each year than all other causes combined [1]. Be-cause of the increasing prevalence of NCDs, dietary guidelines designed to promote public health have been instituted worldwide as an important part of national food and nutrition policies [2]. Interventions that are well understood, cost effective, and feasible could counter-act NCDs [3], since the most health-promoting diets do not require extraordinary effort, cost, or complexity and provide the recommended daily allowances of macro and
micronutrients [4]. Potassium (K+) is one of the key nutri-ents to prevent NCDs, and to preserve total body fluid volume, acid and electrolyte balance, and normal cell function [1, 3]. WHO suggests to adjust downward the recommended potassium intake of at least 3510 mg/day, based on the energy requirements of children relative to those of adults [1, 3]. Food rich in K+, such as fruits and vegetables [1], are recognized as key contributors to a healthy diet and are in line with food based dietary guide-lines [5–7]. In addition, processed foods are often lacking K+[1, 3].
Most NCDs are chronic diseases and have slow pro-gression [8]. Although these diseases disproportionately affect adults, they are now being detected more frequently in paediatric populations, as well as their risk factors [3]. Furthermore, diet in childhood can be a significant determinant of adult dietary habits even after several de-cades [2, 9].
* Correspondence:[email protected]
1
Faculty of Nutrition and Food Sciences, University of Porto, R. Dr. Roberto Frias, Porto 4200-465, Portugal
9
Research Centre on Physical Activity and Health, University of Porto, Rua Dr. Plácido Costa, 91, Porto 4200-450, Portugal
Full list of author information is available at the end of the article
© 2015 Oliveira et al.; licensee BioMed Central. This is an Open Access article distributed under the terms of the Creative Commons Attribution License (http://creativecommons.org/licenses/by/4.0), which permits unrestricted use, distribution, and reproduction in any medium, provided the original work is properly credited. The Creative Commons Public Domain Dedication waiver (http://creativecommons.org/publicdomain/zero/1.0/) applies to the data made available in this article, unless otherwise stated.
Major NCDs include cardiovascular diseases, cancers, chronic respiratory diseases and diabetes [8]. High blood pressure (BP) or hypertension [10, 11] is a major risk for cardiovascular diseases, especially coronary heart dis-ease, stroke and heart failure [3], and are of increasing concern in children and adolescents [12]. Primary hy-pertension probably has its onset in the first decades of life [13, 14].
Diet is believed to play an important role in hyperten-sion [15, 16], especially one high in sodium (Na+) and low in K+content [17]. The part played by dietary factors has been thoroughly studied [17]. Na+intake has been the main topic, but most studies have been concerned with adults [13]. The association between high intake of Na+ and increase of BP [12, 18], as well as hypertension is well established [19]. Intake of Na+is also associated with sig-nificantly increased risk of stroke and other cardiovascular diseases [20–22]. A diet that includes modest salt restric-tion serves as a strategy to prevent or control hyperten-sion and decrease cardiovascular morbidity and mortality [12, 18, 20, 21, 23]. However, this issue is not consensual as some authors argue that blood pressure effect of sodium restriction on blood pressure can no longer be accepted as a surrogate for health outcomes [24] and both low sodium intakes and high sodium intakes may be re-ported has being associated with increased cardiovascular risk [25] and mortality [26].
The potential role of the intake of K+ on BP has re-ceived much less attention than sodium [27] although much evidence shows that increasing K+intake has benefi-cial effects on human health [28]. It was reported that K+ intake was associated with a lower risk of stroke [3, 29, 30] and hypertension [4, 19, 31], since it lowers the BP [3, 27]. However, the evidence on the potential beneficial effect of increased K+on cardiovascular disease is not entirely consistent [3], and confounding effects may arise from the interaction among various dietary electrolytes, in particular, the Na+/K+ ratio and other nutrients in K+ rich foods [13]. As Na+ consumption rises, increased
consumption of K+ may be even more beneficial
be-cause, in addition to other benefits, it can mitigate the negative effects of elevated Na+ consumption on BP [32]. Furthermore, when people have an increased in-take of K+, high intake of Na+ may not be associated with higher BP [33]. Also, regarding dietary intake, high consumption of fruit and vegetables, important sources of potassium, is associated with a lower risk of all-cause mortality, particularly cardiovascular mortality [34] and stroke [35].
However, data from studies conducted in children are limited, particularly those which assess both the intake of Na+and K+, and the concomitant ratio in health outcomes [1]. The available evidence suggests that increased K+ in-take might reduce BP or at least prevent a deleterious rise
in BP with age [36]. However, more studies are needed to verify the effects of K+intake on BP and study its potential adverse effects in children [1].
The best method to estimate K+intake is 24-h K+ excre-tion in urine, as the use of dietary surveys and food com-position databases for estimating K+intake may introduce either an over or underestimation of the actual intake [5, 37–39]. Increased urinary K+
is reported to be associ-ated with a lower body mass index (BMI), diastolic BP and heart rate, as well as lower stroke risk [30]. A better diet quality may also be associated with lower Na+ excretion and higher K+excretion in six-year-old children [5].
Since K+ intake can be a predictor of overall dietary quality and can lead to beneficial effects on human health, we aimed to evaluate and provide information on consumption levels of K+ by 8–10 year-old school chil-dren, measured by 24-h urinary excretion, and assess diet-ary sources of potassium.
Methods
Study population
The cross-sectional survey, which was conducted between January and June 2014, included elementary school chil-dren (8–10 year olds), in Portugal.
To accomplish this project parents and caretakers of 488 children, attending the 3rd and 4th grade, were con-tacted in person. Details about the study were explained, including why the research was being conducted, what the study involved, the methods and procedures used, and the contact details for any necessary support. Partic-ipants were also informed that participation was volun-tary and that they were able to withdraw at any time. All students and their parents received written information on the project. Of the 202 (41.4 %) children who agreed to participate, all collected a 24-h urine sample, but 33 (16.3 %) were excluded for incomplete 24-h urine collec-tion according to the coefficient of creatinine (described in detail below). All the children (n = 202) responded to the 24-h dietary recall questionnaire, although six chil-dren were considered under-reporters (four girls) ac-cording to Goldberg cut-offs. Given that from these six children, five have already been excluded for not exhi-biting valid urine samples, only one child was further excluded, remaining a sample of 168 participants. From these, five children (one with seven years old and four with 11) were also further excluded to narrow the age-range of the subjects, remaining a final sample of 163 participants (82 girls).
Prior data collection, parents provided written infor-med consent, according to the ethical standards laid down in the Declaration of Helsinki, and children gave oral assent. All schools, where the study was carried out, and the Ethical Committee of the University of Porto ap-proved the protocol of study.
General data collection
Data collection was done through structured interviews, anthropometric measures, questionnaires, and collection of 24-h urine sample and 24-h dietary recall by trained researchers.
Socioeconomic variables
All parents and caretakers underwent a structured ques-tionnaire to collect information on sociodemographic characteristics, namely age and sex, and parental educa-tion level (recorded in 3 categories: 0–9 years; 10–12 years; >12 years).
Anthropometric measures
The collection of anthropometric data followed the stan-dardized procedures [40]. Body weight measurement was obtained using an electronic scale (TANITA® TBF-300A, capacity 200 kg, accuracy 100 g) and the height was obtained using a stadiometer (capacity 200 cm, ac-curacy 1 mm) with the head in the Frankfort plane [41]. Participants wore lightweight clothing and no shoes. Body mass index (BMI) was computed as mass, (kg)/ height2, (m). After calculating the BMI, it was plotted on the WHO BMI-for-age growth charts and obtained a percentile ranking, classifying children as: underweight (less than the 3rd percentile), normal weight (3rd to less than the 85th percentile), overweight (85th to less than the 97th percentile) or obese (equal to or greater than the 97th percentile) [42].
Physical activity
Physical activity was measured by a questionnaire sent to each parent or caretaker. This questionnaire included: the time spent watching TV/video during most days of the week (<2 h/day; and≥2 h/day); sleeping duration (≤8 h/day; 9 h/day; and≥10 h/day); and practice of sports activities besides the physical education classes at school (<2 times/ week; 2–3 times/week; >4 times/week) [43].
Urine collection
Parents and caretakers were given both verbal and writ-ten instructions in assisting children to collect a 24-h urine sample and received a standard sterilized urine collection bottle. On the first morning of the urine col-lection, instructions were given to discard the first spe-cimen, and from then on to collect all specimens for up to 24 h, including the first specimen of the following day. The samples were analysed by certified laboratories for 24-h creatinine (mg/day), 24-h urine volume (mL), 24-h sodium (mEq/day), and 24-h potassium (mEq/day). Urinary Na+ and urinary K+ were converted to mg/day (23 mgNa+= 1 mmol Na+ or 1 mEq Na+; 39 mgK+= 1 mmol K+ or 1 mEq K+) [44].
The 24-h urine collections were assessed for com-pleteness using creatinine excretion in relation to weight (i.e. creatinine coefficient), calculated by the following formula:
Creatinine coefficient¼CreatinineBody weight kgðmg=dayð Þ Þ. Creatinine co-efficients above of 0.1 mmol · kg−1· day−1were classified as indicating an acceptable 24-h urine collection [45].
Dietary assessment
When participants delivered the 24-h urine collection, a 24-h dietary recall questionnaire [46] was filled, taking into account the Manual de Quantificação dos Alimentos [47]. Participants were questioned accurately about their food and drinks consumption, even reporting cooking methods, brands and consuming time and place. The soft-ware Food Processor®, (ESHA Research, USA) was used to convert food into nutrients.
To identify under-reporters, Goldberg cut-offs were used as direct comparison of energy intake (EI) to energy expenditure [48]. The Goldberg cut-off values were ap-plied to exclude under-reporters, based on PAL (Physical Activity Level) and compared with the ratio of EI to BMR (Basal Metabolic Rate). BMR was calculated using the Schofield equations for children based on age, gender, height and weight [49].
While the principles of the Goldberg et al. [50] cut-offs still hold when assessing the EI of children and adoles-cents, appropriate age- and gender-specific cut-offs should always be applied in a pediatric population [51]. There-fore, according to the formulas proposed by Goldberg et al. [50], we calculated individual “CUTOFF 2” values using coefficients of variation for BMR of 8.5 %, coeffi-cients of variation for EI (23 %) given by Nelson et al. [52], and published levels of light physical activity (1.55 for boys and 1.50 for girls for this age group) given by Torun et al. [53]. We used these estimated limits specific for age and sex instead of the single“CUT-OFF 2” for adults as pro-posed by Goldberg et al. Thus, records with EI:BMR ratios up to 0.95 for boys and 0.92 for girls were considered not plausible records. This result is in agreement with Sichert-Hellert et al. [54], although differences may occur due to the number of days of dietary assessment (one versus three days).
Finally, diet recall data was analysed and grouped in order to assess potassium rich foods consumption: milk and whey-based milk products; pulses; vegetables; fruit; and fruit and vegetables [55]. We also considered high and low intake of these food groups based on, respectively, intakes at or above the median, and below the median.
Statistical analysis
Statistical analysis was conducted using SPSS Statistical Package® 21.0 (IBM Corporation, 2012).
Continuous variables were presented as mean and standard deviation, and percentiles, and categorical vari-ables were summarized as counts and percentages.
Kolmogorov – Smirnov test was performed to test
variables for normality. Independent samples t-test (parametric variables) and non-parametric test (Mann– Whitney U) were used to identify sex differences for sodium and potassium excretion. Categorical variables were tested using the Chi-square test. A univariate General Linear Model (GLM) was performed to iden-tify sex differences for nutritional and dietary intake and we used the energy intake as a covariate, except for variables expressed as % of total energy intake (TEI) or g/1000 kcal.
We also used independent sample t-test, ANOVA, and GLM to investigate the associations between po-tassium excretion and participants’ characteristics (BMI categories, sports activities, television/video viewing and father’s and mother’s education), and food groups consumption, using energy intake as a covariate in GLM.
A p-value <0.05 was considered to indicate statistical significance.
Results
Table 1 shows the characteristics of participants. Half of the participants were eight years old, and nearly one third was nine years old.
Most children were within the normal range of BMI for age and sex (56.4 %), and no significant dif-ference across BMI categories between sexes was found (p = 0.162).
Girls were significantly less involved in physical activ-ities than boys (61.1 % of girls reported exercise <2 times/week versus 45.6 % of boys, p = 0.047). Sleep duration for less than 8 h/day was reported by 33.3 % of boys, and 22.9 % of girls. The proportions of children who spent two or more hours watching TV/video during most days of the week were 8.6 % in boys and 6.3 % in girls.
Nearly half of parents had attended school until nine years and only a small percentage completed 10–12 years or a longer school education.
The average K+ excretion was similar in both sexes (1701 ± 594 mg/day for boys and 1682 ± 541 mg/day for girls, p = 0.835). The average Na+ urinary excretion was significantly higher in boys (2935 ± 1075 mg/day vs.
Table 1 Characteristics of participants
Boys n (%) Girls n (%) p
Age (years) 8 40 (49.4 %) 46 (56.1 %)
9 30 (37.0 %) 24 (29.3 %)
10 11 (14.8 %) 12 (14.6 %) 0.570
School grade 3rd grade 47 (68.1 %) 50 (72.5 %)
4th grade 22 (31.9 %) 19 (27.5 %) 0.355
BMI categories Underweight 2 (2.5 %) 4 (4.9 %)
Normal weight 46 (56.8 %) 46 (56.1 %)
Overweight 10 (12.3 %) 18 (22.0 %)
Obese 23 (28.4 %) 14 (17.1 %) 0.162
Sports activities (times/week) <2/week 31 (45.6 %) 44 (61.1 %)
2–3/week 29 (42.6 %) 24 (33.3 %)
> 4/week 8 (11.8 %) 4 (5.6 %) 0.047*
Sleeping (hours/day) ≤8 h/day 23 (33.3 %) 16 (22.9 %)
9 h/day 26 (37.7 %) 29 (41.4 %)
≥10 h/day 20 (29.0 %) 25 (35.7 %) 0.374
Television/video viewing <2 h/day 62 (91.2 %) 60 (93.8 %)
≥2 h/day 6 (8.6 %) 4 (6.3 %) 0.411
Father’s education 0–9 years 34 (57.6 %) 28 (45.2 %)
10–12 years 12 (20.3 %) 22 (35.5 %)
>12 years 13 (22.0 %) 12 (19.4 %) 0.175
Mother’s education 0–9 years 35 (53.9 %) 29 (45.3 %)
10–12 years 14 (21.5 %) 16 (25.0 %)
>12 years 16 (24.6 %) 19 (29.7 %) 0.623
2381 ± 1045 mg/day in girls, p <0.001), as well as the mean urinary Na+/K+ ratio (3.2 ± 1.4 vs. 2.5 ± 1.1, in girls, p = 0.002). Table 2 summarizes descriptive data on Na+and K+excretion.
The overall mean energy intake was 2262 ± 555 kcal for boys and 2117 ± 547 kcal for girls (p = 0.098). Table 3 shows macronutrient intake and potassium rich foods consumption by sex, adjusted for energy intake.
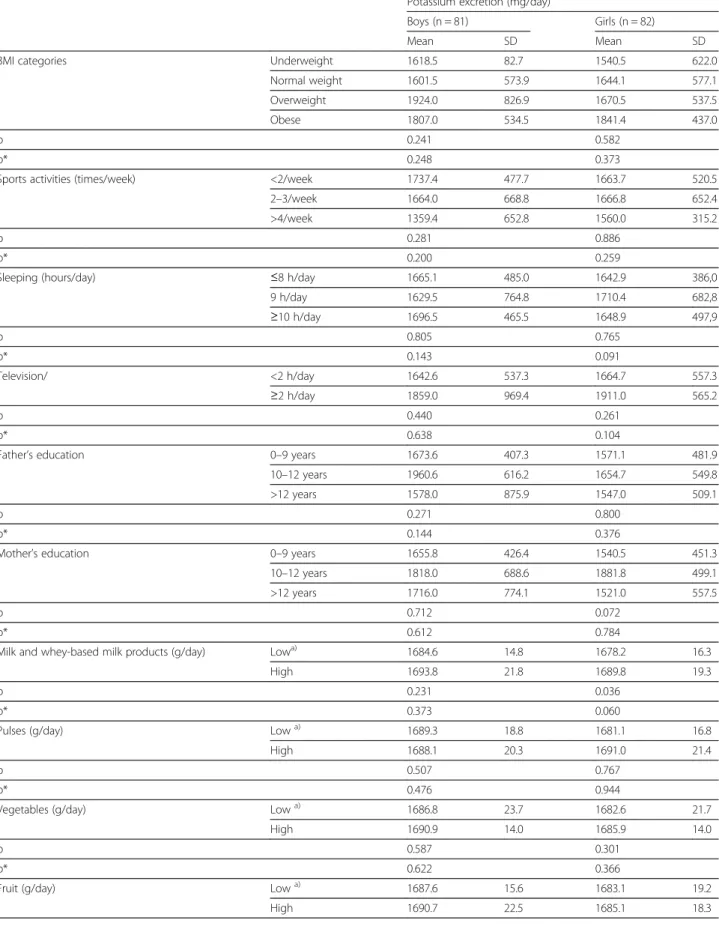
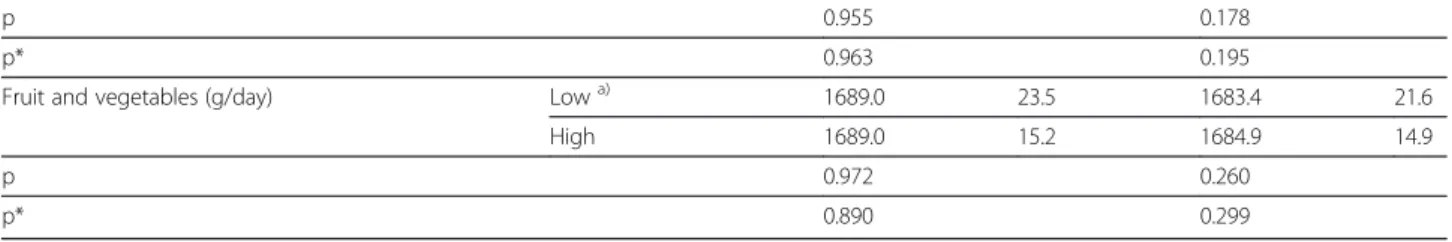
Table 4 shows the relation between urinary potassium excretion and descriptive variables. After considering the mean urinary potassium excretion according to BMI categories, exercise, parents’ education, and time spent watching television/video viewing no significant differ-ences were found for potassium excretion. Moreover, no significant differences were found for potassium excretion according to potassium rich food group’s consumption. Discussion
Average daily K+intake in children was much lower than the recommended level in both sexes, and only 8.0 % of the children had a K+ excretion corresponding to an intake equal or higher than the recommended by WHO, considering energy requirements by age and sex, [1] which suggests a low diet quality. Accordingly, the mean consumption of fruit and vegetables was below the rec-ommended intake level [56]. When comparing the urin-ary excretion of K+ with the corresponding level of the Dietary Reference Intake - Adequate Intake (AI) which is 4.5 g K+/day [57], we did not found any children above this level of intake.
The mean K+ excretion in the present study was
1681 mg/day. According to our best knowledge, only two studies [5, 14] addressed the K+ urinary excretion in school children, although none had studied children from the age range of the present study. Kristbjornsdot-tir et al. examined six year-old children and reported
excretion of about 1210 mg/day [5] while Allison et al. who studied 3–5 years-old children showed a K+
excretion of 1000 mg/day [14]. Nevertheless, it is often challenging to compare values from studies on children, mainly due to the different nutritional requirements, [5] particularly
when considering K+ recommendations depending on
energy needs [5].
The mean Na+ excretion in this study was 2657 mg/ day, and only 7.4 % of the participants had complied with the recommended by WHO, considering age, sex, and energy requirements. On the other hand, only 9.8 % of the children did not exceed the AI of Na+[57]. More-over 54.0 % of the children exceeded the Tolerable Upper Intake Level for sodium [57].
There is also a need to evaluate urinary Na+ and the Na+/K+ratio considering their interrelated biological ef-fects beyond their absolute levels of intake [7]. In this study, the mean Na+/K+ ratio was 2.8 ± 1.29. Although WHO do not address optimal Na+/K+ ratio, it is sug-gested that if recommendations of both Na+and K+ con-sumption are achieved, the molar ratio of Na+/K+would be approximately one to one, which is considered bene-ficial for health [1, 56]. In this sample, the mean Na+/K+ ratio was nearly three times higher than the favourable level for health, in line with other authors. A study con-ducted in southern Italy with subjects aged 2–16 years showed an average Na+/K+ ratio of 3.79 ± 1.68 [58] while in another survey with French participants aged 2–14 years the ratio was 1.64 [6]. Other studies showed that there is a low K+ and high Na+ intake in children [6, 59, 60] suggesting a low consumption of potassium rich foods.
In this study a high potassium excretion does not seem a marker of a healthy lifestyle since low levels of physical activity (p = 0.28 for boys and p = 0.89 for girls), high sed-entary time (p = 0.44 for boys and p = 0.26 for girls) and
Table 2 Sodium excretion, potassium excretion and sodium-to-potassium ratio by sex
Sodium (mg) Potassium (mg) Sodium-to-potassium ratio
Boys Girls Boys Girls Boys Girls
Percentiles 5 1495 1233 747 909 1.50 1.21 25 2093 1737 1297 1287 2.18 1.82 50 2737 2104 1658 1560 2.73 2.33 75 3749 2760 1979 2077 3.75 2.91 95 4996 4685 2982 2796 6.55 4.65 Mean 2935 2381 1701 1682 3.16 2.52 St. Deviation 1075 1045 594 541 1.42 1.05 Minimum 1150 1012 429 780 1.13 1.01 Maximum 6141 6647 3627 3003 8.18 6.94 p <0.001 0.835 0.002
body overweight status (p = 0.24 for boys and p = 0.58 for girls) were not significantly associated with urinary potas-sium excretion. Potaspotas-sium excretion is not significantly higher in children that consume more fruit and vegetables, both for boys (p = 0.992) and girls (p = 0.721), as it would be expected. The difficulty in reporting accurately vege-table consumption specially in food preparations in which vegetables are triturated, such as soups (a staple item of the Portuguese diet), may contribute to explain this unex-pected observation.
However, when assessing dietary intake, particularly on children and adolescents, measurements are prone to error reports, [2] namely inaccuracies in self-reporting, incorrect or incomplete food composition tables, missing data [37], attenuation from daily variation in nutrient intake [61] and mostly through under-reporting [62, 63] Although the seven days food record method had the highest correlation coefficients when compared with nu-tritional biomarkers [61], we performed a 24-h dietary recall to estimate major K+ rich foods intake, after ex-cluding misreporters for energy. The estimated dietary potassium intake and urinary potassium excretion were in agreement, although their correlation was a weak positive one (r = 0.039), which may be explained by the inaccuracy in dietary reporting in children.
In this study, the intake of fibre was lower than the recommended [64], which may reflect the low contribu-tion of K+rich foods such as fruit, vegetables and pulses. The mean contribution of protein to total energy intake
for boys and girls was above the recommended, while the mean contribution of carbohydrate to total energy intake for boys and girls was below the recommended range and the mean contribution of fat to total energy intake was within the recommended range for boys and girls [56]. Saturated fatty acids (SFA) was slightly higher than the recommended, while the mean energy intake from poly-unsaturated fatty acids (PUFA) was much lower than the recommended [65]. These results are close to other results described for Portuguese children [66, 67].
The high Na+/K+ratio found in this study may also re-flect the low proportion of children (33.7 %) who achieved the recommendation to eat at least 400 g of fruit and vegetables/day [56] which is in line with other studies [2, 68]. The importance of fruit and vegetables as sources of K+[29, 35] raises the question of the inad-equacy of food habits in children from a Mediterranean country, concomitantly with the consumption of too salty foods. However, social desirability and the possi-bility of these children not knowing some vegetables, fruits or pulses may also have affected the estimation of these items by the 24 h dietary recall used in our study.
The best way to increase K+ intake is to consume more fruits and vegetables [28] which could have other beneficial effects, besides increasing K+ intake, namely on antioxidants micronutrients and fibre [28, 35].
The results of this study point out the urgent need to develop and implement policies aimed at reducing Na+
Table 3 Nutritional and dietary intake by sex
Boys (n = 81) Girls (n = 82) p
Mean SD Mean SD
Energy (kcal) 2261.7 554.6 2116.9 546.5 0.098
Protein (%TEI) 16.7 3.5 18.1 4.5 0.050
Total fat (%TEI) 28.7 6.6 28.7 6.2 0.569
SFA (%TEI) 9.1 3.1 8.9 3.1 0.778
MUFA (%TEI) 10.4 3.1 9.9 3.2 0.555
PUFA (%TEI) 3.6 1.6 3.6 1.6 0.892
Total CHO (%TEI) 51.6 7.3 50.0 7.9 0.092
Sugarsª (%TEI) 19.4 6.4 18.7 7.4 0.427
Fibre (g/day) 16.1 5.8 16.8 8.4 0.094*
Fibre (g/1000 kcal) 7.2 2.4 7.9 3.1 0.160
Cholesterol (mg) 269.3 121.1 272.9 153.4 0.369*
Milk and whey-based milk products (g/day) 484.7 283.8 515.8 267.8 0.125*
Pulses (g/day) 24.0 99.1 22.5 55.0 0.941*
Vegetables (g/day) 153.0 138.3 114.4 120.7 0.078*
Fruit (g/day) 219.7 170.7 192.0 146.2 0.386*
Fruit and vegetables (g/day) 353.1 232.5 290.8 213.1 0.101*
CHO carbohydrates, SFA saturated fatty acids, MUFA monounsaturated fatty acids, PUFA polyunsaturated fatty acids, TEI total energy intake
ªSugars refer to all monosaccharides and disaccharides added to foods by the manufacturer, cook or consumer, plus sugar naturally present in honey, syrups, and fruit juices
Table 4 Relation between urinary potassium excretion and descriptive variables
Potassium excretion (mg/day)
Boys (n = 81) Girls (n = 82)
Mean SD Mean SD
BMI categories Underweight 1618.5 82.7 1540.5 622.0
Normal weight 1601.5 573.9 1644.1 577.1
Overweight 1924.0 826.9 1670.5 537.5
Obese 1807.0 534.5 1841.4 437.0
p 0.241 0.582
p* 0.248 0.373
Sports activities (times/week) <2/week 1737.4 477.7 1663.7 520.5
2–3/week 1664.0 668.8 1666.8 652.4
>4/week 1359.4 652.8 1560.0 315.2
p 0.281 0.886
p* 0.200 0.259
Sleeping (hours/day) ≤8 h/day 1665.1 485.0 1642.9 386,0
9 h/day 1629.5 764.8 1710.4 682,8 ≥10 h/day 1696.5 465.5 1648.9 497,9 p 0.805 0.765 p* 0.143 0.091 Television/ <2 h/day 1642.6 537.3 1664.7 557.3 ≥2 h/day 1859.0 969.4 1911.0 565.2 p 0.440 0.261 p* 0.638 0.104
Father’s education 0–9 years 1673.6 407.3 1571.1 481.9
10–12 years 1960.6 616.2 1654.7 549.8
>12 years 1578.0 875.9 1547.0 509.1
p 0.271 0.800
p* 0.144 0.376
Mother’s education 0–9 years 1655.8 426.4 1540.5 451.3
10–12 years 1818.0 688.6 1881.8 499.1
>12 years 1716.0 774.1 1521.0 557.5
p 0.712 0.072
p* 0.612 0.784
Milk and whey-based milk products (g/day) Lowa) 1684.6 14.8 1678.2 16.3
High 1693.8 21.8 1689.8 19.3
p 0.231 0.036
p* 0.373 0.060
Pulses (g/day) Lowa) 1689.3 18.8 1681.1 16.8
High 1688.1 20.3 1691.0 21.4
p 0.507 0.767
p* 0.476 0.944
Vegetables (g/day) Lowa) 1686.8 23.7 1682.6 21.7
High 1690.9 14.0 1685.9 14.0
p 0.587 0.301
p* 0.622 0.366
Fruit (g/day) Lowa) 1687.6 15.6 1683.1 19.2
intake and increasing K+ intake at this specific popula-tion and underscore the need for populapopula-tion-based inter-ventions, such as consumer education, improvement of product labelling, changes in food production and restaurant offerings [39]. The evaluation of population current dietary Na+ and K+intakes is needed to measure the success of future intervention strategies [19].
The main strengths of this study are the use of 24-h urine collection for the assessment of K+and Na+intake, as well as the Na+/K+ ratio, in accordance with WHO recommendations that the assessment of Na+ should be followed by the information of K+[69]. Furthermore, the diet and nutritional intake estimated by the 24 h dietary recall are also presented in this report, providing infor-mation on K+ food sources, which may facilitate the de-sign of preventive strategies.
There are some limitations as well. The fact that we only had one 24-h urine excretion per individual might be considered a limitation, as more than one collection may be needed for individual assessment of Na+ and K+ excretion due to day-to-day within-person variability of K+intake. Another limitation is dietary assessment using the 24-h recall questionnaire due to the misreporting of food intake and the fact of not being too precise, what can cause bias to the results. In future surveys, it would be important to collect blood pressure data, given its possible relation with Na+and K+intake.
Conclusion
In conclusion, this study reports a lower K+ intake esti-mated by 24-h urine excretion than the recommended for 8–10 year-old children. This data shows the need to-wards health promotion interventions to broaden public awareness in order to increase K+intake.
Abbreviations
AI:Adequate intake; BMI: Body mass index; BMR: Basal metabolic rate; BP: Blood pressure; DRI: Dietary reference intakes; EI: Energy intake; FCT: Fundação para a Ciência e Tecnologia; NCD: Noncommunicable disease; PAL: Physical activity level; WHO: World Health Organization.
Competing interests
The authors declare that they have no competing interests.
Authors’ contributions
Authorship: PP, AM, JM, EOF, PG, JB and PM and were responsible for the conception and design of the study. MN, MP and TS were responsible for the collection of data and handling to laboratory analysis of the samples. ACO, PP, AM, PG, JB and PM were responsible for the interpretation of data. ACO, PP, AM and PM drafted the manuscript; and all authors reviewed and approved the final version of the manuscript.
Acknowledgments
This project received research funding from WHO and FCT (research project PTDC/DTP-SAP/1522/2012).
Disclaimer
João Breda is a staff member of the WHO Regional Office for Europe. The author alone is responsible for the views expressed in this publication and they do not necessarily represent the decisions or the stated policy of WHO.
Author details
1Faculty of Nutrition and Food Sciences, University of Porto, R. Dr. Roberto Frias, Porto 4200-465, Portugal.2Institute of Public Health– University of Porto (ISPUP), Porto, Portugal.3Department of Immunology, Faculty of Medicine, University of Porto, Porto, Portugal.4Department of
Immunoallergology, Hospital of São João, Rua Prof. Hernâni Monteiro, Porto 4200-319, Portugal.5Faculty of Sciences, University of Porto, Porto, Portugal. 6Institute of Mechanical Engineering, Faculty of Engineering, University of Porto, Porto, Portugal.7Directorate General for Health (Direcção Geral de Saúde), Lisbon, Portugal.8Division of Noncommunicable Diseases and Life-course, WHO Regional Office for Europe, UN City, Copenhagen, Denmark. 9Research Centre on Physical Activity and Health, University of Porto, Rua Dr. Plácido Costa, 91, Porto 4200-450, Portugal.
Received: 4 August 2014 Accepted: 5 May 2015
References
1. WHO. Guideline: potassium intake for adults and children. Geneva: World Health Organization (WHO); 2012.
2. Kristjansdottir AG, Thorsdottir I. Adherence to food-based dietary guidelines and evaluation of nutrient intake in 7-year-old children. Public Health Nutr. 2009;12(11):1999–2008.
3. Aburto NJ, Hanson S, Gutierrez H, Hooper L, Elliott P, Cappuccio FP. Effect of increased potassium intake on cardiovascular risk factors and disease: systematic review and meta-analyses. BMJ. 2013;346:f1378. 4. McCarron DA, Reusser ME. Are low intakes of calcium and potassium
important causes of cardiovascular disease? Am J Hypertens. 2001;14(6, Supplement 1):S206–12.
5. Kristbjornsdottir OK, Halldorsson TI, Thorsdottir I, Gunnarsdottir I. Association between 24-hour urine sodium and potassium excretion and diet quality in six-year-old children: a cross sectional study. Nutr J. 2012;11(94):1475–2891. 6. Meneton P, Lafay L, Tard A, Dufour A, Ireland J, Menard J, et al. Dietary
sources and correlates of sodium and potassium intakes in the French general population. Eur J Clin Nutr. 2009;63(10):1169–75.
7. Mente A, Irvine EJ, Honey RJ, Logan AG. Urinary potassium is a clinically useful test to detect a poor quality diet. J Nutr. 2009;139(4):743–9.
Table 4 Relation between urinary potassium excretion and descriptive variables (Continued)
p 0.955 0.178
p* 0.963 0.195
Fruit and vegetables (g/day) Lowa) 1689.0 23.5 1683.4 21.6
High 1689.0 15.2 1684.9 14.9
p 0.972 0.260
p* 0.890 0.299
*Adjusted for energy intake
a)
8. Sinha-Hikim I, Sinha-Hikim AP, Parveen M, Shen R, Goswami R, Tran P, et al. Long-term supplementation with a cystine-based antioxidant delays loss of muscle mass in aging. J Gerontol A Biol Sci Med Sci. 2013;68(7):749–59. 9. Mikkila V, Rasanen L, Raitakari OT, Pietinen P, Viikari J. Longitudinal changes
in diet from childhood into adulthood with respect to risk of cardiovascular diseases: the cardiovascular risk in young Finns study. Eur J Clin Nutr. 2004;58(7):1038–45.
10. MacMahon S, Peto R, Cutler J, Collins R, Sorlie P, Neaton J, et al. Blood pressure, stroke, and coronary heart disease. Part 1, prolonged differences in blood pressure: prospective observational studies corrected for the regression dilution bias. Lancet. 1990;335(8692):765–74.
11. Lewington S, Clarke R, Qizilbash N, Peto R, Collins R. Age-specific relevance of usual blood pressure to vascular mortality: a meta-analysis of individual data for one million adults in 61 prospective studies. Lancet.
2002;360(9349):1903–13.
12. He FJ, Marrero NM, Macgregor GA. Salt and blood pressure in children and adolescents. J Hum Hypertens. 2008;22(1):4–11.
13. Geleijnse JM, Grobbee DE, Hofman A. Sodium and potassium intake and blood pressure change in childhood. BMJ. 1990;300(6729):899–902. 14. Allison ME, Walker V. The sodium and potassium intake of 3 to 5 year olds.
Arch Dis Child. 1986;61(2):159–63.
15. Berry SE, Mulla UZ, Chowienczyk PJ, Sanders TA. Increased potassium intake from fruit and vegetables or supplements does not lower blood pressure or improve vascular function in UK men and women with early hypertension: a randomised controlled trial. Br J Nutr. 2010;104(12):1839–47.
16. Law MR, Frost CD, Wald NJ. By how much does dietary salt reduction lower blood pressure? I–analysis of observational data among populations. BMJ. 1991;302(6780):811–5.
17. Hedayati SS, Minhajuddin AT, Ijaz A, Moe OW, Elsayed EF, Reilly RF, et al. Association of urinary sodium/potassium ratio with blood pressure: sex and racial differences. Clin J Am Soc Nephrol. 2012;7(2):315–22.
18. Elliott P, Stamler J, Nichols R, Dyer AR, Stamler R, Kesteloot H, et al. Intersalt revisited: further analyses of 24 hour sodium excretion and blood pressure within and across populations. Intersalt Cooperative Research Group. BMJ. 1996;312(7041):1249–53.
19. Zhang Z, Cogswell ME, Gillespie C, Fang J, Loustalot F, Dai S, et al. Association between usual sodium and potassium intake and blood pressure and hypertension among U.S. adults: NHANES 2005–2010. PLoS One. 2013;8(10):e75289.
20. Cook NR, Cutler JA, Obarzanek E, Buring JE, Rexrode KM, Kumanyika SK, et al. Long term effects of dietary sodium reduction on cardiovascular disease outcomes: observational follow-up of the trials of hypertension prevention (TOHP). BMJ. 2007;334(7599):885–8.
21. Strazzullo P, D’Elia L, Kandala NB, Cappuccio FP. Salt intake, stroke, and cardiovascular disease: meta-analysis of prospective studies. BMJ. 2009;339:b4567.
22. Yang Q, Liu T, Kuklina EV, Flanders WD, Hong Y, Gillespie C, et al. Sodium and potassium intake and mortality among US adults: prospective data from the Third National Health and Nutrition Examination Survey. Arch Intern Med. 2011;171(13):1183–91.
23. Aaron KJ, Sanders PW. Role of dietary salt and potassium intake in cardiovascular health and disease: a review of the evidence. Mayo Clin Proc. 2013;88(9):987–95.
24. Alderman MH. The science upon which to base dietary sodium policy. Adv Nutr. 2014;5(6):764–9.
25. Alderman MH, Cohen HW. Dietary sodium intake and cardiovascular mortality: controversy resolved? Am J Hypertens. 2012;25(7):727–34. 26. Graudal N, Jurgens G, Baslund B, Alderman MH. Compared with usual
sodium intake, low- and excessive-sodium diets are associated with increased mortality: a meta-analysis. Am J Hypertens. 2014;27(9):1129–37. 27. van Mierlo LA, Greyling A, Zock PL, Kok FJ, Geleijnse JM. Suboptimal
potassium intake and potential impact on population blood pressure. Arch Intern Med. 2010;170(16):1501–2.
28. He FJ, MacGregor GA. Beneficial effects of potassium on human health. Physiol Plant. 2008;133(4):725–35.
29. D’Elia L, Barba G, Cappuccio FP, Strazzullo P. Potassium intake, stroke, and cardiovascular disease a meta-analysis of prospective studies. J Am Coll Cardiol. 2011;57(10):1210–9.
30. O’Donnell MJ, Yusuf S, Mente A, Gao P, Mann JF, Teo K, et al. Urinary sodium and potassium excretion and risk of cardiovascular events. JAMA. 2011;306(20):2229–38.
31. Geleijnse JM, Kok FJ, Grobbee DE. Blood pressure response to changes in sodium and potassium intake: a metaregression analysis of randomised trials. J Hum Hypertens. 2003;17(7):471–80.
32. Whelton PK, He J, Cutler JA, Brancati FL, Appel LJ, Follmann D, et al. Effects of oral potassium on blood pressure. Meta-analysis of randomized controlled clinical trials. JAMA. 1997;277(20):1624–32.
33. Rodrigues SL, Baldo MP, Machado RC, Forechi L, Molina MCB, Mill JG. High potassium intake blunts the effect of elevated sodium intake on blood pressure levels. J Am Soc Hypertens. 2014;8(4):232–8.
34. Wang X, Ouyang Y, Liu J, Zhu M, Zhao G, Bao W, et al. Fruit and vegetable consumption and mortality from all causes, cardiovascular disease, and cancer: systematic review and dose–response meta-analysis of prospective cohort studies. BMJ. 2014;349:g4490.
35. Hu D, Huang J, Wang Y, Zhang D, Qu Y. Fruits and vegetables consumption and risk of stroke: a meta-analysis of prospective cohort studies. Stroke. 2014;45(6):1613–9.
36. Doria E, Buonocore D, Focarelli A, Marzatico F. Relationship between human aging muscle and oxidative system pathway. Oxid Med Cell Longev. 2012;2012:830257.
37. Leiba A, Vald A, Peleg E, Shamiss A, Grossman E. Does dietary recall adequately assess sodium, potassium, and calcium intake in hypertensive patients? Nutrition. 2005;21(4):462–6.
38. Huang Y, Van Horn L, Tinker LF, Neuhouser ML, Carbone L, Mossavar-Rahmani Y, et al. Measurement error corrected sodium and potassium intake estimation using 24-hour urinary excretion. Hypertension. 2014;63(2):238–44. 39. Meyer KA, Harnack LJ, Luepker RV, Zhou X, Jacobs DR, Steffen LM.
Twenty-two-year population trends in sodium and potassium consumption: the Minnesota Heart Survey. J Am Heart Assoc. 2013;2(5):e000478. 40. Sellen D. Physical status: the use and interpretation of anthropometry.
Report of a WHO Expert Committee, WHO technical report series No. 854, vol. 30. Geneva, 1995: WHO; 1998. p. 452. Swiss Fr 71.00.
41. Stewart AM-JM, Olds T. International standards for anthropometric assessment. Lower Hutt, New Zealand: ISAK; 2001.
42. Growth reference 5–19 years. [http://www.who.int/growthref/who2007_ bmi_for_age/en/].
43. Moreira P, Santos S, Padrão P, Cordeiro T, Bessa M, Valente H, et al. Food patterns according to sociodemographics, physical activity, sleeping and obesity in Portuguese children. Int J Environ Res Public Health. 2010;7(3):1121–38. 44. Bernstein AM, Willett WC. Trends in 24-h urinary sodium excretion in the
United States, 1957–2003: a systematic review. Am J Clin Nutr. 2010;92(5):1172–80.
45. Remer T, Neubert A, Maser-Gluth C. Anthropometry-based reference values for 24-h urinary creatinine excretion during growth and their use in endocrine and nutritional research. Am J Clin Nutr. 2002;75(3):561–9. 46. Gibney MJ, Lanham-New SA, Cassidy A, Vorster HH. Introduction to human
nutrition. John Wiley & Sons; 2009.
47. Marques M, Pinho O, Almeida MDV. Manual de quantificação de alimentos.Faculdade de Ciências da Nutrição e Alimentação da U. Porto (FCNAUP). 1996. 1ºEd.
48. Rangan A, Flood V, Gill T. Misreporting of energy intake in the 2007 Australian children’s survey: identification, characteristics and impact of misreporters. Nutrients. 2011;3(2):186–99.
49. Schofield WN. Predicting basal metabolic rate, new standards and review of previous work. Hum Nutr Clin Nutr. 1985;39 Suppl 1:5–41.
50. Goldberg GR, Black AE, Jebb SA, Cole TJ, Murgatroyd PR, Coward WA, et al. Critical evaluation of energy intake data using fundamental principles of energy physiology: 1. Derivation of cut-off limits to identify under-recording. Eur J Clin Nutr. 1991;45(12):569–81.
51. Livingstone MB, Robson PJ. Measurement of dietary intake in children. Proc Nutr Soc. 2000;59(2):279–93.
52. Nelson M, Black AE, Morris JA, Cole TJ. Between- and within-subject variation in nutrient intake from infancy to old age: estimating the number of days required to rank dietary intakes with desired precision. Am J Clin Nutr. 1989;50(1):155–67.
53. Torun B, Davies PS, Livingstone MB, Paolisso M, Sackett R, Spurr GB. Energy requirements and dietary energy recommendations for children and adolescents 1 to 18 years old. Eur J Clin Nutr. 1996;50 Suppl 1:S37–80. discussion S80–31.
54. Sichert-Hellert W, Kersting M, Schoch G. Underreporting of energy intake in 1 to 18 year old German children and adolescents. Z Ernahrungswiss. 1998;37(3):242–51.
55. Montenegro-Bethancourt G, Johner SA, Remer T. Contribution of fruit and vegetable intake to hydration status in schoolchildren. Am J Clin Nutr. 2013;98(4):1103–12.
56. WHO. Diet, nutrition and the prevention of chronic diseases. World Health Organ Tech Rep Ser. 2003;916:i–viii:1–149.
57. Institute of Medicine, Food and Nutrition Board. Dietary reference intakes for water, potassium, sodium, chloride, and sulfate. Washington, DC: National Academies Press; 2004.
58. De Santo NG, Dilorio B, Capasso G, Russo F, Stamler J, Stamler R, et al. The urinary sodium/potassium ratio in children from southern Italy living in Cimitile: a case for concern. Int J Pediatr Nephrol. 1987;8(3):153–8. 59. Kelishadi R, Gheisari A, Zare N, Farajian S, Shariatinejad K. Salt intake and the
association with blood pressure in young Iranian children: first report from the middle East and north Africa. Int J Prev Med. 2013;4(4):475–83. 60. Morinaga Y, Tsuchihashi T, Ohta Y, Matsumura K. Salt intake in 3-year-old
Japanese children. Hypertens Res. 2011;34(7):836–9.
61. Bingham SA, Gill C, Welch A, Cassidy A, Runswick SA, Oakes S, et al. Validation of dietary assessment methods in the UK arm of EPIC using weighed records, and 24-hour urinary nitrogen and potassium and serum vitamin C and carotenoids as biomarkers. Int J Epidemiol. 1997;26 Suppl 1:S137–51.
62. Bingham SA. The use of 24-h urine samples and energy expenditure to validate dietary assessments. Am J Clin Nutr. 1994;59(1 Suppl):227s–31. 63. Jain M, Howe GR, Rohan T. Dietary assessment in epidemiology: comparison
on food frequency and a diet history questionnaire with a 7-day food record. Am J Epidemiol. 1996;143(9):953–60.
64. Institute of Medicine, Food and Nutrition Board. Dietary Reference Intakes for Energy, Carbohydrate, Fiber, Fat, Fatty Acids, Cholesterol, Protein, and Amino Acids (Macronutrients). Washington, DC: National Academies Press; 2005.
65. WHO. Fats and fatty acids in human nutrition: report of an expert consultation. FAO Food Nutr Pap. 2010;91:1–166.
66. Valente H, Padez C, Mourão I, Rosado V, Moreira P. Prevalência de inadequação nutricional em crianças portuguesas. Acta Med Port. 2010;23(3):365–70.
67. Moreira P, Padez C, Mourao I, Rosado V. Dietary calcium and body mass index in Portuguese children. Eur J Clin Nutr. 2005;59(7):861–7.
68. Kristjansdottir A, Thorsdottir I, De Bourdeaudhuij I, Due P, Wind M, Klepp K-I. Determinants of fruit and vegetable intake among 11-year-old schoolchildren in a country of traditionally low fruit and vegetable consumption. Int J Behav Nutr Phys Act. 2006;3(1):41.
69. WHO. Guideline: sodium intake for adults and children. Geneva: World Health Organization (WHO); 2012.
Submit your next manuscript to BioMed Central and take full advantage of:
• Convenient online submission
• Thorough peer review
• No space constraints or color figure charges
• Immediate publication on acceptance
• Inclusion in PubMed, CAS, Scopus and Google Scholar
• Research which is freely available for redistribution
Submit your manuscript at www.biomedcentral.com/submit