Faculdade de Engenharia da Universidade do Porto
Cost Allocation Model for Distribution Networks
Considering Flexibility from Distributed Energy
Resources
MIGUEL ÂNGELO PEREIRA DA CRUZ
V
ERSÃO DET
RABALHODissertação realizada no âmbito do
Mestrado Integrado em Engenharia Eletrotécnica e de Computadores
Major Energia
Supervisor: Prof. Doutor Manuel António Cerqueira da Costa Matos
Co-Supervisor: Tiago André Soares
iii
Abstract
The world is in continuous transformation, and the way of operation and structure of the energy distribution system as well. The continuous increase of distributed generation, electric vehicles and energy storage systems is changing the planning, operation and management of distribution networks.
Several factors contribute to the transformation of the distribution network, among them is the liberalization of the energy market. Consequently, more users have joined the energy market. Another factor is the proliferation of renewable energy sources, electric vehicles and energy storage systems, technologies that allow to reduce the dependence of fossil fuels and therefore reduce the GHG emissions.
The conventional operation of the power systems implies the unidirectional power flow, in which goes from producer to the user, and all the operation costs are assigned to the user. With the distribution generation (namely renewable energy resources, electric vehicles and storage energy systems), power can also be injected into medium and low voltages levels leading to a bidirectional power flow. The bidirectional power flow entails new challenges to solve, such as problems of line congestions, increase of voltage level, increase of losses in low voltage and more variables to be considered to determine the impact that each user has in the distribution network.
This work arises from the need to study the impact of these innovations in the network and help develop a methodology that allows to represent and allocate more accurately, fairly and economically the costs and impacts of all users of the distribution network. This work comprises three different stages. Firstly, an energy resource scheduling to meet the demand is performed. Secondly, two different power tracing methods (namely, Abdelkader and Bialek) are compared and used to determine the impact that each generator has on the loads and lines of the distribution network. Finally, a variation of the MW-mile method is used to determine and distribute the network usage, congestion and line losses.
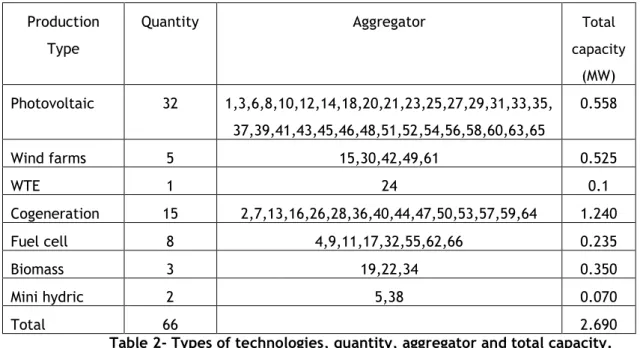
The proposed methodology has been simulated, tested and validated on a 33-bus distribution network considering a wide range of distributed energy resources such as wind farms, small-hydro, photovoltaic, cogeneration, fuel cells, biomass, waste-to-energy, demand response programs, energy storage units and electric vehicles.
Regarding the network usage, congestion and line losses, it was considered that the loads would account for 50% of the costs and generators would responsible for the other 50%. The results of the proposed methodology were analyzed, and the proper conclusions were withdrawn.
v
Sumário
O mundo está em continua transformação e as metodologias de operação e a estrutura do sistema de distribuição de energia elétrica também. A crescente integração de produção distribuída, veículos elétricos e unidades de armazenamento de energia elétrica estão a mudar o planeamento, operação e a gestão das redes de distribuição.
Diversos fatores têm contribuído para a transformação da rede de distribuição, entre elas a liberalização do mercado de energia elétrica, o que tem conduzido a um aumento de utilizadores da rede. Outro fator prende-se com a proliferação do uso de energias provenientes de fontes renováveis, veículos elétricos e sistemas de armazenamento de energia elétrica, tecnologias que contribuem para uma redução da dependência de combustíveis fósseis e consequentemente redução das emissões de gases com efeito de estufa.
No antigo paradigma da distribuição de energia elétrica, o fluxo de energia elétrica era unidirecional, a energia era produzida de forma centralizada e era transmitida aos utilizadores através da rede de transporte/distribuição até aos utilizadores finais. Estes utilizadores finais arcavam com todos os custos de operação da rede de transporte. Com a crescente penetração de produção distribuída (integração de produção de energia proveniente de fontes de energia renováveis, veículos elétricos e unidades de armazenamento de energia elétrica), pode ser injetada energia em níveis de média e baixa tensão levando ao aparecimento de fluxos bidirecionais de energia. Os fluxos bidirecionais de energia trazem novos desafios à rede, como congestionamentos das linhas, aumento dos níveis de tensão, aumento das perdas resistivas em baixa tensão e também o aumento do número de variáveis a ter em conta de forma de forma a determinar o impacto que cada utilizador tem na rede de distribuição.
Este trabalho surge da necessidade de estudar o impacto destas transformações na rede de distribuição e ajudar a desenvolver uma metodologia de alocação de custos da mesma que represente de forma mais precisa, justa e económica o impacto que cada utilizador tem na utilização da de rede de distribuição de energia. Este trabalho é composto por três fases. Na primeira fase é realizado um despacho dos recursos energéticos do sistema de forma a que todas as cargas sejam alimentadas. Na segunda fase, dois métodos diferentes de power flow
tracing são utilizados e comparados (nomeadamente, os métodos de Abdelkader e Bialek) para
determinar o impacto que cada gerador tem em cada carga e em cada linha da rede de distribuição. Finalmente, é utilizada uma variação do método MW-mile para determinar e distribuir os custos de utilização da rede, custos de congestionamentos e custos das perdas.
A metodologia proposta foi simulada, testada e validada numa rede de distribuição de 33 barramentos que integra uma grande diversidade de recursos energéticos como parques eólicos, mini-hídricas, parques fotovoltaicos, cogeração, células de combustível, biomassa,
resíduos sólidos urbanos, programas de demand response, unidades de armazenamento de energia elétrica e veículos elétricos.
Em relação ao uso da rede, congestionamentos e perdas na linha, considerou-se que as cargas representariam 50% dos custos e os geradores seriam responsáveis pelos outros 50%. Os resultados da metodologia proposta foram analisados e as devidas conclusões foram retiradas.
Acknowledgments
Obrigado a todos por existirem e deixarem um pouco de vocês em mim a cada interação. Um muito obrigado aos meus pais e irmã por me terem proporcionado todos os meios para estar aqui. E queria também agradecer ao meu orientador e mais especialmente ao meu coorientador Tiago Soares pela paciência e dedicação que teve comigo ao longo da realização do projeto.
xi
Index
1. Introduction ... 1 1.1 Motivation ... 1 1.2 Objectives ... 3 1.3 Structure ... 4 2. State of art ... 52.1 Concept and Definition of Network Tariff ... 5
2.2 Cost Allocation Methodologies ... 7
2.2.1Embedded Methodologies ... 7
2.2.2.1.1Postage Stamp Methodology ... 7
2.2.2.1.2 Contract Path Method ... 8
2.2.2.1.3Mean Participation Factors ... 8
2.2.2 Power Flow Based Methodologies ... 8
2.2.1.1Methodologies based on DC Power Flow... 8
2.2.2.1.1Classic MW-mile method ... 8
2.2.2.1.2Variants of MW-mile method ... 9
2.2.2.1.2.1 Base ……….9
2.2.2.1.2.2 Module or Use ... 10
2.2.2.1.2.3 Zero Counterflow ... 10
2.2.2.1.2.4
Dominant Flow ... 11
2.2.2.1.3Bilateral Equivalent Exchange Method ... 12
2.2.2.1.4 Generalized Distribution Factors Method ... 12
2.2.2.1.5Rate System Path ... 13
2.2.2.1.6 General Agreement on Parallel Paths... 13
2.2.2.2Methodologies based on AC Power Flow ... 13
2.2.2.2.1 Zbus Methodology ... 13
2.2.2.2.2 Power tracing Methodologies ... 14
2.2.2.2.2.1 Bialek Method ... 14
2.2.2.2.2.2 Kirschen method ... 15
2.2.3Nodal marginal methods ... 16
2.2.3.1 Short Run Marginal Cost ... 16
2.2.3.2Long Run Marginal Cost ... 17
2.2.4 Hybrid methodologies ... 17 2.2.4.1AMP-MILE method ... 17 2.2.5Other methodologies ... 18 2.2.5.1 Games Theory ... 18 2.2.5.1.1Nucleolus ... 19 2.2.5.1.2 Shapley Value ... 19 2.3 Conclusion ... 20
3 Cost allocation method ... 21
3.1 General overview ... 21
3.2 Second stage - Economic Dispatch ... 22
3.3 Second stage - Power Flow Tracing ... 27
3.3.1 Power Flow tracing (overview) ... 27
3.3.2 Node Test-Based Method ... 28
3.3.3General Algorithm ... 29
3.3.4 Bialek Tracing algorithm using average flows ... 34
3.4 Third stage
-
Costs Allocations ... 353.4.1Fixed cost ... 36 3.4.2Network costs ... 37 3.4.3Loss costs ... ..39 3.4.4Total costs ... 40 3.5 Conclusion ... 41 4 Case Study ... 42 4.1 Outline ... 42 4.2Results ... 44
4.2.1First step - Energy resources schedule result ... 44
4.2.2 Second step - Tracing algorithms results ... 47
4.2.3Third step - Cost allocation results ... 48
4.2.4 Abdelkader robustness test ... 52
4.3Conclusion ... 53 5 Conclusion ... 55 5.1Main conclusions ... 55 5.2 Future Works ... 56 6 References ... 58 7 Attachments ... 61
xiii
List of figures
Figure 3-1-Diagram of the proposal model(based on [39]). ... 22
Figure 3-2 Inputs, Outputs and applications(adapted from Berg,2017[42]) ... 27
Figure 3-3-Proportional Sharing Principle( based on article[22] )... 28
Figure 3-4-Types of System nodes. (based on Abdelkader article [25]) ... 29
Figure 3-5-Elimination of A matrix negative elements algorithm (basen on Kjerstin Berg Thesis [36] ) ... 32
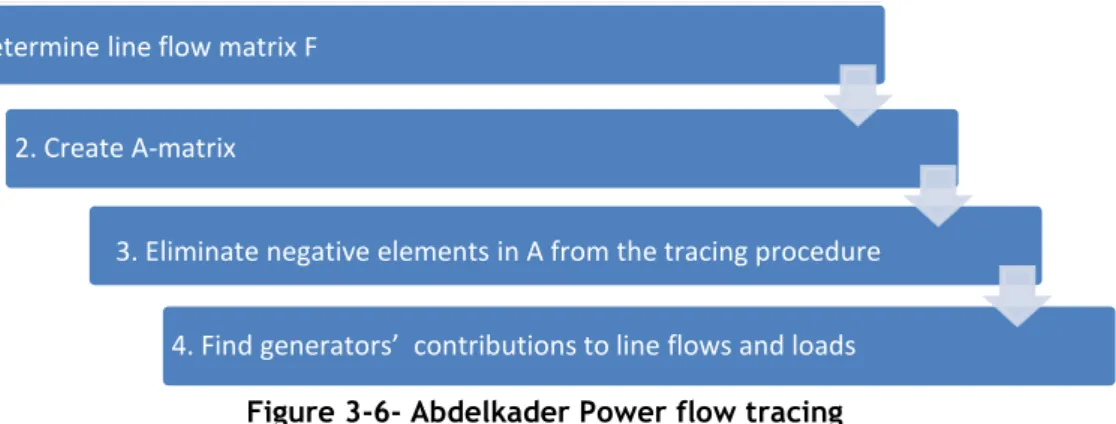
Figure 3-6- Abdelkader Power flow tracing ... 33
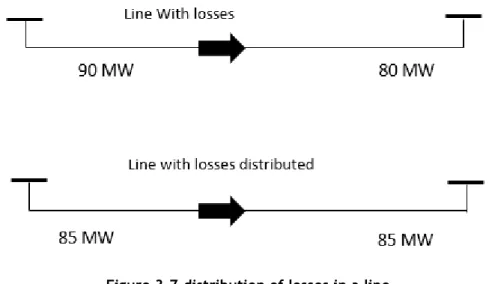
Figure 3-7-distribution of losses in a line ... 34
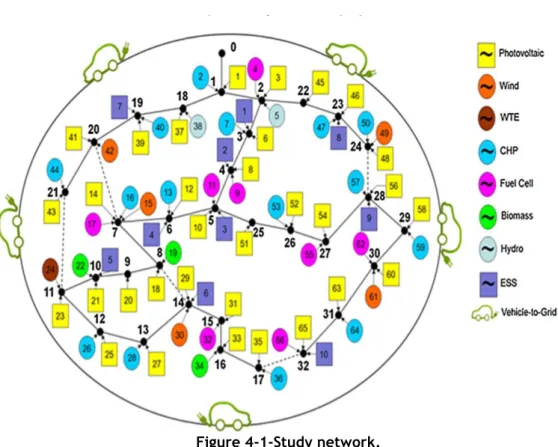
Figure 4-1-Study network... 43
Figure 4-2-Energy resources schedule in the distribution system ... 45
Figure 4-3- Distributed energy resources dispatch and LMP by bus for hour 21. ... 46
Figure 4-4-Network voltage and line congestion for hour 21. ... 46
Figure 4-5 Total DER impact in each branch in hour 21 considering Abdelkader´s and Bialek’s approaches. ... 47
Figure 4-6- Total Cost Share Bialek method ... 50
Figure 4-7- Total Cost Share Abdelkader method ... 50
Figure 4-8- Contribution of generation resources for branch 19 in period 21 ... 51
Figure 4-9- Upstream ... 52
List of tables
Table 1-Node classification condition [28]. ... 30
Table 2Types of technologies, quantity, aggregator and total capacity. ... 42
Table 3 Technologies with storage capacity. ... 43
Table 4-3- Distribution Costs to DER and Load ... 49
Table 5-Branch characteristics ... 61
Table 6- Characteristics of the offers of the Distributed Production and External Suppliers resources. ... 62
Table 7- Demand Response offer for energy services. ... 62
xv
Abbreviations
Acronyms
AC Alternating current;
CHP Combined Heat and Power;
DC Direct current;
DR Demand response;
DER Distributed Energy Resources;
DG Distribution generation;
EBE Equivalent Bilateral Exchanges;
ESS Energy storage systems;
EV Electric Vehicles;
GGDF Generalized Generation Distribution Factor; GLDF Generalized Load Distribution Factor;
LMP Locational marginal price;
NGDF Nodal Generation distribution factor;
OPF Optimal power flow;
PS Power System;
PF Power Flow;
PFT Power Flow Tracing;
PSP Proportional Sharing Principle;
RES Renewable Energy Sources;
TGDF Topological generation distribution factor;
TC Transmission Costs
WtE Waste to Energy;
Indices
dg Distribution generation index;
Ij Node index;
sp External suppliers index;
st Energy storage system index;
t Time index;
Symbology
𝛼 Is a very small, positive number, set to 10−8.
𝛼𝑁, Set of negative elements in row i;
𝛼𝑃, Set of positive elements in row i;
𝛼𝑖(𝑢) Set of nodes supplying straight node i; 𝜂𝑐 Grid-to-storage/vehicle efficiency;
𝜂𝑑 Storage/vehicle-to-grid efficiency;
𝐴𝑖𝑗 Contribution of a generator to the power flow in a line;
B Imaginary part of admittance matrix;
𝐵𝑖𝑗 Imaginay part of admittance matrix (S);
𝐶(𝑖)𝐹𝑖𝑥 Fixed cost line i;
𝐶𝐷𝐺(𝑖,𝑑𝑔)𝐹𝑖𝑥 Total fixed cost caused by generator dg in line i;
𝐶𝐷𝑅(𝑖,𝑑𝑟)𝐹𝑖𝑥 Total fixed cost caused by demand response dr in line i;
𝐶𝐸𝑆𝑆(𝑖,𝑒𝑠𝑠)𝐹𝑖𝑥 Total fixed cost caused by demand response ess in line i; 𝐶𝐿(𝑖,𝑙)𝐹𝑖𝑥 Total fixed cost caused by load l in line i;
𝐶𝑉2𝐺(𝑖,𝑣2𝑔)𝐹𝑖𝑥 Total fixed cost caused by V2G v2g in line i;
𝐶𝐷𝐺(𝑖,𝑑𝑔)𝐿𝑜𝑠𝑠 Total loss cost by generator dg in line i;
𝐶𝐷𝑅(𝑖,𝑑𝑟)𝐿𝑜𝑠𝑠 Total loss cost caused by demand response dr in line i; 𝐶𝐸𝑆𝑆(𝑖,𝑒𝑠𝑠)𝐿𝑜𝑠𝑠 Total loss cost caused by ESS ess in line i;
𝐶𝐿(𝑖,𝑙)𝐿𝑜𝑠𝑠 Total loss cost caused by Load l in line i; 𝐶𝑉2𝐺(𝑖,𝑣2𝑔)𝐿𝑜𝑠𝑠 Total loss cost caused by V2G v2g in line i;
𝐶𝐵𝑟𝑎𝑛𝑐ℎ(𝑖,𝑗)𝑁𝑒𝑡𝑈𝑠𝑒 Network use cost;
𝐶𝐵𝑟𝑎𝑛𝑐ℎ(𝑖,𝑗)𝑁𝑒𝑡𝑈𝑠𝑒𝐴 Network use costs for condition A;
𝐶𝐵𝑟𝑎𝑛𝑐ℎ(𝑖,𝑗)𝑁𝑒𝑡𝑈𝑠𝑒𝐵 Network use costs for condition B;
𝐶𝐵𝑟𝑎𝑛𝑐ℎ(𝑖,𝑗)𝑁𝑒𝑡𝑈𝑠𝑒𝐶 Network use costs for condition C;
𝐶𝐷𝐺(𝑖,𝑑𝑔)𝑁𝑒𝑡𝑈𝑠𝑒 Total Network use cost by generator dg in line i;
𝐶𝐷𝑅(𝑖,𝑑𝑟)𝑁𝑒𝑡𝑈𝑠𝑒 Total network use cost cost caused by demand response dr in line i; 𝐶𝐸𝑆𝑆(𝑖,𝑒𝑠𝑠)𝑁𝑒𝑡𝑈𝑠𝑒 Total Network use cost caused by ESS ess in line i;
xvii
𝐶𝐿(𝑖,𝑙)𝑁𝑒𝑡𝑈𝑠𝑒 Total Network use cost cause by load l in line i;
𝐶𝑉2𝐺(𝑖,𝑣2𝑔)𝑁𝑒𝑡𝑈𝑠𝑒 Total Network use cost caused by V2G v2g in line i;
𝐶𝐴𝐾 Cost related to the transit in the line k;
𝐶𝐵𝐾 Cost of the capacity not used for line k;
𝐶𝑘 Cost of line k (u.m.);
𝑐𝑗𝑖 Total supplementary charge;
CT Transmission total cost (k(u.m.));
𝐷𝑖−𝑗,𝑘𝐿 Topological generation distribution factor in line i-j;
𝐹𝑖 Flow in line i;
𝑓𝑖𝑗 Power extracted from bus i by line j;
𝐹𝑗. (𝑃𝑗) Cost function of the jth generating units (u.m./h);
𝐹𝑘 Flow in line k in the initial conditions (MW);
𝐹𝑘(𝑢) Impact of transaction u in line k (MW);
𝐺𝑖𝑖 Real part of admittance matrix (G);
𝑘 Circuit that conects the bus i with bus j
L Branches Losses (KW);
𝐿𝑘 Length of the line k (km);
𝑁𝐵 Number of resources that contains imaginary part in admittance
matrix(S);
𝑁𝐿 Total number of lines connect to the node;
𝑁𝑔 Is the total number of generators in the power system;
𝑃 Vector of nodal through-flows; 𝑃𝐶ℎ(𝑒𝑠𝑠,𝑡)𝑖 Active Power charged by ESS; 𝑃𝐶ℎ(𝑣2𝑔,𝑡)𝑖 Active Power charged by V2G;
𝑃𝐷𝑅𝑖 𝐴(𝑙,𝑡) Active power reduction by load;
𝑃𝐷𝑅𝑖 𝐵(𝑙,𝑡) Active power curtailment by load;
𝑃𝐷𝐺(𝑑𝑔,𝑡)𝑖 Active Power production by DG;
𝑃𝐷𝑐ℎ(𝑒𝑠𝑠,,𝑡)𝑖 Active Power discharged by ESS; 𝑃𝐷𝑐ℎ(𝑣2𝑔,𝑡)𝑖 Active Power discharged by V2G;
𝑃𝐺 Vector of nodal generation;
𝑃𝐺𝐶𝑃(𝑑𝑔,𝑡)𝑖 Generation curtailment power;
𝑃𝐺𝑖 Generation at node I;
𝑃𝐿𝑜𝑎𝑑(𝑙,𝑡)𝑖 Load consumption; 𝑃𝑁𝑆𝐷(𝑙,𝑡)𝑖 Not supplied demand;
𝑃𝑔 Power produced by the generator g;
𝑃𝑖−𝑗 Line flow from node i to node j;
𝑃𝑗 Real output of the jth generating units in (MW);
𝑄𝐿𝑜𝑎𝑑(𝑙,𝑡)𝑖 Reactive Power consumed by the load;
𝑄𝑁𝑆𝐷(𝑙,𝑡)𝑖 Reactive Power non-supplied to the load;
𝑄𝑆𝑃(𝑠𝑝,𝑡)𝑖 Reactive Power introduced by the external supplier;
𝑅(𝑢) Allocated cost to user u;
𝑅𝐴(𝑢) Base Capacity;
𝑅𝐵(𝑢) Additional capacity;
S Apparent power flow in branch (KVA);
𝑇 Total number of periods;
𝑇𝑜𝑡𝑎𝑙 𝐶𝑜𝑠𝑡𝐷𝐺(𝑑𝑔) Total cost caused by DG;
𝑇𝑜𝑡𝑎𝑙 𝐶𝑜𝑠𝑡𝐷𝑅(𝑑𝑟) Total cost caused by DR;
𝑇𝑜𝑡𝑎𝑙 𝐶𝑜𝑠𝑡𝐿(𝑙) Total cost caused by load;
𝑇𝑜𝑡𝑎𝑙 𝐶𝑜𝑠𝑡𝐸𝑆𝑆(𝑒𝑠𝑠) Total cost caused by ESS;
𝑈𝑖(𝑡)− Voltage in polar form at bus i;
𝑉𝑖 (𝑡) Voltage at node i;
𝑐𝑗𝑖 Total supplementary charge
𝑦𝑖𝑗(𝑡)− Series admittance of line that connects buses i j;
𝑦𝑠ℎ−𝑗 Shunt admittance of line that connects two buses;
𝑅(𝑢) Allocated cost to user u;
𝑅𝐴(𝑢) Base capacity;
𝑅𝐵(𝑢) Adicional capacity;
Subscript
A Fixed component of cost function (m.u./h); B Linear component of cost function (m.u./kWh); 𝐵𝑎𝑡𝑀𝑎𝑥 Battery maximum capacity;
BatMin Battery minimum capacity;
Ch Storage or V2G charge process;
Dch Storage or V2G discharge process; DR_B Active power curtailment of load; DR_A Active power reduction of load;
ESS Energy storage system;
GCP Generation curtailment power Load loads;
L Load;
LTC Loads total cost;
xix
Min Lower bound limit;
NSD Non-supplied demand;
SP External supplier;
V2G Vehicle-to-grid;
Superscript
i Bus;
Fix Fixed costs (m.u.);
Loss Losses costs (m.u.);
NetUse Network use costs (m.u.);
Variables
C Cost (m.u.);
P Active Power (KW);
Q Reactive Power (KVar);
TC Total allocation cost (m.u.);
V Voltage magnitude (V);
1
1 Introduction
1.1 Motivation
The Power System (PS) is undergoing a thorough overhaul. The liberalization of the electric market is one of the factors that has contributed to this reform. The Portuguese Power System, as an image of what has happened in other European countries, is no longer vertically integrated [1], a natural monopoly ceases to exist in the PS and Energias de Portugal no longer have the monopoly of the entire Portuguese electricity sector.
Hence, additional players have entered in system, leading to a competitive environment. According to the vertically integrated structure of the PS, energy was produced in large plants, and then transported and distributed to all consumers with PS planning activities carried out in a simpler way than nowadays [2].
Giving the Portuguese PS as an example of the new paradigm, it is possible to verify that energy production is now liberalized, considering several different producers operating under a competitive market environment. The transport of energy is done through the national transmission network (there is only one transport network operator, because it is not economically feasible to have several), which was commissioned by the Portuguese state to Rede Energética Nacional. The distribution of energy is also a non-liberalized activity, being commissioned to EDP Distribuição at the medium and high voltage level, while the activity at the low voltage level is done through agreements made between EDP Distribuição and the various municipalities. The production and commercialization of energy are liberalized activities, where several entities compete among each other in the energy market to provide energy to their customers. In contrast to the old paradigm, there are now several players in the PS [3].
In addition to this liberalization of the EPS, the increasing concern about the impact of man-made pollution on the sustainability of our planet, coupled with a strong dependence on imported fuels, has led to a greater focus on the use of Renewable Energy Sources (RES) and on Distributed Energy Resources (DER). It is expected that production from renewables will be an important part of the future generation mix, reaching between 60% and 65% of all electric energy produced by the year 2050 [4].
1 Introduction
2
The transformations in the structure of the electric network are not limited to the liberalization of the EPS and changes of the means of production of electric energy. In the old paradigm, when the demand is greater than the production, blackouts may occur, causing serious problems in the society. The lack of information along the energy transport chain makes its management difficult.
The “convergence of information technology and communication technology with power system engineering” [5], led to the emergence of smart grids. “Smart grids are expected to address the major shortcomings of the existing grid” [5].
The smart grids are characterized by bringing to the network the capacity to use information in real time and bring a two-way flow of information between production, consumption and all intermediate points. Besides using artificial intelligence and cyber secure communications technologies where smart meters and price signals are used [6]. These new features allow a much faster reaction to problems that may appear on the grid.
Notwithstanding, the distribution network under the smart grid paradigms comprises several types of DER including RES, Electric Storage Systems (ESSs), Electric Vehicles (EVs), Demand Response programs (DR) among other resources. DER resources can be divided in two types. Dispatchable generators, which can be turn on and off at the request of power grid operators, according to market needs. For instance, Combined Heat and Power (CHP), small-hydro, Waste-to-Energy (WtE), Fuel Cell, Biomass. The other type of DER resources is the non-dispatchable generators that depend on climatic conditions and therefore are intermittent and variable on time. Some of these power sources are Photovoltaic panels and wind turbines.
The introduction of DER has brought with it some challenges. In the old paradigm, the power flow occurred vertically, the voltage levels are higher at the level of the large production centers and will be smaller as the various consumers are fed, according to hierarchized voltage levels.
With the new paradigm, all the energy produced by the DER and not consumed locally can raise some problems, such as the variation of the voltage levels in the buses, congestion in the branches, short circuits with higher power, decrease of the wavelength quality related to the number of harmonies and even the growth of flicker effect [7].
The smart grids paradigm allows a much more efficient and precise management of the network, as it allows the use of new tools and programs, such as DR [8]. DR programs promote the interaction and accountability of customers, as they are given incentives to reduce and / or curtail consumption, which are practices that can help in the network management. In this context, the ESSs and EVs with Vehicle-to–Grid (V2G) capability are very important, since they can mitigate the uncertain and intermittent behavior of RES. The introduction of these technologies brings more resilience to networks since they allow to store energy and inject it into the network when necessary, bringing greater flexibility to the network.
Still, the upstream connection of the network continues to play a very relevant role, since it is able to feed the loads when the RES diminishes or cannot produce, because they are non-dispatchable resources with intermittent and variable generation.
1.2 Objectives 3
3
Despite the transformations that EPS is experiencing, there are still many flaws. Electric Power, to propagate from the production centers to the end-user, uses the transmission and distribution network. Such use has inherent costs, such as fixed(investments), network (operating and maintenance) and losses costs. With the introduction of DER, it is necessary to reformulate the methodologies used to allocate these costs. These methodologies should more accurately represent the impact that each user has on the system. Because different costs must be allocated to users in buses with high penetration of DER and to users in buses with little or no DER penetration. The present work intends to contribute to solve the problem of cost allocation of a network with high penetration of DER.
1.2 Objectives
The continuous penetration of DER in the distribution system brings new challenges in the planning, operation and management of the distribution networks. One of the main challenges is to fairly allocate and distribute the costs of network investments and usage throughout all energy resources present in future distribution networks.
In this context, this dissertation offers a significant contribution in the definition of distribution network tariffs, based on cost allocation methodologies. In particular, the study and comparison of existing cost allocation methodologies makes possible the development of a tool to access the fairness of establishing flexible network tariffs for different players in the system. Within this scope, the specific objective defined for this dissertation are the following:
• Adaption of tracing algorithms to future characteristics of distribution systems. • Implementation of a variant of MW-mile to allocate the costs of distribution
resources
• Comparison of a Bialek and Abdelkader tracing algorithms. • Evaluation of fixed, network usage and losses costs.
1 Introduction
4
1.3 Structure
The present dissertation is divided into 5 chapters.
In Chapter 1, a brief introduction is made on the subject under study, as well as the motivation of study and its main objectives.
In Chapter 2, it corresponds to the State of Art where the concept of tariff is approached, besides a great variability of methodologies of allocation of costs of the transport networks.
In Chapter 3, the methodology used is presented in detail. The proposed methodology is composed of three distinct phases. In the first phase an Economic Dispatch is realized to realize which generators must come into operation to feed all loads. In the second phase, two Power Flow Tracing Algorithms were implemented, in order to understand the impact of each technology has on the flow of each line for each hour and, finally, in the 3 phases of this project, the costs of using the system are calculated and allocated. Three cost are calculated, namely fixed costs, congestion costs and costs of losses. Summing up these three costs we get the total costs of the system.
In Chapter 4, the results of the application of the chosen methodology are presented and discussed. The developed methodologies are tested and validated on a 33-bus distribution network considering 2040 scenario of high DER introduction.
Finally, chapter 5 presents the conclusions of the work developed and proposals for future works are addressed.
2.1 Concept and Definition of Network Tariff 5
5
2. State of art
Since the end of the 90’s and due to the deregulation of power systems, the design and development of methodologies to establish network tariffs has becoming popular, mainly to transmission networks. Several methods have been developed taking into account a fairer distribution of the costs related to network investments and usage at the transmission level [9]. More recently and within the smart grid concept (in which DER are fully integrated in distribution systems), the standard tariffs for cost allocating the distribution network usage are no longer fair to all network users.
This chapter explores the concept of tariffs applied to power system networks identifying the different characteristics used to set the network tariffs. In addition, a comprehensive review of the most distinct approaches existing in the literature is provided with special coverage of methodologies directed to distribution networks.
2.1 Concept and Definition of Network
Tariff
A network tariff is a means of remuneration that aims to recover the costs of using the transmission/distribution lines in the most appropriate and fair way possible. The distribution network tariff is applied to all network users by the entities responsible for the operation of the network (system operators). The network tariff is designed to recover the capital and operating costs of the grid. In addition, the tariff should encourage an efficient use of the network and promote network investments[10]. A fair tariff should also promote equality of opportunity to all users. The structure must be as simple as possible, easy to understand, and easy to implement.
2. State of art
6
There are several different methodologies to determine the network tariff, performing the cost allocation to all energy resources. More precisely, the design of a network tariff can follow different approaches and assumptions, one more complex than another. Still, in most countries the loads get higher share for the transmission network costs than generators because it is assumed that the end-users should support most of the costs for using the network [11]. There are several different methodologies for cost allocation, the most known of which are discussed below [12].
1) By peak consumption or generation: this methodology divides the costs of network
utilization by all its users, taking into account the maximum amount of load or generation, usually measured when the generation / load reaches its maximum in the system. For this method the location of users is irrelevant.
2) By amount of usage: with this methodology the allocation of costs is made through the
amount of energy consumed and/or generated in Megawatt-hour in a year. Is not taken into account the location of the load or generators and it is also a simple application methodology.
3) By a monetary impact basis: Using this methodology, the costs are shared by the
entities that receive a monetary gain and that are influenced by the variation of the energy prices and consequently changes in the cost of production. This method is used in wholesale markets where locational prices and market simulations are used to estimate the economic benefits of variation of energy prices;
4) By flow-basis: Power flow studies are used to plan economic dispatches and determine
the marginal prices of the energy market. It also serves to determine the impact that users have on the system, based on the power they receive and / or send and also the location.
2.2 Cost Allocation Methodologies 7
7
2.2 Cost Allocation Methodologies
In this section several methods of cost allocation are described. This includes the description of the most common methodologies used in many countries, as well as new methodologies that are emerging now in the scientific community. Most of these methodologies were designed for transmission networks but can also be applied to distribution networks.
In this context and for simplicity and comprehensibility, this dissertation splits the methods into five distinct groups, namely: (i)embedded methods; (ii) Incremental type methods; (iii) Marginal methods; (iv) hybrid methods (combining characteristics of the types of methods mentioned previously); and (v) finally methods based on Game Theory.
2.2.1 Embedded Methodologies
This group of cost allocation methodologies is characterized by the simplicity in the determination of the network costs. The total costs are allocated to network users based on a system usage measure previously defined, which depends on the "extent of use" of the system. A fixed cost per unit of energy is defined and it is considered that all users have the same impact on the transport and / or distribution system. The tariff calculation in these methods is based on the ration between a cost of a transaction and the sum of costs of all transactions.
For this reason, the methods within this category are used in markets with transaction-based contracts and not in spot markets[2]. These methods are simple and easy to apply. They also, do not consider the characteristics of network, neither the Power Flow in the branches or the cost of a new transaction that may lead to a reinforcing of the network. That cost of reinforcing the network is diluted by all users, sending erroneous economic signals to them [13].
2.2.1.1
Postage Stamp Methodology
In this method, the remuneration 𝑅𝑡 of the assets and costs of operation and
maintenance of the electricity network is calculated by summing the total costs of transmission 𝑇𝐶, times the power generated or received by the customer 𝑃𝑡 to be divided by the total
demand of the system 𝑃𝑝𝑒𝑎𝑘. The units in this division are a cost in $ to be applied to users. It
is assumed that each transaction affects the electrical system in the same way, not taking into account the location of the loads and the generators [13].
𝑅𝑇 = 𝑇𝐶 ∗ 𝑃𝑡 𝑃𝑝𝑒𝑎𝑘
2. State of art
8
2.2.1.2 Contract Path Method
This method is like the Postage Stamp method. However, the contract path method allocates the distribution costs considering the cost of the continuous path that connects the injection points and energy consumption times the energy received or sent by the customer and divided by the total demand of the system. This method ignores the actual operation of the system, since the electric energy tends to flow through the "path" that offers less resistance. This method does not consider the real path of energy, instead it considers penalties for the contracted path[14].
2.2.1.3 Mean Participation Factors
This method calculates the fraction of each line in which each user has an impact, based on a previous power flow and calculating the proportionality between the power that enters or leaves the node and all the power that enters or leaves that node. This method does not represent the operation of the electrical network because it treats the electrical system as if it were a water pipeline system [5] once its operating mechanism is based on proportionality between injections and power.
2.2.2 Power Flow Based Methodologies
These methodologies are based on Power Flow studies and allocate transmission costs based on functions relative to the distance, path and magnitude of the electrical energy that runs through the system (being considered characteristics that were neglected in the methods used previously). Flow Based Methods can be divided into two groups. Those based on Alternative Current (AC) power flow and those based on DC power flow.
2.2.2.1 Methodologies based on DC Power Flow
Power flow methods based in the DC Power Flow are usually used in situations where there is a need to represent the system in a simple way, with no need of taking in account the cost of losses.
2.2.2.2 Classic MW-mile method
This method takes into account, for each transaction, the power flow of all the lines between the generation and the load, considering the grid structure for the calculation of the tariff. The tariff P is obtained by multiplying the impact of a transaction on each line R(u)
2.2 Cost Allocation Methodologies 9
9
(calculated throw DC power flow) by the length of the line , and also by a unit capacity cost of the line[15]. This method can only be applied in bilateral transactions since it is only in this type of transactions that the point of injection and reception of energy is known and considers the negatives flows advantageous[16]. This tariff has as advantages its simplicity and easy application. 𝑃 = 𝐶𝑇 ∑ 𝐹𝑘 𝑘× 𝐿𝑘 (2) 𝑅(𝑢) = ∑ 𝑃𝑔× 𝐹𝑘(𝑢)× 𝐿𝑘 𝑘 (3)
• 𝑘 – Circuit that conects the bus i with bus • 𝐶𝑘- Cost of line k (um)
• 𝐹𝑘 - Flow in line k in the initial conditions (MW)
• 𝐿𝑘 - Length of the line k (km)
• CT =∑ 𝐶𝑘 𝑘 - Total cost of transmission (k(u.m.))
• 𝐹𝑘(𝑢) - Impact of transaction u in line k (MW)
• 𝑃𝑔 - Power produced by the generator g
• 𝑅(𝑢)- Allocated cost to user u
2.2.2.2.1 Variants of MW-mile method
There are several variations of the MW mile method. These variations share in common the percentages of the capacity of the lines used along the energy flow path.
These variants of the MW-mile are Base, Module or Use, Zero Counterflow and Dominant Flows[16]. The variations of the method appeared to reduce the shortcomings of the original method.
2.2.2.2.1.1 Base
This method is similar to MW-mile Classic but has a large difference because this method considers in the denominator the total power flow that passes in the line (∑ 𝐹𝑠 𝑘(𝑠))
instead of its maximum capacity. With this method, the total system costs are allocated to all users who participate in the transactions according to their impact on the network. Under this method some fees may be negative and the users responsible for these transactions may receive benefits, this is only relevant if the line operates close to its maximum capacity(because negative flows contributes in the relieving of congested transmission lines[17]). Well, if this
2. State of art
10
does not happen, this condition can lead to some users receiving a gain, but without bringing benefits to the network[16].
𝑅(𝑢) = ∑ 𝐶𝑘 𝐾
𝐹𝑘(𝑢)
∑ 𝐹𝑠 𝑘(𝑠)
𝐶𝑘- Cost of line k (um)
𝑅𝑢- Allocated cost to user
(4)
𝐹𝑘 - Flow in line k in the initial conditions (MW)
2.2.2.2.1.2 Module or Use
This method allocates the total system costs for all transactions, considering the transactions in both directions. According to this methodology, in order to determine the contribution of each transaction, first a power flow study is carried out in which all transactions are considered, being this the case of reference, then a study of the power flow is considering a transaction, and n studies are made for n transactions. The difference between this method and the original is that it considers the absolute values of each line flow instead of it original value(with signal)[16].All transaction are taken in account and the cost are more distributed among all users responsible for the transactions , this methods also provides the recovery of the cost of using the System[18].
𝑅(𝑢) = ∑ 𝐶𝑘 𝐾 |𝐹𝑘(𝑢)| ∑ |𝐹𝑠 𝑘(𝑠)| (5) 2.2.2.2.1.3 Zero Counterflow
In the mentioned method, only flows in the same direction as the actual flow in the component are charged[16]. In this case, transactions relating to contributions of counterflows are not charged because they contribute to improving the efficiency of the use of the distribution system. This method does not address the negative impacts, but also does not assign any benefit to the corresponding transaction. Under this method transactions are only charged due to the positive impacts on the lines.
As a main disadvantage of this method is the possibility of tariff discontinuity and volatility[19] In systems with few transactions, the power flows can change direction easily, therefore, transactions that correspond to negative power transits (considered beneficial to the system and therefore not charged), can change to positive, starting to pay a tariff[2].
2.2 Cost Allocation Methodologies 11 11 𝑅(𝑢) = {∑ 𝐶𝑘 𝐹𝑘(𝑢) ∑ 𝐹𝐷𝑠 𝑘 for 𝐹𝑘(𝑢) > 0 𝑘 0 for 𝐹𝑘(𝑢) ≤ 0 (6) 𝐹𝐷𝑘(𝑢) = { 𝐹𝑘(𝑢) for 𝐹𝑘(𝑢) > 0 0 for 𝐹𝑘(𝑢) ≤ 0 (7)
The expression (7) accounts the effect caused by the transaction u in line k if that transaction u increases the active power flow in a line.
2.2.2.2.1.4 Dominant Flow
In general, this method is assumed to be a combination of the “Module or Use” method, and the Zero Counterflow method whose main objective is to reduce or even eliminate the problems related to the other methods presented[16].
In the Dominant Flow method, the tariff is divided into 2 steps:
1) Base capacity: this part is linked to the effective use of the branches of the system and is calculated using “Module or use” method (RA);
2) Additional capacity: associated with capacity available in the branches, circuit reserve .The method used to calculate this parcel is the Zero Counter Flow(RB) [20].
{ 𝑅𝐴(𝑢) = ∑ 𝐶𝐵𝐾 |𝐹𝑘(𝑢)| ∑ |𝐹𝑠 𝑘(𝑠)| 𝑘 𝑅𝐵(𝑢) = {∑ 𝐶𝐴𝑘 𝐹𝑘(𝑢) ∑ 𝐹𝐷𝑠 𝑘(𝑠) for 𝐹𝑘(𝑢) > 0 𝑘 0 for 𝐹𝑘(𝑢) ≤ 0 (8) { 𝐶𝐴𝐾= 𝐶𝑘 𝐹𝑀𝑘− 𝐹𝑘(𝑢) 𝐹𝑀𝑘 𝐶𝐵𝐾= 𝐶𝑘 𝐹𝑘(𝑢) 𝐹𝑀𝑘 (9)
𝐶𝐴𝐾 -is used to calculate the cost related to the transit in the line;
2. State of art
12
2.2.2.2.2 Bilateral Equivalent Exchange Method
The Equivalent Bilateral Exchange (EBE) is a method that translates the resolution of an Optimal Power Flow (OPF) that respects the laws of Kirchhoff, not violating any line limit or generation limit. In this type of method, the original scheme is developed for a pool market (not based on transactions), with the final objective of obtaining the final rates of transmission for each node.
The method imposes a rule on the snap shot of established power flow. The rule is based on the assumption that every generator contributes to each load. Each charge is obtained by a fraction of each generator, whose fraction is evenly divided by all charges. Thus, how much power the generator supplies to the load is defined. In addition, The method provides fair price signals and proves to be useful in the pool system, where bilateral transactions are non-existent [21].
2.2.2.2.3 Generalized Distribution Factors Method
This type of method is obtained through the power transits in the lines. They are widely used as techniques of calculating the allocation of costs associated with the use of the transmission system.
This type of methods are widely used in security analysis and system contingency problems [18].
You can consider two types of distribution factors:
1) GGDF – Generalized Generation Distribution Factor → distribution factor relates the variation of production to the power flow of the lines;
2) GLDF – Generalized Load Distribution Factor → distribution factor relates the variation of Load consumption to the power flow of the lines.
As already mentioned, these two methods evaluate the impact of generators and loads on the Power Flow in each line.
To study the impact, we use sensitivity coefficients, which are based on the DC model [21]. These coefficients corelate the value of the power flow of a line with a variation in the Production (GGDF) or a variation in the Load (GLDF). The imposed variation is compensated by subtracting this variation from the reference bus [18]. These methods aim to assess the costs of incremental resource utilization [21].
2.2 Cost Allocation Methodologies 13
13
2.2.2.2.4 Rate System Path
This method is based on the analysis of the power flow of the network and consequent study of the transmission capacity of each line, considering the normal conditions of exploitation and situations of occurrence of faults in the network. This method is commonly used to study the stability of an electrical system. When a new equipment is added to the system, its distribution capacity is improved, and all calculations are repeated in order to calculate the benefit of the improvement. This method is widely used for studies considering lines of great length, which limits of stability of transmission capacity between zones are establish. In situations where the network is heavily tangle, the use of this method is not recommended, since it is very difficult to define the different zones [2].
2.2.2.2.5 General Agreement on Parallel Paths
This method is not a typical method. Because it consists of a set of studies aimed at compensating the companies that have networks that suffer the impact of undesired power transits, such as loop flows. The impact of the Power Flow (PF) on each line is studied, and it is possible to construct a matrix of participation factors to determine the percentage of each transaction flowing through the networks of the various companies and consequently the cost of the reimbursement to be given to these companies[2].
2.2.2.3 Methodologies based on AC Power Flow
The AC power flow is characterized by approximating the natural behavior of the power system. It is a better approximation than the DC power flow, since takes into account the active and reactive power in the system. In this context, this section presents the main methodologies of the cost allocation problem based on the AC power flow.
2.2.2.3.1 Zbus Methodology
The Zbus method is a method that determines network costs based on the intrinsic characteristics of the distribution networks.
It presents a solution based on circuit theory, the network matrix Zbus considering and
considers the current injection in each bus.
The combination of these two elements (matrix Zbus and current injections) determines
a measure of sensitivity that which indicates the individual contribution of each current injection of the system to form the flow in a transmission line. The method can be divided into 3 main steps [22]:
2. State of art
14
1) Active power of each transmission line is associated with each nodal injection. 2) Cost of a line is allocated to all generators and loads.
3) Process repeats for all lines.
2.2.2.3.2 Power tracing Methodologies
Power flow tracing methodologies are characterized by the tracing of the flow in the network, based on the proportional sharing concept. The proportional sharing concept is “for every node in a network, the proportion of power flow on each outflow branch fed by each inflow branch is equal to the proportion of the inflow from this branch in the total inflows” [23] Methodologies based on this concept can recover the network usage costs in a fair and distributed way. There are several methods developed based on this concept. The main methods found in literature are: (i) Bialek tracing method; (ii) Kirschen tracing method; and
(iii) Abdelkader tracing method.
2.2.2.3.2.1 Bialek Method
In this type of method, the generator contributions for the active, reactive power and power losses are determined for each line of an electrical system and is based on the example analyzed previously for the Proportional Sharing[24].
This method is commonly used to obtain the active power contribution by network users using the DC power flow but can also works using the AC power flow. In this way, it is possible to determine the active and reactive power contributions of each user. This method only works in lossless flows. Bialek proposes three different ways of considering the loss flows in order to consider the flows lossless.
In short, this methodology in a first phase allocates the cost of the use of the transmission of each generators and distributes the losses with the loads and in a second phase the cost of the use in the transmission of each load is allocated, at the same time that the losses are distributed by generator[25]. This methodology is used in this work, so a more detailed definition can be found at section 3.3.4.
2.2 Cost Allocation Methodologies 15
15
2.2.2.3.2.2 Kirschen method
The Kirschen’s present method calculates the contribution of each generator in the flow transits of each line and the contribution of the generators in the power that reaches each bus. That is, it is a technique that aims to determine the impact that generation and consumption have on the network usage of the distribution network. This method is based on a graphical perspective of the network, also known as graph methods for power flow tracing, which comprises three different components:
Three key aspects are considered:
Domains – set of buses that get power from a generator; Commons - set of buses fed by the same generation group Links – lines which connect commons.
Like the previous method, this also serves to calculate the contributions of the generators to the commons, connections and loads and to obtain the line flows within each common.
The method can be applied to all resource types. However, there are two different algorithms (upstream and downstream looking algorithms) that are used to trace the power of generation and consumption resources. The upstream algorithm determines the share of generation resources, while the downstream algorithm determines the impact of the resource consumption on the system[26].
2.2.2.3.2.3 Abdelkader method
In 2007, S. Abdelkader presented a power flow tracing methodology using the proportional Sharing principle. This method starts with a Power Flow study, in order to be able to observe the signal and magnitudes of each energy flow that enters in each bus. Based on this information a matrix A is built where the different buses are classified. These buses can be classified as Source, Generation, Sink and Load. Then two algorithms can be used to determine the share that each user has on the grid. Downstream algorithm where the share of each generator in the different lines, loads and losses is calculated. And the Upstream algorithm used to calculate the share that each load has on the different lines, generators and losses. This method is used to trace active and reactive power flows [27][28]. This method is covered in detail in section 3.3.3..
2. State of art
16
2.2.3 Nodal marginal methods
The nodal marginal method is based on the AC power flow and determines the costs following the power that enters and leaves each node, being influenced by the nodal marginal prices. The method can be applied to all resource types. However, there are two different algorithms (upstream and downstream looking algorithms) that are used to trace the power of generation and consumption resources. The upstream algorithm determines the share of generation resources, while the downstream algorithm determines the impact of the loads on the system. Due to the potential of nodal marginal prices in terms of their transparency and quality of transmitted signals, it is necessary to develop methods that include operating costs and costs of expanding and strengthening networks. Thus, marginal prices can be considered to establish the variation of the cost function if a change of one unit of load occurs in that particular node. That is, the Locational Marginal Price (LMP) is defined as the increase in the cost (system, congestion and losses costs) for supporting the increment of one load unit (1 MW) in a single bus of the network. The LPM comprises different costs, such as: (i) system costs, which are related to energy production; (ii) network congestion, which is the cost for using other generation resources when the network branches have no capacity to provide the energy from the cheapest energy resources; and (iii) losses cost related to the power losses.
The LMP calculation is obtained from the optimal power flow problem, which minimizes the total production costs of the system, thus guaranteeing the lowest possible tariff to the consumer. In short, the nodal marginal methods can be divided into two different categories: the short run marginal cost; and long run marginal cost [26].
2.2.3.1 Short Run Marginal Cost (SRMC)
This cost is determined through the minimization problem of generation costs, satisfying the loading conditions. Thus, this cost can be obtained by calculating the cost of producing an extra unit of output [29]. The SRMC is a cost, which considers the variable costs originated by the transaction (operational cost), however does not consider the cost of reinforcement. In this type of price, capital investments are defined as a fixed cost, so the SRMC corresponds to the cost of producing one more unit of output or providing an addition of service with existing capacity. This costing method uses a transmission analysis model such as an AC or DC load flow that can calculate the price at individual buses [29].
2.2 Cost Allocation Methodologies 17
17
2.2.3.2 Long Run Marginal Cost (LRMC)
Contrary to the short run marginal cost, the long run marginal cost can be determined through several ways. However, its resolution is much more complex. The optimization problem to determine this cost considers operating costs and investment costs related to the expansion and reinforcement of the network. In this type of cost, capital investments may have a variable value [27]. The LRMC is defined as the marginal cost of supplying an additional unit of energy when the installed capacity of the system can increase optimally in response to the marginal increase of the demand. So, both capital and operating costs are incorporated. The LRMC provides a tariff today based on the cost of future system operation [30].
As is easy to understand, the method to determine the LRMC is much more complex than the method to determine the SRMC. Thus, it is very difficult to find the correct calculation of the LRMC, reason why it must be based on assumptions about the future behavior of the power system. Still, the LRMC presents some advantages, namely:
• High stability and Low volatility - daily variations in marginal prices are oscillations around a long-term basis value;
• Optimum pricing and recovery of companies' compensation – the optimization problem considers the operating and investment costs. In this case, when the optimum is achieved, the associated costs can be recovered [5].
2.2.4 Hybrid methodologies
The hybrid methodologies combine different methods in order to overcome their limitations and provide more accurate solutions.
2.2.4.1 AMP-MILE method
The Amp-mile extent of use method that uses marginal changes in current, as opposed to power (MW-mile method), in a distribution asset with respect to both active and reactive power injections multiplied by those injections to determine the extent of use at any time . The fixed charges computed under Amp-mile have two parts. The first part is based on the extent of use of all circuits by loads at each bus at the system coincident peak (locational portion) for only the portion of the circuit capacity that is used. The second part of the charge covers costs associated with the unused portion of the circuit capacity and is recovered over all load at coincident peak. Thus, the mechanism has the property that when the circuit is at full capacity, all costs for that circuit are recovered through locational charges. When the
2. State of art
18
circuit is relatively unloaded, the majority of costs will be recovered over all loads at peak [31].
2.2.5 Other methodologies
2.2.5.1 Games Theory
Game theory is a set of practices used to analyze and describe the behavior of agents in situations of strategic interaction where the agents can get rewards or punishments [32]. This work technique as a lot of interest for areas of economics and management.
A game consist of [33]: • At least 2 players
• Moves - it is through the moves that players progress through the game. These moves can happen alternately between players (like in chess games) or simultaneously (like in a football game). The moves happen according to the decision of the players or because of a probabilistic event.
• A strategy- corresponds to a set of "moves", as an algorithm, that tells the player what to do over the game.
• Payoff - corresponds to the result obtained after a set of moves, at the end of the game the result will be positive, negative or zero. The payoff gives the motivation for the players moves.
•
Games Theory can be divided into two branches: Non-cooperative Games Theory and Cooperative Games theory.
• Non-cooperative Games Theory: this Game Theory is “based on the absence of coalitions”[34] among the various players of the game. Players make decisions in order to maximize their payoff, regardless of the interests and plays of the other players with no communication or cooperation between them[35].
• Cooperative Games Theory : is used for cost allocations in services used by several players[36]. The purpose of cooperative games is to maximize the benefit of all players, so that allocation of costs is done fairly. For this to be possible, players are expected to make decisions that benefit the "common good". Two examples of cooperative games are discussed in the following section.
2.2 Cost Allocation Methodologies 19
19
2.2.5.1.1 Nucleolus
It can be defined as the set of all non-dominated imputations via any coalition, or the set of those for which there are no objections. In this case the solution or the solutions are chosen, eliminating during the negotiation the imputations for which any objection was presented. Formally the nucleus can be represented by the set of all imputations x such that:
∑ 𝑋𝑖≥ 𝑣(𝑠)∀𝑆 ∈ 𝑖 (10)
The mathematical expression above ensures that if any group of individuals S, which is part of the set of individuals composing the game, resolve to make a coalition, it will never obtain a value greater than the sum of the individual gains that it obtains in the imputation x. Any imputation belonging to the core is stable in the sense that there is no coalition that simultaneously has the stimulus and the power to change the outcome of the game. The nucleus may be presented differently. Let(𝑥, 𝑘) = 𝑉(𝑘) − 𝑥(𝐾) be the complaint of coalition members K in relation to the imputation x. Then, one can express it as the set of all imputations whose maximum claims against them are less than or equal to zero [37].
2.2.5.1.2 Shapley Value
In this technique a value is assigned to each unit that contributes to the grand coalition in a game with a function of particular characteristics. This application makes possible to know the probability of a particular player joining the coalition, determining the players payouts depending on the contribution that each player gave to the total payout. The solution to this problem is know as “Shapley Value” , and consist in allocating to each player a weighted average of all the marginal costs associated with its participation in all possible coalitions, considering all those possible coalition in a random manner [38].
2. State of art
20
2.3 Conclusion
Throughout this chapter has been referenced some methodologies of cost allocation of a transmission system.
Embedded methods are based on the application of an “extent of use” measure of the grid, considering that users have the same impact on the network. Although they are easy to implement, they are not very fair because they do not consider the characteristics of the grid. The methods based on power flow determine the impact that different users have on the grid through power flow studies. These methods take into account the characteristics of the network, but they some flaws because they don’t take into account the cost attributed by new transactions and costs related to the expansion of the grid.
The methods based on marginal costs help to respond to the failures of previous methods because they use marginal costs to identify optimal decisions in the operation of the grid. These marginal costs reflect the cost of producing an extra unit of energy [2]. This methodology is fair, but it is difficult to apply because many variables need to be considered in order to calculate these marginal costs.
The methods based on the theory of cooperative games allow to study solutions in the various users make decisions in order to maximize the common good.
The hybrid costs result from the combination of one or more methods, thus aiming to reduce the defects of the individual use of these methods and thus obtain a more robust method. In Chapter 3 it is presented a hybrid method that was used in this work.
General overview 21
21
3 Cost allocation method
3.1 General overview
The proposed cost allocation model consists of three stages. In the first phase, an energy scheduling based on AC OPF is performed, determining which generators must be put into operation to supply the loads in the most economical way possible, considering several constraints, thus minimizing the operating costs of the system. In the second phase of the methodology, the power contributions of each generator and each load in each line are determined through Abdelkader’s and Bialek’s power flow tracing methods. Based on the impact that each generator / load has on the lines, it is possible to determine the costs of using the distribution network by these energy resources (third phase). Figure 3.1 depicts the overall flow of information and phases of the proposed model.
Cost allocation method
22
Figure 3-1-Diagram of the proposal model [39].
3.2 First stage – Energy scheduling
problem
The transmission and distribution network are used to transport electricity from generation points to consumption points. The main objective of the EPS is to feed all loads as efficiently and economically as possible.
The economic dispatch is a tool that determines which generators and what power they must produce in such a way that all the loads are fed, in the most economical way possible, while respecting all constraints of the problem [40].
The problem of economic dispatch can be formulated mathematically by the following objective function. 𝑀𝑖𝑛𝑖𝑚𝑖𝑧𝑒 𝐹𝐶𝑜𝑠𝑡 = ∑ 𝐹𝑗. (𝑃𝑗) 𝑁𝑔 𝑗=1 (3.1)
• 𝐹𝑗. (𝑃𝑗) represents the cost function of the jth generating units (in $/h);
• 𝑃𝑗 represents the real output of the jth generating units in (MW);
First stage – Energy scheduling problem 23
23
The above formula expresses the problem of economic dispatch in a very simplified way. The general information of the proposed problem takes in account the generation and load characteristics, ESS’s, electrics vehicles which can charge and discharge (V2G) and the network characteristics. The active participation of consumers in direct load control demand response is also considered. The energy resources scheduling can be better illustrated below.
𝑀𝑖𝑛𝑖𝑚𝑖𝑧𝑒 𝑓 = 𝑚𝑖𝑛 (3.2) ∑[ ∑ (𝑌𝐷𝐺(𝑑𝑔,𝑡)∗ 𝑐𝐴(𝑑𝑔,𝑡)+ 𝑃𝐷𝐺(𝑑𝑔,𝑡)∗ 𝑐𝐵(𝑑𝑔,𝑡)+ 𝑃𝐷𝐺(𝑑𝑔,𝑡) 2 ∗ 𝑐 𝐶(𝑑𝑔,𝑡)+ 𝑃𝐶𝐺𝑃(𝑑𝑔,𝑡)∗ 𝑐𝐺𝐶𝑃(𝑑𝑔,𝑡) ) 𝑁𝐷𝐺 𝑑𝑔=1 𝑇 𝑡=1 + ∑ (𝑃𝐷𝑐ℎ(𝑣2𝑔,𝑡)∗ 𝐶𝐷𝑐ℎ(𝑣2𝑔,𝑡)+ 𝑃𝐶ℎ(𝑣2𝑔,𝑡)∗ 𝐶𝐶ℎ(𝑣2𝑔,𝑡)) 𝑁𝑉2𝐺 𝑣2𝑔=1 + ∑ (𝑃𝐷𝑅𝐴(𝑙,𝑡)∗ 𝐶𝐷𝑅𝐴(𝑙,𝑡)+ 𝑃𝐷𝑅𝐵(𝑙,𝑡)∗ 𝐶𝐷𝑅𝐵(𝑙,𝑡)+ 𝑃𝑁𝑆𝐷(𝑙,𝑡)∗ 𝐶𝑁𝑆𝐷(𝑙,𝑡)) 𝑁𝐿 𝑙=1 + ∑ (𝑃𝐸𝑆𝑆𝐷𝑐ℎ(𝑒𝑠𝑠,𝑡)∗ 𝐶𝐸𝑆𝑆𝐷𝑐ℎ(𝑒𝑠𝑠,𝑡)+ 𝑃𝐸𝑆𝑆𝐶ℎ(𝑒𝑠𝑠,𝑡)∗ 𝐶𝐸𝑆𝑆𝐶ℎ(𝑒𝑠𝑠,𝑡)) 𝑁𝑉2𝐺 𝑒𝑠𝑠=1 + ( ∑ 𝑃𝑆𝑃(𝑠𝑝,𝑡)∗ 𝐶𝑆𝑃(𝑠𝑝,𝑡) 𝑁𝑆𝑃 𝑠𝑝=1 )]
• 𝑌𝐷𝐺(𝑑𝑔,𝑡)∗ 𝐶𝐴(𝑑𝑔,𝑡), represents the fixed component of cost function of Distributed
Generation (DG) (namely, CHP, Small-Hydric, Biomass, WtE, Wind, PV and Fuel cell) • 𝑃𝐷𝐺(𝑑𝑔,𝑡)∗ 𝐶𝐵(𝑑𝑔,𝑡), represents the linear component of cost function of DG;
• 𝑃𝐷𝐺(𝑑𝑔,𝑡)2 ∗ 𝐶
𝐶(𝑑𝑔,𝑡) , represents the quadratic component of cost function of DG;
• 𝑃𝐶𝐺𝑃(𝑑𝑔,𝑡)∗ 𝐶𝐺𝐶𝑃(𝑑𝑔,𝑡), represents the cost of generation curtailment power;
• 𝑃𝐷𝑐ℎ(𝑣2𝑔,𝑡)∗ 𝐶𝐷𝑐ℎ(𝑣2𝑔,𝑡)+ 𝑃𝐶ℎ(𝑣2𝑔,𝑡)∗ 𝐶𝐶ℎ(𝑣2𝑔,𝑡), represents the cost of each V2G
charging and discharging to the system;
• 𝑃𝐷𝑅𝐴(𝑙,𝑡)∗ 𝐶𝐷𝑅𝐴(𝑙,𝑡) , represents the cost of reduction the active power of load;
• 𝑃𝐷𝑅𝐵(𝑙,𝑡)∗ 𝐶𝐷𝑅𝐵(𝑙,𝑡) , represents the cost of curtailment the active power of load;
• 𝑃𝐶ℎ(𝑣2𝑔,𝑡)∗ 𝐶𝐶ℎ(𝑣2𝑔,𝑡), represents the cost of not supplying;
• 𝑃𝐸𝑆𝑆𝐷𝑐ℎ(𝑒𝑠𝑠,𝑡)∗ 𝐶𝐸𝑆𝑆𝐷𝑐ℎ(𝑒𝑠𝑠,𝑡)+ 𝑃𝐸𝑆𝑆𝐶ℎ(𝑒𝑠𝑠,𝑡)∗ 𝐶𝐸𝑆𝑆𝐶ℎ(𝑒𝑠𝑠,𝑡), represents the cost of each
ESS charging and discharging to the system;
• 𝑃𝑆𝑃(𝑠𝑝,𝑡)∗ 𝐶𝑆𝑃(𝑠𝑝,𝑡), represents the cost of the external supplier for each time.
The AC OPF is modeled considering several constraints of the network being studied. These constrains may prioritize dispatch of energy from renewable sources. The capacity of lines, available generators, external suppliers active (3.3) and reactive (3.4) limits of power delivery are constrains considered. Distribution generation comprise active generation limits (3.5), generation curtailment in active (3.6) and reactive power (3.7). The active participation of consumers in direct load control is also considered through constraints (3.8) and (3.9).
![Figure 3-1-Diagram of the proposal model [39].](https://thumb-eu.123doks.com/thumbv2/123dok_br/15488601.1040809/42.892.129.757.131.544/figure-diagram-of-the-proposal-model.webp)
![Figure 3-2 Inputs and Output’s [42].](https://thumb-eu.123doks.com/thumbv2/123dok_br/15488601.1040809/47.892.142.802.830.938/figure-inputs-and-output-s.webp)
![Figure 3-3-Proportional Sharing Principle [23].](https://thumb-eu.123doks.com/thumbv2/123dok_br/15488601.1040809/48.892.266.581.308.439/figure-proportional-sharing-principle.webp)
![Figure 3-4-Types of system nodes [25].](https://thumb-eu.123doks.com/thumbv2/123dok_br/15488601.1040809/49.892.268.665.697.943/figure-types-of-system-nodes.webp)
![Table 1-Node classification condition [28].](https://thumb-eu.123doks.com/thumbv2/123dok_br/15488601.1040809/50.892.115.734.114.488/table-node-classification-condition.webp)
![Figure 3-5-Elimination of A matrix negative elements algorithm [36].](https://thumb-eu.123doks.com/thumbv2/123dok_br/15488601.1040809/52.892.136.749.159.859/figure-elimination-matrix-negative-elements-algorithm.webp)