HEURISTIC FOR SOLVING CAPACITOR ALLOCATION PROBLEMS IN ELECTRIC ENERGY RADIAL DISTRIBUTION NETWORKS
Maria A. Biagio
1*, Marco A. Coelho
2and Pablo E. Cuervo Franco
2Received December 21, 2009 / Accepted June 17, 2011
ABSTRACT.The goal of the capacitor allocation problem in radial distribution networks is to minimize technical losses with consequential positive impacts on economic and environmental areas. The main objec-tive is to define the size and location of the capacitors while considering load variations in a given horizon. The mathematical formulation for this planning problem is given by an integer nonlinear mathematical programming model that demands great computational effort to be solved. With the goal of solving this problem, this paper proposes a methodology that is composed of heuristics and Tabu Search procedures. The methodology presented explores network system characteristics of the network system reactive loads for identifying regions where procedures of local and intensive searches should be performed. A description of the proposed methodology and an analysis of computational results obtained which are based on several test systems including actual systems are presented. The solutions reached are as good as or better than those indicated by well referenced methodologies. The technique proposed is simple in its use and does not require calibrating an excessive amount of parameters, making it an attractive alternative for companies involved in the planning of radial distribution networks.
Keywords: capacitor allocation, technical losses, distribution networks of electric energy.
1 INTRODUCTION
In the process of transferring energy from production centers to consumer centers inevitable technical losses of electric energy in transmission and distribution networks occur. Active and reactive energy losses, in electric energy distribution networks, correspond to 70% of total losses in the transferring process (Bunchet al., 1982). As a rule, one of the most common ways of reducing losses in distribution systems is to improve the network’s voltage profile thus dimin-ishing the current levels and thereby minimizing energy losses. Improvement in the voltage profile is obtained through the proper installation of capacitor banks. Accordingly, the problem
*Corresponding author
1Department of Statistics, University of Brasilia – UnB, Bras´ılia, DF, Brasil. E-mails: [email protected] 2Department of of Electrical Engineering, University of Brasilia – UnB, Bras´ılia, DF, Brasil.
of capacitor allocation in distribution networks is of the utmost importance for saving energy through improving performance in distribution systems in the short, medium and long term peri-ods. Aiming for this goal, several authors have been concerned with a suitable formulation of the problem. The models of more importance, due to their accuracy, converge on integer nonlinear mathematical programming models that demand great computational effort to be solved due to their combinatorial and non-convex characteristics, mainly when applied to real electric energy distribution networks.
The number of techniques proposed for capacitor allocation in electric energy networks has been very significant. Among these techniques, dynamic programming from Duran (1968), decompo-sition techniques from Baran & Wu (1989), Kaplan’s heuristics (1984) and Denget al. (2002) may be cited. More recently, those that stand out are genetic algorithm techniques from the work of Boone & Chiang (1993), the simulated annealing technique by Chianget al. (1990), and the Tabu Search technique from the authors Huanget al. (1996). In particular, Huanget al. (1996) implemented an algorithm in the Tabu Search technique that utilized sensitivity analysis to allo-cate capacitors in buses with potentially greater impact on electric energy losses in the system. Some work has concentrated on hybrid methodologies. Among them, Miuet al. (1997) may be cited which used a heuristic procedure along with a genetic algorithm; in this work, a genetic algorithm is at first applied to reach regions containing high quality solutions, which serve as initial estimates for the heuristic technique. The authors Gallegoet al.(2001) utilized a method-ology based on genetic algorithms, heuristics and Tabu Search; in this approach, a genetic algo-rithm is used to generate diversity in the initial solutions, which are then evaluated by the Tabu Search procedure and emphasize utilizing path relinking to generate new populations.
This work proposes a methodology that is based on heuristics and Tabu Search to resolve the problem of allocating and sizing capacitor banks in electric energy distribution networks. The objective is minimizing the joint costs of investment when installing capacitor banks plus the costs of energy losses over the planning horizon. The heuristic procedure is based on identifying regions with reactive load consumption levels in the main feeder and lateral branches (or sec-ondary feeders) taking into account several load levels. Computational tests are performed in test systems with different sizes, one being well referenced in literature and two actual systems that are part of the 13.8kV distribution network of the local electric utility in the Federal District of Brazil.
The presentation of this study is divided into the following sections: Section 2 describes the model utilized, Section 3 provides the methodology proposed, Section 4 shows the computational results reached and Sections 5 and 6 respectively end with discussion and conclusions.
2 MATHEMATIC MODEL
provides information regarding the location and sizing of capacitor banks over the planning horizon. From an operational point of view, one of the main concerns in reaching viable solu-tions, besides supplying the load, is to maintain variation of the voltage profile within acceptable values, independent of the load variations.
The mathematical planning model shown in the following, equations 2.1 to 2.7 (Baran & Wu, 1989), corresponds to a balanced radial distribution system (able to be represented through a one-line or single phase diagram) composed of a main feeder with a load levelt, each level with a duration time of1t hours throughout the study’s horizon, T. Incorporation of lateral feeders into the model is addressed later. The notation utilized considers that the buses are numbered in increasing order starting from the first bus connected to the substation. Each segment connection between two adjacent buses in a feeder is called line section connecting busito busi+1 and it has a sub-indexi+lequal to busi+l to which it is connected (and whose position is further away from the main supply source or substation).
Minimize f = T X t=1 ( K p nb X i=1
ui,t+(ket)1t n
X
i=1
Ploss i,t
)
(2.1)
s.a.
Vi+21,t = Vi2,t−2 ri+1Pi,t+xi+1Qi,t+
ri+2 1+xi+2 1
Pi2,t+Q2i,t
Vi2,t ,
i =1, . . . ,nb−1, ∀t (2.2)
Pi+1,t =Pi,t−ri+1·
Pi2,t+Q2i,t
Vi2,t −PLi+1,t, i=1, . . . ,nb−1, ∀t (2.3)
Qi+1,t =Qi,t−xi+1·
Pi2,t+Q2i,t
Vi2,t −QLi+1,t +Qc
N
i+1,t +Qci+1,t,
i =1, . . . ,nb−1, ∀t (2.4)
Vimin≤Vi,t ≤Vimax, i =1, . . . ,nb, ∀t (2.5)
QciN,t =ui,t·bcshi ·Vi2,t, i =1, . . . ,nb, ∀t (2.6)
Qci,t =bcish·Vi2,t, i =1, . . . ,nb, ∀t (2.7)
In this modelnbis the number of the main feeder’s buses, andnis the number of line sections of the feeder interconnecting the buses; K pis the cost of a standard capacitor bank (in $/kVar, whose value is previously adjusted to the present value (PV) taking into account expected interest rates),ui,t is an integer variable that indicates the number of capacitor banks installed in busi (in kVar),ketis the price of energy (in $/MWh and previously adjusted to the PV at load levelt. The active power loss in the(i+l)-th line (in MW), at load levelt is,
Ploss(i+1),t =ri+1·
Pi2,t+Qi2,t
whereri+1is the resistance andxi+1is the line reactance connecting busesi andi+1,Vi,t is the voltage of busi in (kV), Pi,t andQi,t are the respective active and reactive power flow, both exiting from busi, PLi+1,t andQLi+1,t are the respective active and reactive power consumed by the load in busi+1, Qci+1,t is the reactive power injection due to a capacitor bank at bus
i +1 in (kVAr), andQNci,t is the reactive power injection resulting from the installation of new capacitors at load levelt.
The mathematical model above includes the following unknown variables: Pi,t active power flows, Qi,t, reactive power flows, voltage levels, location and number of capacitor banks. The set of possible new capacitor banks depends on the required level of reactive injection at the bus identified as the potential reactive injection provider taking into consideration the load levels and the allowed range of voltage values at the buses (equations 2.5).
Over a defined planning horizon T, the objective function (2.1) considers the investment cost (in $) in the installation of new capacitor banks plus the costs involved in the operation due to the energy losses in the distribution to end users (manifested in conductor heating). The first term of the objective function is a discrete function whose value increases with the number of capacitive units installed (Huanget al., 1996) and the second term is linear due to the non-linear behavior of the energy losses in terms of the variables in the problem such as voltage and power flow. Equations (2.2), (2.3) and (2.4) depict the load flow for radial distribution systems. These equations are a specialized recursive form of the load flow model for radial distribution systems which satisfy basic electric and energy conservation laws. The constraints in (2.5) represent the acceptable voltage ranges for each bus in the system. The equality in (2.6), which is part of equation (2.4), represents a reactive power injection when new capacitive units are installed. The quantity of reactive power injected depends on the number of capacitive units installed (integer variablesui) in each candidate bus. This injection,QNci,t, is also a non-linear term, given that it is a product of a continuous variable,Vi2,t, with an integer variable,ui,t, both unknown throughout the planning horizon. The capacitive susceptance,bcshi , may be considered fixed and estimated from the nominal voltage values and nominal power as communicated by the manufacturer. For example, a 300 kvar nominal power capacitor, projected to work at a 13.8 kV voltage level, has a capacitive susceptance of 0.0016 S. Injection Qci,t in (2.7) is related to capacitive units already in the network configuration and therefore do not have investment costs for the planning. Notice that the mathematical model described above may consider various types of fixed capacitors available in the market; for this reason, it is necessary to only introduce the corresponding susceptance and cost as initial data.
In this work, three load levels t (light, medium and heavy) are considered, each one with a duration time of1t hours over the horizon of the study and with an expected energy price at eacht level equal toket (in $/MWh).
V
0,0P
0,0z
0,1z
0,2P
L1,1,Q
L1,1V
0,1V
0,2V
1,1P
L0,1,Q
L0,1P
1,1Qc
0,1Qc
1,1Qc
0,2P
0,1P
L0,2,Q
L0,2z
1,1Figure 1– Radial Main Feeder with 4 Buses and a Single Lateral Branch wherezi =ri+ j xi.
a main feeder (with zero subscripts) with four buses, three line sections and a lateral branch (or secondary feeder) connected to the middle bus of the main feeder. The figure depicts a given load level.
3 PROPOSED METHODOLOGY
The methodology proposed to solve the problem defined in the previous section is based on heuristics to generate initial solutions and Local Search, which are formulated by using concepts from the Tabu Search methodology such asElite Solutions, Tabu ListandIntensification and Diversification Strategies. The subsections below describe the concepts and fundamentals which make up the methodology, as well as the heuristic procedures proposed.
3.1 Fundamentals
An electric energy distribution network may be composed of one or more main feeders, having its total available reactive power equal to the sum of the reactive power in its main feeders. The methodology proposed here explores this fact utilizing, essentially, a hierarchization of buses and lateral branches of each main feeder, in order to work independently with as many systems as there are main feeders in the network. Thus, the methodological description that follows assumes only one main feeder, which can be extended to network topologies with many main feeders; to do so, the procedure should be applied as many times as the quantity of main feeders in the network in consideration.
3.1.1 Branch hierarchization
3.1.2 Bus hierarchization
The procedure for establishing bus hierarchy is carried out in the following manner: line sec-tions are ordered first along the entire main feeder and secondly along the lateral branches in decreasing order of their reactive power flows.
The reactive flow, exiting from busi+l, is equal to the reactive flow exiting from upper neigh-borhood busi (electrically closer to the energy supply source – substation) minus losses in the connector as well as minus its own consumption. If it is the case, an injection of the existing ca-pacitor banks should be added. This balance of reactive energy is shown in the equation below.
Qi+1,t =Qi,t−xi+1·
Pi2,t+Q2i,t
Vi2,t −QLi+1,t +Qci+1,t, i =1, . . . ,nb−1, ∀t (3.1)
The order in which the buses (and corresponding line sections) are classified is utilized in order for the methodology to identify the installation of capacitors in locations with significant con-sumption of inductive reactive power. This contributes to the deterioration of the voltage and increases losses. For this reason a local search procedure is proposed for the first allocation of capacitors (see Subsection 3.2).
3.1.3 Conceptual suitability of tabu search
Concepts associated withShort Term Memory(STM) andLong Term Memory(LTM) are adapted to the problem, for example:Aspiration Criteria,Elite Solution,Diversification,Intensification, ReinitializationandTabu List(Glover & Laguna, 2002). In consequence, several definitions are presented in this subsection.
Definition 1:Let f(m)andp(m)be the cost values related to the objective function (2.1) and to the respective energy loss, in accordance with (2.8), for a particular allocation of m capacitors in the network. Let f(i n f), f(sup), andp(i n f)andp(sup)be the least and greatest starting values found for cost f and loss p after allocating m = i n f andm = supcapacitors, respectively. For any given number, m, of allocated capacitors, the following conditions are considered, for exampleAspiration Criteria:
(i) If p(m) > p(sup), with f(m) < f(sup), a possible improvement in the cost related to the losses is obtained by increasing the number of capacitor allocations in the network; (ii) Ifp(m) < p(sup), with f(m) < f(sup), a possible improvement in the total cost f(m)
is reached by reducing the number of capacitor allocations in the network;
(iii) If p(m) < p(i n f), with f(m) > f(i n f), then there is the possibility of obtaining a decrease in the total cost f(m) by reducing the number of capacitors allocated in the network;
Definition 2: For a given numberm of capacitors, a feasible solution is classified as an Elite Solutionwhen satisfying one of theAspiration Criteriadefined above.
Definition 3: Using as a base the non-linear and decreasing properties of energy losses as a function of the number of installed capacitors in distribution networks, a region of the solution space problem is referred to as thePromising Regionwhen it is limited superiorly by an Elite Solution,m, which obeys theAspiration Criteria(ii) (or (iii)) and inferiorly by m = sup(or m=i n f), or even when it is limited inferiorly by anElite Solution,m, which obeysAspiration Criteria(i) (or (iv)) and superiorly bym=sup(orm=i n f), as in Definition 1.
The concept of neighborhood of a given solution is fundamental for applyingDiversification and Intensification Strategies. So, the neighborhood of a feasible solution of the problem, described in the previous section, is taken to the set of all feasible solutions of the system of equations (2.2) to (2.5), for any fixed numbermof capacitors.
Definition 4: ADiversification Strategyconsists of generating solutions for specific values of m, and it depends on the topology of the network being studied. When the number of installed capacitors varies, the system tends to behave differently, producing different installation costs and energy losses.
ThreeDiversification Strategiesare employed in the methodology proposed in this work through heuristics based on lateral branch hierarchization as described in 3.1.2, which are 1) Initializa-tion, 2)Promising Exploration Regionsand 3)Reinitialization. Section 3.2 shows each of these strategies with their respective pseudocodes.
Definition 5:TheIntensification Strategyconstitutes allocating in different ways the same num-ber m of capacitors, in order to reach a solution that demonstrates the least cost of electric energy losses. TheFixation of Allocation Elementsis theStrategyadopted, and is presented in Subsec-tion 3.2.3 with its respective pseudocode.
Definition 6:Tabu Listis initially composed of all of the solutions generated in the initialization process of the heuristics (seeDiversification Strategy 1in the section below) and by the Elite Solutions. The size of the list depends on the topology and reactive capacity of the main feeder, which is limited.
3.2 Proposed heuristics
In this section, heuristic procedures are proposed for applying theDiversificationand Intensi-fication Strategies, which are based on the hierarchization of feeder branches, as described in Subsection 3.1.1. They have the objective of generating distinct values and search for the best value for the number of capacitors to be allocated in the distribution network. TheDiversification andIntensification Strategiesare described in Subsections 3.2.2 and 3.2.3, respectively.
the achievement of solutions for this problem, the Local Search heuristic procedure is essentially based on the hierarchization of buses in the distribution network for capacitor allocation. The Local Search procedure proposed in this work is described in the following section.
3.2.1 Local Search procedure
The Local Search procedure is founded on the ordering of the feeder’s buses, in order that those that present greater consumption of reactive power receive a larger number of capacitor banks. This means that the buses with greater reactive consumption are allocated as many capacitors as their reactive capacities can bear, always considering the maintenance of a suitable voltage profile in any given load level.
This local search procedure is performed in just one iteration and is determined by the relation-ships defined in (2.6) and (3.1), as the pseudocode shows in Figure 2.
Aloca Cap:
Local solution for a capacitor numberm;
LetBshbe the susceptance of the standard capacitor bank in pu;
Following the decrease ordering of the buses, Forthei-th busdo:
Compute the reactive consumption,QLi,tdefined in (3.1);
Ifcons=QLi,t/Bsh<mthenalocatei nt(cons)capacitors in the bus;
Updatem=m−i nt(cons)
Otherwise
Alocatemcapacitors in the bus End if
End for Return
Figure 2– Pseudocode for Local Search.
3.2.2 DiversificationStrategies
As aDiversification Strategy 1, theInitializationof the procedure for solving the problem ad-dressed here, as described in Section 2, is concerned with generating distinct values for a number of capacitors,m, to be allocated so that they satisfy intrinsic characteristics of the electric energy distribution system. This generation is carried out based on the reactive flow of main feeder branches, as is described below.
Strategy 1: Heuristic procedure for initialization
With the hierarchization of branches, determined according to Subsection 3.1.1, a given number of capacitors is chosen to generate a solution when dealing with the reactive load flow of the branches which present greater consumption, taken independently or in group, in the form:
• Letm(k)be the number of capacitors calculated according to the power flow that reaches thek-th branch. By supposing the first branch as the one with the greater reactive power flow, generating a solution for different numbers of capacitors,u=m, such asm=m(1), m=m(1)+m(2), . . . ,m=m(1)+m(2)+ · · · +m(nr), wherenris the number of feeder branches withm(i)not null, for anyi.
Strategy 2: Promising exploration regions
Taking themvalues as determined in the previous strategy,Diversification Strategy 2requires, a priori, establishing thePromising Regions, in accordance with Definition 3, Subsection 3.1.3, and subsequent searches for better solutions.
This exploration occurs in the following manner: for every value ofmbelonging to a Promising Region, the Local Search procedure, described in the previous section, is used to reach a solution for the problem defined by (2.1) to (2.6).
Strategy 3: Reinitialization
The procedure ofReinitialization Strategyintegrates the proposed methodology in this work and a new phase may take place for generating solutions that followsStrategy 1inDiversificationby using an inversion of the branch’s hierarchization. TheReinitializationmay enable discovery and exploration of regions that have not been visited in the solution space of the problem as described in Section 2, mainly those regions with less reactive consumption.
Figures 3 and 4 present the pseudocodes of the procedures adopted inDiversification Strate-gies 1and2, respectively. Figure 3 also shows a summary of the logic sequence used by the heuristic methodology developed in this work. Two sub-routines are referred to: Aloca Cap and Intensive Search, which respectively codify the procedures of Local Search (see Fig. 2) and the Intensification Strategy, described in Subsection 3.2.3.
Determining thePromising Regionsdemands,a priori, a search ofElite Solutionsand is a fun-damental part for achievingDiversification Strategy 2. The pseudocode in Figure 4 describes the exploration process forPromising Regions. In this figure, F inf and F sup are denoted as the least and greatest values of the objective function, respectively, as in Definition 1, Subsection 3.1.3.
3.2.3 Intensification Strategy
Proc HeuTabu
Initialization phase:Diversification Strategy 1andTabu List Following the decrease classification of the branches,
Aca=0
Forthek-th branch,k=1, . . . ,nr,do: Compute the reactive power−pot; Aca= Aca+pot
ApplyAloca Capto alocatei nt(Aca)=mcapacitors; Go to Tabu List;
ComputeF infandF supby following Definition 1; DeterminePromising Regions;
End for
max al= Acais the reactive capacity of the feeder;
ExploringProming Regions(see Fig. 4) TestReinitializationnecessity –Strategy 3; Call Intensive Search Intensification Strategy End HeuTabu
Figure 3– Pseudocode for the methodology andDiversification Strategy 1.
DeterminePromising Regionsby following Definition 3, subsection 3.1.3; Promising Search:
ForeachPromising Regiondo: Define
min elite and max elite as the lower and upper bounds, resp. kmax1=max elite−1
kmin1=min elite+1
Fornint = kmin1untilkmax1do: Ifnint is notTabu
CallAloca Cap UpdateF inf End if
End for End for Return
Figure 4– Pseudocode for theDiversification Strategy 2.
element) in the solution indicated by the Local Search can not be allocated in a neighboring bus which it is the farthest from the substation.
i assumes integer values in the interval [1,3], thei-th bus predecessor of an allocation element will receive the capacitor of its “neighbor”.
The Intensification Strategy is applied in the neighborhood of the best solution among those found in thePromising Regionsand optionally those solutions belonging to the Tabu List whose results, reached by Local Search, are close to the solution with the least total cost.
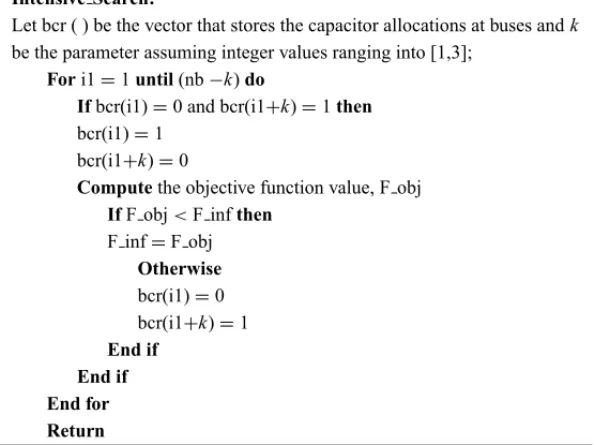
Intensive Search:
Let bcr ( ) be the vector that stores the capacitor allocations at buses andk be the parameter assuming integer values ranging into [1,3];
Fori1=1until(nb−k)do
Ifbcr(i1)=0 and bcr(i1+k)=1then bcr(i1)=1
bcr(i1+k)=0
Computethe objective function value, F obj IfF obj<F infthen
F inf=F obj Otherwise bcr(i1)=0 bcr(i1+k)=1 End if
End if End for Return
Figure 5– Pseudocode forIntensification Strategy.
4 RESULTS
The methodology described in the last section was implemented in Virtual Basic language and was tested on a PC Pentiumr4, 1.80 GHz, for three distinct electrical energy distribution sys-tems. Three problem tests were performed: the first is related to the main feeder of Ceilandia City that is located in the Federal District, Brazil; the second one is largely referred to in literature and was also used by Gallegoet al. (2001); the third problem is related to the main feeder of North Lake region, Brasilia city (Federal District), Brazil, and it belongs to the network distribution company of Brasilia – CEB. The network parameters for the first and third problem, including energy prices, were obtained from CEB’s data file, which follows energy polices determined by ANEEL (National Regulatory Agency of Electrical Energy – www.aneel.gov.br). Results are present in the next sections.
4.1 Test Problem 1
A planning horizon of one year is considered with three load levels: light, medium and heavy with permanence time of13 = 1000,12 = 6760,11 = 1000 hours, respectively. They are
also characterized by the following parameters: the annual average consumption is multiplied by the factors S3 = 0.3, S2 = 0.6, S1 = 1.1, and the estimated energy prices are ke3 =
60 US$/MWh, ke2 = 60 US$/MWh and ke1 = 228 US$/MWh, respectively. There is the
possibility of installing fixed capacitors with a price of US$ 1,470.00 for each 300 kVAr bank. With no capacitors (m = 0)the objective function value of the problem was f(0) = US$ 24,454.08 with energy losses of p(0)=0.020168M W. By running the proposed methodology, described in Section 3, the maximum value found for the number of capacitor allocations was max =3, with f(max)=US$ 21,829.17 andp(max)=0.013327 M W. In itsInitialization phase, the methodology obtained solutions form=1 andm =2 capacitors of 300 kVAr, from which the following results were attained: f(1)=US$ 22,205.17 andp(1)=0.0161166M W, f(2)=US$ 21,582.34 and p(2)=0.01407196M W. TheIntensification Strategywas applied tom =2 andm=3 without meeting lower values for the objective function then the last ones cited (for this result, the value of the parameterkwas set 2).
Then, the best solution indicated two capacitor allocations in the following way: one at bus 19 and another at bus 32. The cost savings obtained with energy losses was of 11.74%. The computational CPU time spent for solving the problem was 0,121 seconds plus 0,019 seconds for running theIntensification Strategy.
An improved solution was found by setting the parameterkequal to 3. In the last situation, the obtained results were: two capacitor allocations at buses 28 and 35 with objective function value f(2)=US$ 21,197.68 which is equivalent to US$ 18,257.68, or 25.34% savings in lost energy costs.
According to the report “Alocac¸˜ao de Bancos de Capacitores Fixos na Rede de Distribuic¸˜ao Prim´aria da CEB” (CEB – Bras´ılia, Brazil, 2003), the standard procedure for allocating a 300 kVAr capacitor bank, followed by the Brazilian Electric Company – CEB, determines that the allocation may occur nearly to the middle of the main feeder from its substation. In this way, two capacitors would be allocated in the bus 10, which would be equivalent to obtaining a total cost of f(2) =US$ 22,154.90 and a cost with energy losses equal of US$ 19,214.9. This last value would imply a reduction of 21.42% in the costs with energy losses.
4.2 Test Problem 2
The problem considered in this section is related to a network with 69 buses and it is a well-known problem in literature (Huanget al., 1996). It has a planning horizon of ten years with three load levels: light, medium and heavy. In the period of one year, these load levels have permanence time of13=1000,12=6760,11=1000 hours, respectively. For the next years,
it is considered an annual load increase of 9.55% that has an upper bound of 5 MW. This load limit is reached in the fourth year. For the computational test, the values of its parameters are used as in Gallegoet al.: S3 =0.5, S2 =0.8, S1 =1.0, andke1 =82 US$/MWh,ke2 =49
US$/MWh andke3=19 US$/MWh, where the parameters S3,S2,S1, andke1,ke2,ke3are as
In this problem, each fixed capacitor bank of 300 kVAr had a cost of US$ 1,564.00. With no capacitors installed, the value of its objective function was equal of f(0) = US$... 1.074,433.00, which differs from the value presented in Gallegoet al. (2001), that was f(0)=
US$ 1.081,890.00. This difference can be explained by the use of distinct convergence toler-ances for each load flow in each load level over the planning horizon.
The initial solutions obtained by the Initialization Strategy (Subsection 3.1.3) were: for the capacitor numbers of m = 0, m = max = 9, m = 2, and m = 4, the objective func-tions presented total costs of f(9) =US$ 709,664.69, f(2) =US$ 900,488.69 and f(4) =
US$ 757,929.98, with respective losses p(0) = 0.22510485M W, p(9) = 0.14456516 M W, p(2)=0.18626845M W andp(4)=0,15534604M W. APromising Regionwas determined and explored by solving the problem for the capacitor numbersm = 5,6,7 and 8 which pre-sented objective functions with total costs of f(5)=US$ 731,802.22, f(6)=US$ 730.613,94, f(7)=US$ 731,121.66 and f(8)=US$ 718,914.05. In this phase, the best solution obtained by the methodology was related to m = 9 which achieved an economy of 33.95% in energy losses.
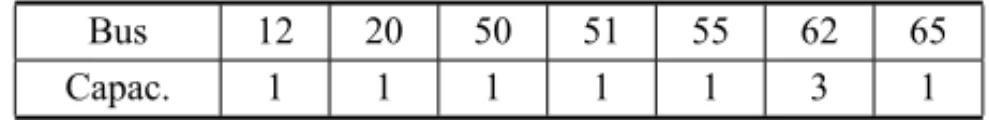
TheIntensification Strategy, defined in Subsection 3.1.3, was applied in the solution neighbor-hood form = max = 9 capacitor. By fixing the parameter valuek = 2, the obtained total costs in the objective function and energy losses were f(9) =US$ 707,761.02 and p(9) =
0,14413399M W with capacitor allocations as shown in the table below. For solving this prob-lem, the total computational load was 0.6532 seconds which includes 0.2421 seconds spent dur-ing the intensive search.
Table 1– Best capacitor allocations found for the test problem 2.
Bus 12 20 50 51 55 62 65
Capac. 1 1 1 1 1 3 1
This final solution represents an economy in the total costs (which means economy in energy losses plus capacitor investments) of 34,12%. If considering only the costs of energy losses of US$ 693,685.02, the obtained economy is 35,44% which is higher than those ones presented in Huanget al.(1996) and Gallegoet al.(2001).
For the same test problem, the best cost of energy losses found by Huanget al. (1996) was US$ 966,539.70, which represents a cost saving of 31.42%, or a total cost of US$ 966,539.70 with 3 capacitor allocations. The work of Gallegoet al.(2001) achieved US$ 711,655.00 as the best cost in energy losses withm = 8 fixed capacitor allocations, which represents 34.22% in cost savings.
4.3 Test Problem 3
values of costs in energy losses, load levels factors and the permanence time of the system in the light, medium and heavy load levels are the same as those considered in test problem 2.
4.3.1 Horizon of One Year
The test problem was performed by considering complete information of the network system that is composed of 802 buses. By applying the proposed methodology in this work, the obtained results were: with no installed capacitors,i.e.form=0, the total cost of f(0)=US$ 19,501.71 and energy losses of p(0) = 0.0669 M W; form = 9, f(9) =US$ 30,028.13 and p(9) =
0.047648M W.
Other solutions generated by the Initialization Strategy of the heuristic procedure used the following capacitor numbers: m = 3 and m = 5, with total costs of f(3) =US$ 19,108.38 and f(5) = US$ 21,463.72, and energy losses of p(3) = 0.0508538 M W and p(5) =
0.0481160M W, respectively.
A Promising Region with boundsm = 3 and m = 9 was recognized. By exploring it the following solutions were found for the number of capacitor allocationsm = 4,6,7 and 8, re-spectively: f(4)=US$ 20,068.90, f(6)=US$ 22,514.16, f(7)=US$ 24,008.33 and f(8)=
US$ 26,106.78. TheReinitialization Strategyfound a solution form =2 capacitor allocations with total cost of f(2) =US$ 19,015.00 and energy losses of p(2) = 0.0558226 M W. So, the best solution obtained from this phase was related to m = 2 capacitor allocations which presented a cost economy of 2.5% in energy losses.
TheIntensification Strategy, Subsection 3.1.3, was applied to the neighborhood of this last so-lution, with the parameter valuek=2, finding total cost of f(2)=US$ 18,963.71 and energy losses ofp(2)=0.05565M Wwhich is equivalent to an economy of 2.76%. The computational CPU time for resolving the problem was: 41.87 seconds for the first phase plus 6.97 seconds for theIntensificationphase.
4.3.2 Horizon of Three Years
For a three year planning horizon, a system load with an annual uniform increase of 9.55% up to 5 MW was considered. The computational test was performed by considering the complete network system –i.e., the network composed of all 802 buses.
The obtained results were: with no capacitors installed the problem presented objective function value equal of f(0)=US$ 71,783.02 and energy losses of p(0)=0.06990M W. By running, the heuristic procedure foundmax=9, f(9)=US$ 62,534.54 and p(9)=0.045325M W. Other solutions were generated by the Initialization Strategyof the proposed methodology by using the capacitor allocation numbersm=3 andm=5. The values of the objective functions and energy losses obtained were equal of f(3)=US$ 58,653.06 and f(5)=US$ 57,457.39,
p(3)=0.0533273M Wandp(5)=0.0480364M W, respectively.
the objective functions found were equal to f(4) =US$ 58,234.930, f(6) =US$ 57,445.93, f(7)=US$ 59,980.37 e f(8)=US$ 62,155.48. During this phase the best solution found by the proposed methodology was related tom = 6 capacitor allocations, which obtained a cost economy of 19.97% in energy losses. TheReinitialization Strategyreached a solution form=2 capacitors which presented total costs of f(2)=US$ 62,439.46.
TheIntensification Strategy, Subsection 3.1.3, was applied to the neighborhood of the solution related tom =6 capacitors by setting the parameterkwith the value of 2. The results found were: total costs equal to f(6)=US$ 57,131.82 and energy losses ofp(6)=0.046262M W. Therefore, the best solution indicates a cost economy of US$ 14,651.20, or 20.41% less, for the problem with a planning horizon of three years. The computational CPU time spent for the problem resolution was of 132.91 seconds plus 61.83 seconds for running the intensive search.
4.3.3 Sensitivity Analysis
With the aim of getting complementary computational tests, a sensitivity analysis is presented in this subsection by making up several scenarios with distinct energy prices for problem test 3. Tables 2 and 3 present three price scenarios for each load level and their respective solutions, as the objective function value and the economy in energy losses obtained over planning horizons of one and three years, respectively. The measure units considered are: the prices, in all load levels, are in US$/MWh and the function values are in US$.
For the results depicted in the Tables 2 and 3, the following initial values of the objective func-tions were found in the first, second and third scenario, respectively: in Table 2, US$ 27,789.19, US$ 38,651.06 and US$ 56,754.19; in Table 3, US$ 102,535.14, US$ 142,614.34 and US$ 209,413.01.
In both tables below, it is possible to observe that the savings obtained in energy losses in-crease with the inin-crease in prices. This result indicates a computational stability of the proposed methodology in relation to the variability of this parameter.
Table 2– Results for three price scenarios and planning horizon of one year.
Level price Solution price Solution price Solution 3 38 f(3)=25,065.40 68 f(3)=33,091.84 118 f(4)=46,080.68 2 58 Savings (%) 88 Savings (%) 138 Savings (%)
1 164 10.09 194 14.67 244 18.80
Table 3– Results for three price scenarios and planning horizon of three years.
Level price Solution price Solution price Solution 3 38 f(6)=77,235.71 68 f(6)=104,001.31 118 f(6)=148,610.64 2 58 Savings (%) 88 Savings (%) 138 Savings (%)
5 DISCUSSION
In all of the tests performed, the branch hierarchization obtained by determining reactive con-sumption, in the initialization phase of the procedure, was of great importance for detecting regions of greater reactive consumption in the network. The three Diversification Strategies proposed and implemented depended on it.
The hierarchization of the buses was fundamental for the efficiency of the Local Search heuristic procedure, which obtained good solutions in just one iteration. This observation may be attested to owing to the fact that application of theIntensification Strategyproduced an improvement of up to 1,6% in the objective function, for any test problem.
TheDiversification Strategiesand theAspiration Criteriaallow for identifying Elite Solutions andPromising Regionsthat aid in choosing the solution whose neighborhood was explored by the Intensification Strategy. Specifically, theReinitialization Strategyadopted by the methodology permitted achieving the best solution for test problem 3 with a planning horizon of one year.
In the tests performed, the proposed methodology pointed out better solutions than those already known: in test 1, the results obtained are better than the solution practiced by CEB – the Bras´ılia Electric Company. In test 2, the solution obtained by the heuristic presented a percentage of loss reduction better than those achieved by Huanget al. (1996) and Gallegoet al. (2001), authors who are quite referenced and who also utilize the Tabu Search procedure to support their work.
In test 3, the results found demonstrated robustness in the methodology proposed in this work, since the system has 802 buses, demanding great computational effort, and the solutions ob-tained, for both planning horizons considered, showed compatibility with the demand necessities of the main feeder in question. Sensitivity analysis of the electric energy prices illustrated that the methodology proposed is stable in relation to this parameter.
The estimation of the upper limit,max, for the number of capacitors to be installed, was of the utmost importance for simplifying computation of the algorithmic procedure in all of its steps. In particular, there was no need to limit the size of theTabu Listdue to the fact that the number was relatively small. In addition, the best solution found was that in which the number of installed capacitors was less or equal to max, indicating that this estimation was compatible with the reactive consumption shown in the test problems utilized.
6 CONCLUSIONS
Computational tests were performed with three test problems: the first small in size, with 46 buses, the second coming from literature with 69 buses, and the third with 802 buses, this last one involving different planning horizons and sensitivity analysis. The results obtained demonstrate that the proposed procedure is able of pointing out solutions that present significant savings in costs and electric energy losses and also has stability in relation to price variation (US$/MWh) for larger size system.
The third test demonstrated that for larger scale problems, the proposed heuristic based on Tabu Search is able to help as a decision support tool identify buses receiving capacitor banks in a way that is more efficient than that practiced.
Just one parameter is utilized by the proposed methodology in this work, particularly in the implementation of theIntensification Strategy. This parameter is easy to work with and was used with a fixed value in the majority of the computational tests.
As an extension to the work presented here, allocation problems which include variable capac-itors will be able to be solved utilizing the methodology proposed here in the first phase. The second phase will be able to be performed taking as the initial solution the solution obtained in the previous phase and applying the Local Search heuristic to it for capacitor banks (fixed and/or variable) at the buses with greater reactive power injection in the network. Implementation of the methodology in more efficient computational language, and tests performed on a PC with a more up-to-date configuration, should improve the CPU time demanded.
REFERENCES
[1] BARANM & WUF. 1989. Optimal capacitor placement on a radial distribution system.IEEE Trans-actions on power Delivery,4(1): 725–733, Jan.
[2] BOONE G & CHIANG H. 1993. Optimal capacitor placement in distribution systems by genetic algorithm.Electric power & Energy Systems,15(3): 155–162.
[3] BUNCH JB, MILLER RD & WHEELER JE. 1982. Distribution system integrated voltage and reactive power control.IEEE Trans., pp. 284–289.
[4] CEB. 2003. Alocac¸˜ao de Bancos de Capacitores Fixos na Rede de Distribuic¸˜ao Prim´aria da CEB. In: Semin´ario Interno de Tecnologia da CEB, Bras´ılia, DF.
[5] CHIANGH, WANGC, COCKINGSO & SHINH. 1990. Optimal capacitor placement in distribution systems, part I and part II.IEEE Trans. Power Delivery,5: 634–649, April.
[6] COELHO MA, BIAGIOMA, SAMPAIO K, CUERVO P & FRAZAO˜ FR. 2005. Implementac¸˜ao de Metodologias de Alocac¸˜ao de Bancos de Capacitores em Alimentadores de 13.8kV. V CIERTEC, Macei´o, Brasil.
[7] DENG Y, REN X, ZHAO C & ZHAO D. 2002. A Heuristic and Algorithmic Approach for Reactive Power Optimization with time-varing Load Demand in Distribution Systems.IEEE Trans-actions on Power Systems, Oct.
[9] GALLEGO RA, MONTICELLI A & ROMERO R. 2001. Optimal Capacitor Placement in Radial Distribution Networks.IEEE Transactions on Power Systems,16(4): Nov.
[10] GLOVERF & LAGUNAM. 2002. Tabu Search. Kluwer Academic Publishers, 5thedition.
[11] HUANGY, YANGH & HUANGC. 1996. Solving the Capacitor Placement Problem in Radial Distri-bution System using Tabu Search Aproach.IEEE Transactions on Power Systems,11(4): Nov.
[12] KAPLAN M. 1984. Optimization of Number, Location, Size, Control Type, and Control Setting of Shunt Capacitors on Radial Distribution Feeders.IEEE Transactions on Power Apparatus and Systems,103(9): Sept.
[13] MIUK, CHIANG H & DARLINGG. 1997. Capacitor placement, replacement and control in large scale distribution systems by a GA-based two-stage algorithm.IEEE Trans. Power Systems,12(3): 1160–1166, Aug.
APPENDIX