Hospital Resource Utilization and Treatment Cost of Skeletal-Related Events
in Patients with Metastatic Breast or Prostate Cancer: Estimation for the
Portuguese National Health System
J. Félix, MSc1,*, V. Andreozzi, PhD2, M. Soares, MSc1, P. Borrego, Pharm D1, H. Gervásio, MD3, A. Moreira, MD4, L. Costa, PhD5, F. Marcelo, MD6, F. Peralta, MD7, I. Furtado8, F. Pina, PhD9, C. Albuquerque, MD10, A. Santos, MD11, J.L. Passos-Coelho, MD4, for the Portuguese Group for the Study of Bone Metastases
1Exigo Consultores, Alhos Vedros, Portugal;2Faculdade de Ciências da Universidade de Lisboa e Centro de Estatística e Aplicações da Universidade de Lisboa, Portugal;3Instituto Português de Oncologia, Coimbra, Portugal;4Instituto Português de Oncologia, Lisboa, Portugal;5Hospital de Santa Maria, Lisboa, Portugal;6Hospital de Santo António, Porto, Portugal;7Maternidade Bissaia Barreto, Coimbra, Portugal;8Hospital Distrital de Faro, Faro, Portugal;9Hospital de São João, Porto, Portugal;10Hospital de São Bernardo, Setúbal, Portugal;11Hospital de São Marcos, Braga, Portugal
A B S T R A C T
Background:Skeletal-related events (SREs) occur frequently in pa-tients with bone metastases as a result of breast (BC) and prostate (PC) cancers. They increase both morbidity and mortality and lead to exten-sive health-care resource utilization.Methods:Health care resource utilization by BC/PC patients with at least one SRE during the preceding 12 months was assessed through retrospective chart review. SRE-treat-ment costs were estimated using the Portuguese Ministry of Health cost database and analyzed using generalized linear models. Results: This study included 152 patients from nine hospitals. The mean (SD) annual SRE-treatment cost per patient was€5963 (€3646) and €5711 (€4347), for BC (n⫽121) and PC (n⫽31) patients, respectively. Mean cost per single episode ranged between €1485 (radiotherapy) and
€13,203 (spinal cord compression). Early onset of bone metastasis (P⫽ 0.03) and diagnosis of bone metastases at or after the occurrence of the first SRE (P⬍0.001) were associated with higher SRE-treatment costs. Conclusion:These results reveal the high hospital SRE-treatment costs, highlighting the need for early diagnosis and treatment, and identify key factors determining the economic value of therapies for patients with skeletal metastases.
Keywords: breast cancer, costs, hospital, prostate cancer, skeletal-related events.
Copyright © 2011, International Society for Pharmacoeconomics and Outcomes Research (ISPOR). Published by Elsevier Inc.
Introduction
Breast (BC) and prostate cancer (PC) are the first- and second-most diagnosed cancers in their respective genders worldwide
[1]. Together they were estimated to account for more than
630,000 deaths in 2002[1]. The socioeconomic implications of BC and PC in developed countries are staggering. Direct treat-ment costs for PC and BC patients account for approximately 20% of cancer care costs in the United States and Europe, and indirect costs may contribute to a similar burden, especially in advanced cancer and the end-of-life settings[2– 4]. In 2005, BC and PC accounted for 16% and 12%, respectively, of cancer deaths in Portugal[5].
Pathologic fracture (PF), spinal cord compression (SCC), surgery to bone (SB), radiation therapy to bone (RT), and hypercalcemia of malignancy (HCM) are common skeletal-related events (SREs) as a consequence of bone metastases[6]. Approximately 65% to 75% of patients with metastatic BC or PC will develop skeletal metastases
[6], and 68% of BC and 49% of PC patients with bone metastases will develop one or more SRE in a time frame of 2 years if not treated with bisphosphonates[7,8].
The onset of SREs is associated with significant morbidity (includ-ing intractable bone pain, impaired mobility, and decreased health-related quality of life [QOL]) and decreased survival[9,10]. Pathologic fractures have been associated with up to a 32% increase in the risk of death in patients with bone metastases from solid tumors[10], and SREs were associated with a 27% decrease in survival among men with metastatic PC[11]. Delaying the onset of the first SRE is an im-portant goal, particularly because of its strong association with cu-mulative events and poor survival[12].
Costs related to SRE treatment add substantially to the overall costs of cancer care in patients with metastatic BC or PC, and may account for more than 50% of their total health care costs[13,14]. Retrospective analyses have shown that total treatment costs for patients with BC who develop SREs may be US$14,000 to US$22,000 higher than for patients without SREs[15].
Bisphosphonates (BPs) have demonstrated efficacy in reducing the incidence of SREs in patients with bone metastases. Intrave-nous BP therapy for the prevention of SREs may reduce the need for expensive health care, particularly when PF, SCC, and the need for RT are prevented[16,17].
The costs of SRE treatment versus prevention using BP ther-apy have not been evaluated previously in the context of the
*Address correspondence to:Jorge Félix, MSc, Av. Humberto Delgado, n°33, 2860-021 Alhos Vedros, Portugal. E-mail:[email protected].
1098-3015/$36.00 – see front matter Copyright © 2011, International Society for Pharmacoeconomics and Outcomes Research (ISPOR). Published by Elsevier Inc.
doi:10.1016/j.jval.2010.11.014
a v a i l a b l e a t w w w . s c i e n c e d i r e c t . c o m
Portuguese National Health Service (PNHS). In order to deter-mine the economic burden of SREs and the economic value of BP utilization, accurate estimation of treatment costs is important. The objective of this study was to determine the SRE-related direct hospital costs and factors determining these costs in Por-tuguese patients with metastatic BC or PC.
Patients and methods
Study design
This was a multicenter, single-country, retrospective descrip-tive study. Publicly funded hospitals in Portugal were ranked using the number of oncology clinical visits in the latest hospi-tal productivity statistics from the Portuguese Ministry of Health[18]. Of the 18 PNHS hospitals with oncology and urology clinical services invited, nine agreed to participate. These in-clude two of the three oncology hospitals and two of the three University hospitals in Portugal. The study protocol was ap-proved by hospital ethics committees, and informed consent was obtained from patients before inclusion. The study and data collection schemes were designed to avoid influencing fu-ture treatment decisions for the included patients.
Patients
Adult patients with bone metastases and at least one SRE in the preceding 12 months were eligible. SREs were defined as pathologic fracture, spinal cord compression, surgery to bone, radiation therapy to bone, or hypercalcemia of malignancy at-tributable by center clinicians to bone metastasis. Initially, pa-tients were required to be alive when their records were re-viewed. However, this criterion was later relaxed because it limited patient accrual. Hence, informed consent could not be obtained for patients who deceased before their records were reviewed. Exclusion criteria were diagnosis of other cancer/s as co-morbidity, pregnancy, and regular follow-up for BC/PC man-agement in more than one hospital (to avoid the same patient being enrolled on the study through two different hospitals). This was important in the context of the Portuguese health sys-tem because patients may be initially diagnosed in general hos-pitals and later transferred to oncology hoshos-pitals.
Data collection
Cancer diagnosis electronic data sets were used (where available) to identify eligible patients. In hospitals without such data sets, RT records and hospital pharmacy records of BP therapy, or paper clinical records (three hospitals), were used. Data for SRE treat-ment were obtained from patients’ hospital records. In order to accommodate inter-hospital variations in the timing of study ap-proval, a period of 1 year (October 2004 to September 2005) was allowed for patient enrollment. Therefore, SREs would have
oc-curred between October 2003 and September 2005, and resource utilization refers to this observation period (Fig. 1).
Clinical data included the date of primary cancer diagnosis, occurrence of first bone metastasis diagnosis, Eastern Coopera-tive Oncology Group (ECOG) performance status at study entry, date of first SRE, number of SREs since diagnosis of bone metas-tasis, and total number of SREs during the observation period. Health care utilization included frequency and duration of hos-pitalization, courses of RT and number of days of treatment, palliative radionuclide therapy (e.g., Sr89and Sm153), diagnostic tests, number and type of clinical visits, and all medications used including BPs.
It is important to note that the data collected pertain to hospi-tal resource utilization only. Patient-reported costs (e.g., over-the-counter analgesics, medical services outside the hospital setting, transportation) and indirect costs related to the loss of productiv-ity or premature death were not included. Because the participat-ing hospitals all belong to the publicly funded PNHS, estimated treatment costs may be lower than costs in other (private) hospi-tals.
Cost estimation
Investigators were not granted direct access to hospital account-ing systems. Therefore, costs for procedures such as hospitaliza-tion, RT, diagnostics, and clinical visits, were estimated using the PNHS price list, which is used by publicly funded hospitals to price services provided to third parties such as private insurers or the Portuguese Civil Servants Health System[19]. Prices for hospital drugs were obtained from the Institute for Financial Management and Informatics (IGIF) price catalog (2003–2005) used by hospitals as a maximum reference price list for acquisition of medications. Resource utilization and costs considered were limited to those related to the treatment of SREs.
Data analysis/modeling
Differences in age, time from cancer diagnosis to bone metastasis, and frequency of diagnosis of bone metastases after SRE onset were assessed usingttest, log-rank test, and chi-square test, re-spectively. The 95% confidence interval for median 12-month SRE-related costs was estimated using the binomial exact method. Non-parametric Wilcox and Kruskal-Wallis tests were used to as-sess differences in total SRE-treatment cost according to patient characteristics. The costs of SRE hospital treatment were modeled assuming two different dependent variables. For the total sample, total SRE-treatment cost was used as the dependent variable. For the BC patients’ sample, SRE-treatment cost excluding the cost of the BPs and its administration was also used as the dependent variable in order to include the type of BP used as a covariate in the model. Generalized linear models (GLMs) with gamma distribution and logarithm link function were fitted to estimate the effects of independent variables in the expected SRE treatment costs[20]. These models allow the measurement of the association
tween independent variables and SRE cost through the expo-nential of regression coefficients (e), while controlling for
pa-tients’ and clinical characteristics. Independent variables approaching the statistical significance level of 0.10 in the bi-variate analysis were included in multibi-variate models. Stan-dardized deviance residuals and likelihood ratio test were used for model diagnostics. All statistical analyses were performed using R software version 2.8[21].
Results
Patient demographics and clinical characteristics
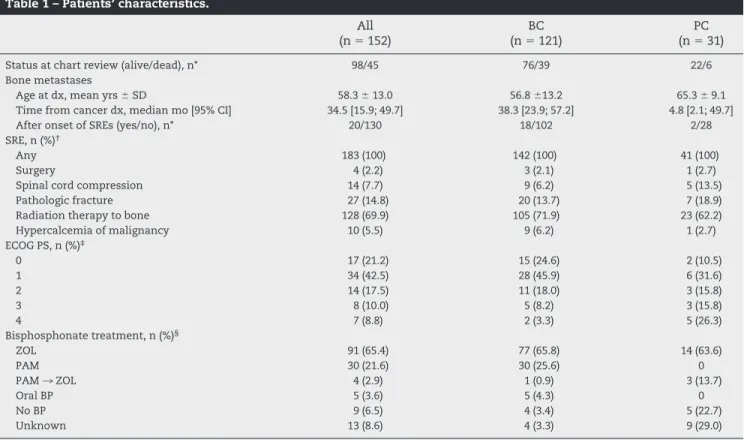
The study enrolled 152 patients with bone metastases from BC (n⫽121) or PC (n⫽31). All patients had experienced at least 1 SRE during the 12-month observation period. Mean (SD) age at diagno-sis of bone metastadiagno-sis was 58.3 (13) years (Table 1). Overall, com-pared with BC, patients with PC were older (P⬍0.001) and had a longer median duration from cancer diagnosis to diagnosis of bone metastasis (38 vs. 5 months,P⬍0.01), a higher frequency of bone metastasis diagnosis after the onset of SREs, (17% vs. 7%,P⬍ 0.01), and worse ECOG performance status (Table 1).
Over the 12-month observation period, 183 SREs were regis-tered, 146 (79.8%) in patients with BC. The mean number of SREs per patient was 1.2 (range: 1 to 3). Radiotherapy to bone was the most frequent SRE (69.9%). Among patients for whom BP utiliza-tion data were available (n⫽139, 13 missing), 65.4% received zole-dronic acid (ZOL), 21.6% received pamidronate (PAM); 2.9%
initi-ated therapy with PAM and later switched to ZOL during the study period, 3.6% received oral BPs, and the remainder (6.5%) were not treated with BPs. At the time of data collection, 98 patients were alive, of whom the majority had a good ECOG performance status (Table 1).
Table 2 – Resource utilization.
N Mean SD
Radioisotopes 5 1.0 —
Clinic visits 152 2.8 3.0
Hospitalization (duration in days) 38 19.7 13.7
Diagnostics* 42 22.0 52
Radiotherapy 118 1.1 0.36
Sessions per treatment 8.38 3.25
Medications†
Analgesic‡ 20 1.35 0.79
IV BP (duration in days) 121 263 63 Oral BP (duration in days) 5 333 34
BP, bisphosphonates; IV, intravenous; SD, standard deviation. * Refers to the number of different diagnostics procedures, including
blood tests, x-ray, computed tomography, magnetic resonance im-aging, scintigraphy, bone densitometry, and bone biopsy.
† Excluding chemotherapy and hormonal therapy for primary cancer. ‡ Morphine or fentanyl.
Table 1 – Patients’ characteristics.
All (n⫽152)
BC (n⫽121)
PC (n⫽31)
Status at chart review (alive/dead), n* 98/45 76/39 22/6
Bone metastases
Age at dx, mean yrs⫾SD 58.3⫾13.0 56.8⫾13.2 65.3⫾9.1
Time from cancer dx, median mo [95% CI] 34.5 [15.9; 49.7] 38.3 [23.9; 57.2] 4.8 [2.1; 49.7]
After onset of SREs (yes/no), n* 20/130 18/102 2/28
SRE, n (%)†
Any 183 (100) 142 (100) 41 (100)
Surgery 4 (2.2) 3 (2.1) 1 (2.7)
Spinal cord compression 14 (7.7) 9 (6.2) 5 (13.5)
Pathologic fracture 27 (14.8) 20 (13.7) 7 (18.9)
Radiation therapy to bone 128 (69.9) 105 (71.9) 23 (62.2)
Hypercalcemia of malignancy 10 (5.5) 9 (6.2) 1 (2.7)
ECOG PS, n (%)‡
0 17 (21.2) 15 (24.6) 2 (10.5)
1 34 (42.5) 28 (45.9) 6 (31.6)
2 14 (17.5) 11 (18.0) 3 (15.8)
3 8 (10.0) 5 (8.2) 3 (15.8)
4 7 (8.8) 2 (3.3) 5 (26.3)
Bisphosphonate treatment, n (%)§
ZOL 91 (65.4) 77 (65.8) 14 (63.6)
PAM 30 (21.6) 30 (25.6) 0
PAM¡ZOL 4 (2.9) 1 (0.9) 3 (13.7)
Oral BP 5 (3.6) 5 (4.3) 0
No BP 9 (6.5) 4 (3.4) 5 (22.7)
Unknown 13 (8.6) 4 (3.3) 9 (29.0)
BC, breast cancer; BP, bisphosphonate; dx, diagnosis; ECOG PS, Eastern Cooperative Oncology Group performance status; mo, months; PAM, pamidronate; PAM¡ZOL, patients initially treated with PAM but switched to ZOL during the observation period; PC, prostate cancer; SD, standard deviation; SRE, skeletal-related event; yrs, years; ZOL, zoledronic acid.
* Numbers of patients do not equal total sample because of missing data for 9 patients.
† Percentage of total SREs (e.g., 183
⫽100% for the total sample).
Resource utilization and SRE-treatment costs
In the total sample (BC⫹PC), 38 (25%) patients were hospitalized
within the 12-month observation period of the study. The mean length of stay was 19.7 days (SD⫽13.7 days; min-max [1– 45]). On
average (SD), each patient (n⫽118) using RT was submitted to 1.1
(0.36) treatments, consisting of 8.4 (3.3) RT sessions. Radiotherapy with Sm153(radioisotope) was used in only five patients. Overall,
86% and 3.3% of patients received IV and oral BPs, with mean treatment duration of 263 and 333 days, respectively (Table 2).
The estimated mean 12-month SRE-related costs per patient were€5963 (median⫽€5105, 95%CI [€4846;€5,321]) and€5711 (me-dian⫽€4723, 95%CI [€3467;€6052]) for patients with BC and PC, respectively. In BC patients the costs of medications (including BPs but excluding chemo/hormonal treatment) accounted for approx-imately 50.8% of the total, whereas hospitalization accounted for the largest proportion of costs (38.8%) in PC patients. Utilization of these two resources together accounted for approximately 70% of total SRE costs in both patient groups (Table 3). The average cost per type of SRE was also examined (Fig. 2). Spinal cord compres-sion was the most expensive (€13,203), whereas RT to bone had the lowest cost (€1485) per episode. Bivariate analyses revealed no
dif-ferences in total SRE costs by cancer type (P⫽0.43), patient status at the time of chart review (alive or dead;P⫽0.11), or age at bone metastasis diagnosis (P⫽0.71). Diagnosis of bone metastasis at or after the onset of SREs was associated with significantly higher costs compared to diagnosis prior to the onset of SREs (mean⫽ €10,363 vs.€5280;P⬍0.01). Other factors influencing total cost of
SRE treatment were poor ECOG performance status
(P⫽0.01) and type of BP used (P⬍0.01). On average, higher costs were associated with patients started on PAM and then switched to ZOL (€11,673) compared with those receiving PAM only (€6767), ZOL only (€681) or no BPs at all (€4757). The bivariate analysis of SRE total costs showed similar results in the “BC patients” subset, whereas the only significant variable in the PC subset was the type of BP.
Modeling of SRE-treatment costs
In the total sample, the expected total SRE cost was€5924 for the reference patient (BC) (Table 4). The independent multiplicative effect of the reported covariates can be found from the exponen-tial coefficient relative to the constant. Thus, with all other
vari-Table 3 – SRE treatment costs by type of resource.
Treatment costs
Breast Prostate
Mean,€ SD Percent of total Mean,€ SD Percent of total
Radioisotopes 14 153 0.2 218 575 3.8
Clinic visits 36 101 0.6 27 53 0.5
Hospitalization 1312 3056 22.0 2213 3993 38.7
Diagnostics 103 370 1.7 83 196 1.5
Radiotherapy 1467 882 24.6 1402 1148 24.5
Medications* 3031 1290 50.8 1768 1668 31.0
Total, mean⫾SD €5963⫾3646 €5711⫾4346
SD, standard deviation; SRE, skeletal-related event. All monetary units are given in Euros (€).
* Including bisphosphonates, but excluding chemotherapy and hormonal therapy.
ables kept constant, diagnosis of bone metastasis after the onset of SREs was associated with a 56% increase in total SRE-treatment costs (P⫽0.002, total cost⫽€9241). Each 12-month increment in
time from cancer diagnosis to diagnosis of bone metastasis was associated with a 2.4% decrease in SRE treatment costs (P⫽0.041). There were no PAM-treated patients in our PC sample. There-fore, modeling SRE treatment costs using the type of IV BP as co-variate was limited to the breast cancer subset. Such modeling of SRE-related costs with and without cost of the BP (Table 5) helps test the hypothesis that drugs with higher acquisition costs may be cost-effective if their use results in subsequent treatment cost offsets and/or improvements in clinical outcomes.
In modeling of SRE-related costs in BC patients, bone metas-tasis diagnosis after the onset of SREs was associated with a 61% increase in total SRE treatment costs (P⬍0.001), and shorter time between cancer diagnosis and bone metastasis was asso-ciated with a 2.1% increment in cost per year decrease. In con-trast to the overall sample, SRE-related treatment costs for pa-tients with BC who were alive at the time of data collection were 22% higher than for patients who died before data collection (P⫽0.031). After controlling for all other variables, PAM treatment was associated with a nonsignificant numeric cost increment of 12% versus ZOL despite the lower procurement cost of PAM. Thus, there were no significant differences in overall treatment costs between the PAM-treated and ZOL-treated groups. However, patients who re-ceived PAM experienced significantly more SREs compared with pa-tients receiving ZOL (1.3 vs. 1.1;P⫽0.04).
A secondary hypothesis-generating analysis excluding the cost of BP therapy in the BC group of our retrospective, obser-vational study estimated an 84% (95%CI [27%; 167%]) increment in the costs of resource use among patients receiving PAM ver-sus ZOL (Table 5). Similar to outcomes from the model including
BP costs, diagnosis of bone metastasis at or after SRE onset was associated with a significant 180% increase in treatment costs (P⬍0.001), whereas longer time between diagnosis of cancer and the development of bone metastasis was associated with a significant 5% reduction per year in SRE-treatment costs (ex-cluding the cost of BPs).
Discussion
To our knowledge, this study is one of the few estimating SRE treat-ment costs in patients being treated in day-to-day clinical practice, and applying statistical techniques for SRE cost modeling while con-trolling for differences in the sample population potentially related to observational retrospective data collection. As with all retrospective studies, however, our study design has certain limitations that might influence the results.
Our study was dependent on hospitals’ willingness to partici-pate. Therefore, both the hospitals and patients are convenience samples. No formal assessment was made to determine the study sample representativeness because raw statistics were not avail-able from public hospitals in Portugal. If we consider, however, medical oncology visits as proxy for hospital activity (i.e., reflect-ing the number of oncology patients treated in each hospital), then our sample can be considered reasonably representative. It in-cluded two thirds of all oncology and university hospitals, ac-counting for 52% and 68% of the medical oncology visits in such institutions, respectively. The remaining were a mixture of major urban-area hospitals (central) and smaller size hospitals, far from large metropolitan areas (responsible for 32% of the oncology vis-its nationwide)[18]. The latter may be underrepresented com-pared with the former. Nationwide, the nine hospitals
partici-Table 4 – GLM modeling of total SRE treatment costs: total sample (n = 107).
 SE Pvalue e (95% CI)
Prostate cancer* 0.239 0.170 0.163 1.27 (0.91; 1.77)
Alive at data collection 0.117 0.104 0.266 1.12 (0.92; 1.38)
Age at bone metastasis, years ⫺0.001 0.004 0.728 1.00 (0.99; 1.01)
Time between cancer diagnosis and bone metastasis, years ⫺0.024 0.012 0.041 0.98 (0.95; 1.00)
Bone metastasis diagnosis after SRE 0.446 0.140 0.002 1.56 (1.19; 2.06)
Constant 8.687 0.235 ⬍0.001 5924 (3736; 9392)
, regression coefficient; CI, confidence interval;e, exponential of the regression coefficient; GLM, generalized linear model; SE, standard error; SRE, skeletal-related event.
* Reference category: Breast cancer patients
Table 5 – GLM modeling of SRE treatment costs: breast cancer patient sample (n = 97).
Total costs Excluding BP costs
 SE Pvalue e (95% CI)  SE Pvalue e (95% CI)
Alive at data collection 0.199 0.092 0.031 1.22 (1.02; 1.46) 0.156 0.179 0.388 1.17 (0.82; 1.66) Age at bone metastasis, years ⫺0.001 0.003 0.867 1.00 (0.99; 1.01) 0.000 0.006 0.942 1.00 (0.99; 1.01) Time between cancer diagnosis and
bone metastasis, years
⫺0.022 0.01 0.036 0.98 (0.96; 1.00) ⫺0.048 0.002 0.031 0.95 (0.91; 0.99)
Bone metastasis diagnosis after SRE 0.476 0.126 ⬍0.001 1.61 (1.26; 2.06) 1.027 0.243 ⬍0.001 2.8 (1.74; 4.49)
PAM* 0.116 0.099 0.241 1.12 (0.93; 1.36) 0.61 0.19 0.002 1.84 (1.27; 2.67)
Oral BP* ⫺1.493 0.214 ⬍0.001 0.22 (0.15; 0.34) ⫺0.505 0.413 0.225 0.6 (0.27; 1.36) Without BP* ⫺0.513 0.249 0.039 0.60 (0.37; 0.98) 0.653 0.478 0.175 1.92 (0.75; 4.90) Constant 8.581 0.212 ⬍0.001 5329 (3519; 8072) 7.583 0.422 ⬍0.001 1964 (859; 4491)
, regression coefficient; BP, bisphosphonate; CI, confidence interval;e, exponential of the regression coefficient (multiplicative effect relative to the reference category); GLM, generalized linear model; PAM, pamidronate; SE, standard error; SRE, skeletal-related event.
pating in our study accounted for approximately 43% of all oncology visits to PNHS hospitals in 2005.
The number and characteristics of patients recruited from each hospital were physicians’ decisions based on study protocol inclusion and exclusion criteria. Therefore, there might have been some selection bias, which could not be controlled for by research-ers. Few hospitals had fully electronic clinical records. Another possible source of bias relates to inter-institution differences in how clinical records were maintained, potentially resulting in im-balanced registration of resource use. The use of regression mod-els including treatment center as a covariate may help minimize these potential biases; however, this was not possible without re-ducing the number of hospitals included in the statistical analysis and compromising overall sample size (five hospitals included contributed⬍10 patients each). Also, there were some important clinical parameters that were not recorded, and therefore could not be included in the model, e.g., non-osseous metastatic disease and bone pain. Thus, these caveats must be kept in mind when interpreting our results.
The 1-year SRE treatment costs estimated in our study are re-markably similar to the costs of SRE treatment reported in other studies conducted in Europe using either hospital records data
[14]or even cost analysis derived from clinical trials[22]. They are somewhat lower than those reported by researchers in the United States using insurance claims databases for cost analy-sis[15,16,23]. For example, in a retrospective analysis from a com-munity and a university hospital in The Netherlands based on chart review of 31 patients with prostate cancer metastatic to bone, it was found that the average total cost of care was around €13,000, of which approximately 50% was attributable to the treat-ment of SREs[14]. In another single-institution study, the total cost incurred by patients with malignant osteolytic bone disease (60% breast cancer, 21% multiple myeloma, and 19% other tumors) amounted to an average of€12,060 with 48% of this cost being incurred during the BP-treatment phase[22]. Two studies from the USA, based on insurance claims data and aiming to estimate the cost of treating SREs in metastatic breast[15]and prostate cancer
[16], reported a 1-year SRE mean treatment cost of US$13,940 and US$12,469, respectively. These costs are roughly equivalent to €9791 and€8758 (1 EURO⫽1.4238 USD, European Central Bank,
June 2, 2009). The differences in SRE costs compared with those from our study may be related to a different mix of SREs as well as to differences in unit costs of health care procedures on both sides of the Atlantic. Compared with the BC population studied by Delea et al.[15], the BC patients in our study received more RT (88% vs. 56%) and had fewer PF (15% vs. 34%). On the other hand, the PC patients experienced an identical proportion of episodes of HCM (0.3% vs. 0.3%), more SCC (13% vs. 8.5%) and similar PF rates (23% vs. 23.4%), versus the study by Lage et al.[16].
Our observations of increased SRE incidence in PAM-treated patients (vs. ZOL) are also consistent with reported outcomes in the BC stratum from the phase III head-to-head trial of PAM versus ZOL in patients with bone lesions from multiple myeloma or BC
[24], as well as the Cochrane meta-analysis of placebo-controlled trials of BPs in metastatic BC[25]. In view of the higher SRE inci-dence in PAM- versus ZOL-treated patients in our study, the in-creased treatment costs (excluding BPs) in the PAM group are not surprising.
In contrast to our results, other studies have reported similar efficacy as well as cost-effectiveness for PAM versus ZOL in the metastatic BC and PC settings[26 –29]. However, in analyses that rely on clinical trial data to estimate cost-effectiveness[26,28,29], the applicability to the real-world setting may be confounded by factors such as higher-than-normal rates of persistence with ther-apy (in the case of oral BPs).
Also in the context of our study, because we limited our patient sample to a small number of tertiary hospitals and a relatively
short duration for accrual, variables such as concomitant chemo-therapy and diagnostic practices may be better controlled for com-pared with analyses based on clinical trial data. In routine clinical practice, persistence rates with daily oral BPs are very low (⬃35% over 6 months in patients with bone metastases)[30]. Therefore, calculations of cost-effectiveness of oral therapies based on SRE-prevention outcomes in clinical trials may substantially overesti-mate true efficacy and cost-effectiveness in normal practice. On the other hand, interpretation of the results from our study is complicated by the unknown effects of retrospective data collec-tion and lack of randomizacollec-tion. Therefore, our findings lack addi-tional validation from prospective pragmatic trials.
Modeling SRE treatment costs using multivariate analysis (GLM) is particularly useful to account for patients and clinical differences arising from the study design. For example, in the modeling analysis of the total sample, each additional year be-tween diagnosis of cancer and development of bone metastasis was independently associated with a 2.4% decrease in SRE costs, after controlling for the other covariates present in the model. On the other hand, diagnosis of bone metastasis at or after SRE onset was associated with a 19% to 106% increase in treatment costs, suggesting that the late diagnosis of bone metastasis may lead to more frequent or more severe SREs, hence increasing resource utilization and costs.
Modeling SRE treatment costs including and excluding the costs of BPs allows for an alternative perspective on the cost dif-ferences in utilization of other health care resources, such as hos-pitalizations, diagnostics, and non-drug treatments (e.g., RT), all of which may vary substantially depending on the BP used to prevent or treat SREs. This perspective is appealing in economic terms because it can reveal different patterns of resource utilization and costs in relation to differences in effectiveness of different agents. In the BC subset, if overall resource use is considered, no differ-ence was observed between ZOL and PAM. However, the higher SRE incidence in PAM-treated patients, combined with the overall high cost of treating SREs, suggests that increased acquisition costs for more expensive agents might be offset by improved ef-fectiveness. Prospective, randomized trials comparing these two BPs in a real-world setting are needed to directly evaluate the dif-ferences between costs and health outcomes with the use of these two BPs in metastatic BC. Such a pragmatic study may also include data collection on bottom-up direct and indirect costs.
The cost estimates for our sample of patients underestimate the true societal costs of SREs for three reasons: 1) no assessment of private and out-of-hospital resource utilization; 2) the retro-spective nature of the study design; and 3) no inclusion of indirect cost.
Our study did not assess private and out-of-hospital resource utilization; therefore, costs incurred by patients and their families are not taken into account. These costs may be important because in contemporary health care management there is a trend to re-strict expensive hospital care to re-strictly necessary aspects, and to discharge patients to ambulatory care as soon as possible[31,32]. Other studies found that these costs can represent a substantial burden[17]and can outweigh inpatient costs[16]. In the context of the Portuguese health care system, private expenditure on health care represents about 30% of the total health expenses[33].
The problems related to retrospective data collection from clin-ical records were more evident in missing data from clinclin-ical visits and diagnostics. In both groups of patients, costs for clinical visits represented less than 1% of the total, and diagnostics represented less than 2%. These are extremely low values compared with other studies wherein these resources contributed to approximately 15% of total costs and up to 43% of the additional costs associated with SREs[14,15].
may also have influenced SRE treatment costs. Close proximity to death has been associated with higher costs of care[34,35], espe-cially for cancer patients[36]. However, in our study no significant differences in SRE treatment costs were observed based on sur-vival at the time data collection was initiated.
Unlike other studies that attempt to account for indirect costs and generate an estimate of total costs (an estimate that inherently has substantial variability), the costs in the present study were calculated by actual resource utilization and cost assigned by the Portuguese Ministry of Health. The exclusion of indirect costs in this analysis is not attempt to minimize their importance. Indirect costs can impose a large burden on society. Nonetheless, their accurate measurement is difficult and prone to considerable subjective variation[37]. Inclusion of only direct costs minimizes variability, allowing better comparison of the costs for each SRE and for mod-eling to determine factors that influence SRE-treatment costs.
Conclusion
This observational, retrospective study analyzed resource use re-lated to SRE from a Portuguese hospital perspective, and identified several factors that may influence the cost of treating and/or pre-venting SREs. Moreover, these results underscore the importance of timely diagnosis and treatment of bone metastases, and high-light the need for a pragmatic prospective evaluation of the most cost-effective BP treatment for patients with skeletal metastases from BC.
Source of financial support: This research was funded by an unrestricted grant from Novartis Oncology Portugal.
Portuguese Group for the Study of Bone Metastases: H. Gervá-sio, MD, M. Marques MD – Instituto Portugués de Oncologia (Coim-bra); J.L. Passos-Coelho, MD, A. Fernandes, MD, A. Moreira, MD, A. Sola, MD – Instituto Portugués de Oncologia (Lisboa); L. Costa, PhD, T. Rodrigues, MD – Hospital de Santa Maria (Lisboa); F. Marcelo, MD, L. Osório, MD – Hospital de Santo António (Porto); O. Campos, MD, F. Peralta, MD – Maternidade Bissaia Barreto (Coimbra); I. Fur-tado, MD – Hospital Distrital de Faro; F. Pina, PhD – Hospital de São João (Porto); C. Albuquerque, MD, A. Canelas, MD – Hospital de São Bernardo (Setúbal); A. Santos, MD, A. Carvalho, MD – Hospital de São Marcos (Braga).
R E F E R E N C E S
[1] Parkin DM, Bray F, Ferlay J, Pisani P. Global cancer statistics, 2002. CA Cancer J Clin 2005;55:74 –108.
[2] Penson DF, Moul JW, Evans CP, et al. The economic burden of metastatic and prostate specific antigen progression in patients with prostate cancer: findings from a retrospective analysis of health plan data. J Urol, 2004;171(6 Pt 1):2250 – 4.
[3] Remak E, Brazil L. Cost of managing women presenting with stage IV breast cancer in the United Kingdom. Br J Cancer 2004;91:77– 83. [4] Will BP, Berthelot JM, Le Petit C, et al. Estimates of the lifetime costs of
breast cancer treatment in Canada. Eur J Cancer 2000;36:724 –35. [5] Direcção-Geral da Saúde. Risco de Morrer em Portugal 2005. Volume II.
2008. Available from:http://www.dgs.pt[Accessed August 27, 2009]. [6] Coleman RE. Skeletal complications of malignancy. Cancer 1997;80(8
Suppl):1588 –94.
[7] Krupski TL, Smith MR, Lee WC, et al. Natural history of bone complications in men with prostate carcinoma initiating androgen deprivation therapy. Cancer 2004;101:541–9.
[8] Manders K, van de Poll-Franse LV, Creemers GJ, et al. Clinical management of women with metastatic breast cancer: a descriptive study according to age group. BMC Cancer 2006;6:179.
[9] Weinfurt KP, Li Y, Castel LD, et al. The significance of skeletal-related events for the health-related quality of life of patients with metastatic prostate cancer. Ann Oncol 2005;16:579 – 84.
[10] Saad F, Lipton A, Cook R, et al. Pathologic fractures correlate with reduced survival in patients with malignant bone disease. Cancer 2007;110:1860 –7.
[11] DePuy V, Anstrom KJ, Castel LD, et al. Effects of skeletal morbidities on longitudinal patient-reported outcomes and survival in patients with metastatic prostate cancer. Support Care Cancer 2007;15:869 –76. [12] Costa L. Bisphosphonates: reducing the risk of skeletal complications
from bone metastasis. Breast 2007;16(Suppl. 3):S16 –20.
[13] Richards MA, Braysher S, Gregory WM, Rubens RD. Advanced breast cancer: use of resources and cost implications. Br J Cancer 1993;67:856 – 60.
[14] Groot MT, Boeken Kruger CG, Pelger RC, Uyl-de Groot CA. Costs of prostate cancer, metastatic to the bone, in the Netherlands. Eur Urol 2003;43:226 –32.
[15] Delea T, McKiernan J, Brandman J, et al. Retrospective study of the effect of skeletal complications on total medical care costs in patients with bone metastases of breast cancer seen in typical clinical practice. J Support Oncol 2006;4:341–7.
[16] Lage MJ, Barber BL, Harrison DJ, Jun S. The cost of treating skeletal-related events in patients with prostate cancer. Am J Manag Care 2008; 14:317–22.
[17] Ross JR, Saunders Y, Edmonds PM, Patel S, et al. A systematic review of the role of bisphosphonates in metastatic disease. Health Technol Assess 2004;8:1–176.
[18] Ministério da Saúde and Instituto de Gestão Informática e Financeira da Saúde. Estatísticas do movimento assistencial 2002-2005. Available from:www.igif.min-saude.pt[Accessed March 22, 2010].
[19] Ministério da Saúde. Portaria n°132/2003 de 5 de Fevereiro. Diário da República I série B. 2003.
[20] McCullagh P, Nelder J. Generalized Linear Models (2nd edition). London: Chapman and Hall, 1989.
[21] R Development Core Team. R: a language and environment for statistical computing. R Foundation for Statistical Computing, Vienna, Austria; 2008 Available from:http://www.R-project.org[Accessed March 22, 2010].
[22] Gessner U, Koeberle D, Thuerlimann B, et al. Economic analysis of terminal care for patients with malignant osteolytic bone disease and pain treated with pamidronate. Support Care Cancer 2000;8:115–22. [23] Hatoum HT, Lin SJ, Smith MR, et al. Zoledronic acid and skeletal
complications in patients with solid tumors and bone metastases: analysis of a national medical claims database. Cancer 2008;113:1438 – 45.
[24] Rosen LS, Gordon D, Kaminski M, et al. Long-term efficacy and safety of zoledronic acid compared with pamidronate disodium in the treatment of skeletal complications in patients with advanced multiple myeloma or breast carcinoma: a randomized, double-blind, multicenter, comparative trial. Cancer 2003;98:1735– 44.
[25] Pavlakis N, Schmidt RL, Stockler MR. Bisphosphonates for breast cancer. Cochrane Database of Systematic Reviews 2005, Issue 3. Art. No.: CD003474. DOI:10.1002/14651858.CD003474.pub2.
[26] Guest JF, Clegg JP, Davie AM, McCloskey E. Costs and consequences of using pamidronate compared with zoledronic acid in the
management of breast cancer patients in the UK. Curr Med Res Opin 2005;21:805–15.
[27] Machado M, Cruz LS, Tannus G, Fonseca M. Efficacy of clodronate, pamidronate, and zoledronate in reducing morbidity and mortality in cancer patients with bone metastasis: a meta-analysis of randomized clinical trials. Clin Ther 2009;31:962–79.
[28] Paterson A, McCloskey E, Redzepovic J, Ott I, Gust R. Cost-effectiveness of oral clodronate compared with oral ibandronate, intravenous zoledronate or intravenous pamidronate in breast cancer patients. J Int Med Res 2008; 36:400–13.
[29] Slof J, Badia X, Lizán L, et al. Zoledronic acid versus pamidronate: cost minimisation in bone metastasis. J Med Econ 2005;8:1–12.
[30] Mangiapane S, Hoer A, Gothe H, et al. Higher persistency with i.v. bisphosphonates in patients with bone metastasis. J Clin Oncol 2006; 24(18 Suppl.):698s [abstract 18623].
[31] Ham C, York N, Sutch S, Shaw R. Hospital bed utilisation in the NHS, Kaiser Permanente, and the US Medicare programme: analysis of routine data. BMJ 2003;327:1257.
[32] Malcolm L. Trends in hospital bed utilisation in New Zealand 1989 to 2006: more or less beds in the future? N Z Med J 2007;120:U2772. [33] Organization for Economic Co-operation and Development.Health at a
glance 2007: OECD indicators. Available from:http://www.oecd.org [Accessed June 18, 2009].
[34] Brown ML, Riley GF, Schussler N, Etzioni R. Estimating health care costs related to cancer treatment from SEER-Medicare data. Med Care 2002;40(8 Suppl):IV-104 –17.
[35] Seshamani M, Gray AM. A longitudinal study of the effects of age and time to death on hospital costs. J Health Econ 2004;23:217–35. [36] Polder JJ, Barendregt JJ, van Oers V. Health care costs in the last year of
life–the Dutch experience. Soc Sci Med 2006;63:1720 –31. [37] Garber AM, Phelps CE. Economic foundations of cost-effectiveness