R E S E A R C H A R T I C L E
Open Access
Transcriptomic comparison between two
Vitis vinifera L. varieties (Trincadeira and
Touriga Nacional) in abiotic stress
conditions
Margarida Rocheta
1†, João L. Coito
1†, Miguel J. N. Ramos
1, Luísa Carvalho
1, Jörg D. Becker
2,
Pablo Carbonell-Bejerano
3and Sara Amâncio
1*Abstract
Background: Predicted climate changes announce an increase of extreme environmental conditions including drought and excessive heat and light in classical viticultural regions. Thus, understanding how grapevine responds to these conditions and how different genotypes can adapt, is crucial for informed decisions on accurate viticultural actions. Global transcriptome analyses are useful for this purpose as the response to these abiotic stresses involves the interplay of complex and diverse cascades of physiological, cellular and molecular events. The main goal of the present work was to evaluate the response to diverse imposed abiotic stresses at the transcriptome level and to compare the response of two grapevine varieties with contrasting physiological trends, Trincadeira (TR) and Touriga Nacional (TN).
Results: Leaf transcriptomic response upon heat, high light and drought treatments in growth room controlled conditions, as well as full irrigation and non-irrigation treatments in the field, was compared in TR and TN using GrapeGene GeneChips®. Breakdown of metabolism in response to all treatments was evidenced by the functional annotation of down-regulated genes. However, circa 30 % of the detected stress-responsive genes are still annotated as «Unknown» function. Selected differentially expressed genes from the GrapeGene GeneChip® were analysed by RT-qPCR in leaves of growth room plants under the combination of individual stresses and of field plants, in both varieties. The transcriptomic results correlated better with those obtained after each individual stress than with the results of plants from field conditions.
Conclusions: From the transcriptomic comparison between the two Portuguese grapevine varieties Trincadeira and Touriga Nacional under abiotic stress main conclusions can be drawn: 1. A different level of tolerance to stress is evidenced by a lower transcriptome reprogramming in TN than in TR. Interestingly, this lack of response in TN associates with its higher adaptation to extreme conditions including environmental conditions in a changing climate; 2. A complex interplay between stress transcriptional cascades is evidenced by antagonistic and, in lower frequency, synergistic effects on gene expression when several stresses are imposed together; 3. The grapevine responses to stress under controlled conditions are not fully extrapolated to the complex vineyard scenario and should be cautiously considered for agronomic management decision purposes.
Keywords: Grapevine, Field Conditions, Controlled Conditions, Microarray, Gene expression, Varietal diversity
* Correspondence:samport@isa.ulisboa.pt †Equal contributors
1Instituto Superior de Agronomia, LEAF, Linking Landscape, Environment,
Agriculture and Food, Universidade de Lisboa, 1349-017 Lisboa, Portugal Full list of author information is available at the end of the article
© 2016 The Author(s). Open Access This article is distributed under the terms of the Creative Commons Attribution 4.0 International License (http://creativecommons.org/licenses/by/4.0/), which permits unrestricted use, distribution, and reproduction in any medium, provided you give appropriate credit to the original author(s) and the source, provide a link to the Creative Commons license, and indicate if changes were made. The Creative Commons Public Domain Dedication waiver (http://creativecommons.org/publicdomain/zero/1.0/) applies to the data made available in this article, unless otherwise stated.
Background
Grapevine (Vitis vinifera L.) is among the most econom-ically important crops worldwide. According to the International Organization of Vine and Wine, in 2013, grapevine occupied more than 7,500 thousand hectares in cultivated areas. Nevertheless, in 2012, wine produc-tion decreased by 6 % in Europe, mainly due to weather conditions (http://www.oiv.int/en/). Although Mediterra-nean regions offer among the best climate conditions for viticulture [1, 2], the soil and atmospheric water deficits along with high summer temperatures can have a nega-tive impact on crop yield and fruit quality [3]. Further-more, it is expected that impending climate changes may significantly impair grapevine production and qual-ity [1, 4, 5].
The major and most relevant abiotic stresses that can affect grapevine production in the Mediterranean region are drought, excessive light and excessive heat [6]. In field conditions it is rare that plants are affected by only one abiotic stress. Plants subjected to drought are usu-ally also affected by heat and, sometimes, by excessive light which can cause photoinhibition [7]. Plants, as ses-sile organisms, are able to set in motion several mecha-nisms to deal with and to overcome environmental constraints. Response to abiotic stress is highly complex and involves the interplay of different responses at plant and cell levels. A cascade of molecular, cellular and physiological events can occur simultaneously and very rapidly. However, experimental approaches show that the processes triggered by each individual abiotic stress differ significantly and show little overlap [7, 8]. In re-cent years, many advances have been made towards un-derstanding how plants respond to abiotic stresses, individually or in combination [9, 10]. Although large amounts of data on the expression of genes related to abiotic stress are available, the challenge now is to con-nect those genetic profiles to changes in plant physi-ology. Concerning grapevines, the varieties Touriga Nacional (TN) and Trincadeira (TR) are known to be among the most important native varieties in Portugal, used to produce high quality red wines. Trincadeira is widely cultivated in the south of Portugal as it grows well in hot, dry and bright areas while TN, formerly cul-tivated in the north of Portugal [11] is nowadays culti-vated throughout the whole Portuguese territory. The choice of these varieties was brought about due to con-trasting physiological responses to stress. Touriga Nacio-nal has a higher capacity to dissipate heat through evaporative cooling and is better adapted to warm cli-mate conditions, as long as no water stress occurs [12]. Upon heat stress, TR is more intensely affected and for a longer period than TN, up-regulating several anti-oxidative stress genes [13]. In addition, a high through-put search for transcriptomic responses increases the
chance of finding key regulatory genes and proteins [7]. Usually the first processes to be affected by abiotic stress are photosynthesis and cell growth with subsequent issues in plant development. These effects can be either
direct, by a decrease in available CO2 due to stomata
closure, or indirect, by the onset of oxidative stress, a secondary effect of most abiotic stresses, which can be deleterious to the photosynthetic machinery and to other cellular mechanisms [7]. All these responses are also described as contributing to acclimation, and then to the alleviation of abiotic stress damage [9, 10, 14, 15]. Recent advances in understanding the response to abi-otic stress have unravelled several cell signalling path-ways interconnected at many levels. They were clearly revealed by approaches using the combination of abiotic stresses [9, 14] which affect the expression of hundreds of genes [8, 16, 17]. Considering transcriptomic micro-array projects in grapevines under abiotic stresses it is possible to quote reports of studies conducted with leaves focusing on heat, cold, drought or excessive light [8, 18–20]. Meanwhile a comparative analysis of grape-vine gene prediction introduced substantial progress in Vitis genome annotation and provided a significant in-centive for novel transcriptomic studies [21]. In the present study, a transcriptomic analysis was performed on leaves of TR and TN in order to compare their re-sponse at gene expression level 1) upon the application of individual abiotic stress treatments (drought, W; heat, H; high light, L) in growth room controlled conditions and 2) upon full irrigation (FI) versus no irrigation (NI) in hot and dry summer field conditions to test for the first time with these varieties, how irrigation can change transcriptomic response. To complement the microarray analysis of the three abiotic stresses, the expression of the most highly up- or down-regulated genes pinpointed through the array was quantified by RT-qPCR in leaves of growth room plants subjected to the combination of the abiotic stresses in pairs or in triplets. The rationale of this experiment was that individual stresses interact with each other after combined application, so the tran-scription of the set of genes that respond to controlled individual, combined or field imposed abiotic stress, was compared in TR and TN grapevine varieties.
Results and discussion
Trincadeira and Touriga Nacional show distinct physiological responses to abiotic stress
In our study, the first approach was to ascertain whether the stress treatments had in fact induced a physiological response. Chlorophyll fluorescence pa-rameters reflect the maximum efficiency of PSII photochemistry in dark- and in light-adapted leaves (respectively, Fv/Fm and F’v/F’m). In growth room ex-periments, these parameters were affected by stress,
suffering significant decreases in both varieties Trincadeira (TR) and Touriga Nacional (TN), although in a unique pattern in each variety (Table 1). Touriga Nacional was more significantly affected by individual stresses than TR while in this variety only double or triple stresses caused significant decreases. Similar in both varieties was the effect of heat stress (H) as in-dividual or combined treatment that indicate a direct influence on the photosynthetic apparatus (Table 1), similar to photosynthesis alteration in situations when drought was combined with other stresses, especially in TR [13, 22]. In field plants, pre-dawn leaf water potential and soil water content, confirmed the severe water stress affecting non irrigated plants in both var-ieties (Fig. 1a and b; Additional file 1). Previous re-sults report that TN can withstand growth in warmer climates with higher levels of irradiance than TR, as long as water is available [12, 23]. In these conditions TN maintains higher photosynthesis rates and chloro-phyll fluorescence parameters than TR, which point to the absence of severe stress in TN [23].
PCA and HCA analysis of microarray gene expression data show differential stress response tendencies
Transcriptome profiling was carried out in Trincadeira (TR) and Touriga Nacional (TN) leaf samples from the six different conditions tested: control, C; water deficit, W; heat, H; high light, L in the growth room, as well as upon full irrigation (FI) and no irrigation (NI) in the field vineyard. Three replicates per sample type as in Material and Methods were analyzed using GrapeGen Genechip microarrays, which represent more than 17 k grapevine unigenes [24].
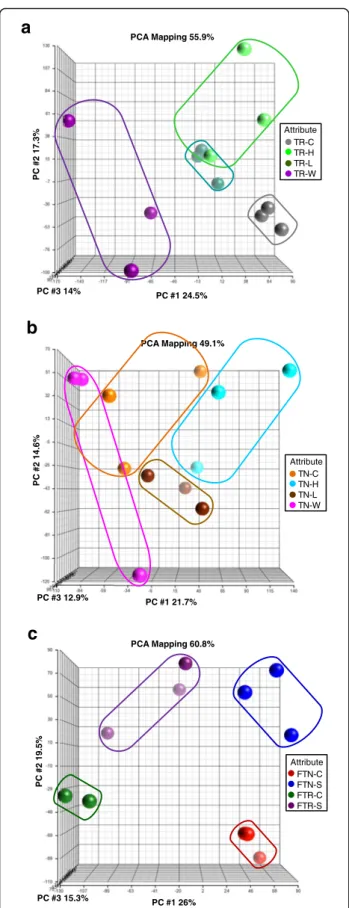
The microarray data was first analysed by means of principal component analysis (PCA) (Fig. 2) and hier-archical clustering analysis (HCA) (Additional file 2) in order to access the similarity of the sample replicates for each treatment and to identify the main sources of gene expression variation [25]. From the PCA of TR samples, the plot of principal component (PC) 1 (24.5 % of the variability) depicts a marked difference between water deficit (W) and the other conditions. Furthermore, a slight separation between control and L stress samples as well as two H stress replicates was observed, so it might be assumed that the strength of the stress re-sponse is explained by PC1 in Trincadeira individual stress (IS) samples. Also for Trincadeira IS samples, PC2 Table 1 Chlorophyll fluorescence parameters measured in
the two grapevine varieties, Touriga Nacional (TN) and Trincadeira (TR) Fv/Fm F’v/F’m TN TR a b c TN TR a b c Control 0.78 0.79 - - a 0.65 0.67 - -0.01 0.01 0.02 0.03 W 0.62 0.69 0.59 0.61 a 0.16 0.09 0.02 0.03 L 0.62 0.56 a 0.49 0.56 a 0.12 0.16 0.09 0.12 H 0.53 0.52 a 0.52 0.47 a 0.14 0.16 0.10 0.14 WL 0.45 0.62 a 0.38 0.51 a a 0.15 0.11 0.14 0.07 WH 0.52 0.55 a a 0.50 0.48 a 0.15 0.13 0.11 0.11 LH 0.57 0.62 a a 0.51 0.63 a a 0.13 0.12 0.08 0.02 WLH 0.57 0.59 a a 0.48 0.48 a a 0.13 0.12 0.08 0.08
Plants were subjected to individual (water, W; light, L; heat, H) and combined stresses (WL; WH; LH; WLH) as indicated in Material and Methods. Fv/Fm
represents the maximum efficiency of PSII photochemistry in darkadapted leaves and F’v/F’mcorresponds to the maximum quantum efficiency of PSII in
light-adapted leaves. Values are accompanied by the respective standard errors. Statistically significant differences after Tukey’s multiple comparison tests for p < 0.05 are the following:a
in column a: significant difference between TN and the respective control;a
in column b: significant difference between TR and the respective control;a
in column c: significant difference between TN and TR within a stress treatment
-1.4 -1.2 -1 -0.8 -0.6 -0.4 -0.2 0 TN TR Wat e r P o te n ti a l ( w) FI NI 0 5 10 15 20 25 Wat e r i n so il (m m) TN NI TN FI TR NI TR FI a b
Fig. 1 Leaf water potential of field plants and soil water content. Field water potential (a,Ψw) in irrigated and non-irrigated plants of Trincadeira and Touriga Nacional before leaf collection. Water present in the soil (b, mm) over duration of the field trial. Blue arrow indicates the time when irrigated plants (FI) started to receive water and green arrow indicates the day when leaves were collected. FI, Full irrigation; NI, Non irrigation. TR, Trincadeira; TN, Touriga Nacional
(17.3 % of the variability) depicts variability within W and H replicates (Fig. 2a). Similarly, hierarchical cluster analysis (HCA) showed a separation between W and all other growth room TR samples. Moreover, HCA showed consistency between replicates in all conditions assayed for TR (Additional file 2). In Touriga Nacional IS sam-ples a high variation was observed within replicates after all treatments except L (Fig. 2b), PC1 explaining 21.7 % and PC2 14.6 % of the differences. The lack of homogen-eity in TN samples can be assigned to a less clear effect of the treatments. This observation is further supported by the HCA (Additional file 2) where the replicates from different conditions did not cluster together. Regarding the PCA of field samples, PC1 (26 % of variation) sepa-rated the varieties and PC2 (19.5 %) the irrigation re-gimes (Fig. 2c). Noticeably, lower response of TR to the field water deprivation treatment is evident in the separ-ation of the samples in PC2. The three replicates of each variety cluster together upon the different experimental conditions, a pattern confirmed in the HCA (Additional file 2). In fact, the HCA showed consistency between replicates of both TN and TR field conditions that in turn were clearly separated from all growth room sam-ples irrespective- of the genotype. The results confirm the different behaviour between TN and TR, which could be explained by the basal tolerance of TN [12, 13]. Differential gene expression response between controlled and field stress conditions
Transcripts significantly changing expression in re-sponse to water deficit (W), heat (H) and high light (L) stress under controlled conditions, as well as field no irrigation (NI) treatment, were searched by com-parison to the respective control samples (5 % False Discovery Rate - FDR). Remarkably, more down- than up-regulated genes were generally detected in re-sponse to individual stresses (ISs) in both varieties (Fig. 3a). However the number of responsive genes was significantly lower in TN in particular after W and L stress, respectively 136 and 318 in TN versus 3042 and 2618 in TR (Fig. 3b). High light and H are the stresses that showed the highest number of gene expression responses shared between the two var-ieties, 31 in total (most of them down-regulated) Attribute TN-C TN-H TN-L TN-W PC #3 12.9% PC #1 21.7% PCA Mapping 49.1% Attribute TR-C TR-H TR-L TR-W PC #3 14% PC #1 24.5% P C #2 17.3% PCA Mapping 55.9% FTN-C FTN-S FTR-C FTR-S Attribute PC #3 15.3% PC #1 26% P C #2 19.5% PCA Mapping 60.8%
a
b
c
P C #2 14.6%Fig. 2 Principal Component Analysis (PCA) of microarray results in growth room and field experiments. The PCA were performed with normalized expression of all the transcripts. a Trincadeira (TR) growth room; b Touriga Nacional (TN) growth room; c Field experiment with both varieties;−C, growth room control; −H, growth room heat stress;−L, growth room high light radiation stress;−W, growth room water deficit. FTN-C, Field full irrigation Touriga Nacional, control; FTN-S, Field non-irrigation Touriga Nacional, stress; FTR-C, Field full irrigation Trincadeira, control; FTR-S, Field non-irrigation Trincadeira, stress
0 500 1000 1500 2000 2500 3000
Up Down Total Up Down Total Up Down Total
Heat Light Water
No genes Growth room TR TN
a
b
Touriga Nacional 657 18 106 6 137 6 161 Water Light Heat Trincadeira 364 178 1741 218 265 905 1230 Water Light Heat 0 200 400 600 800 1000 1200 1400 1600 1800 2000 Up Down Total No genes Field TR TNc
d
1387 564 1058 FTN FTR Down Up Down FTN FTR Up 644 414 228 311 676 711 14 11(Additional file 3). These shared responsive genes code for an ELIP, a heat shock protein (HSP), an ethylene responsive factor (ERF), a nudix hydrolase and a calcium binding protein. It is interesting to highlight the transcripts coding for one zinc finger containing protein, one nudix hidrolase (NUDT17) and two ß-expansin annotated as VviEXPA18 and VviEXLB4 [26] Zinc finger proteins belong to a large eukaryotic TF family sharing CnHn motifs, which are involved in plant growth and development and also in re-sponses to environmental stresses [27]. Three transcripts down-regulated by H and L, in both varieties, share the C3HC4 type Zn-finger (RING-finger) domain. C3HC4 is one of the TF sub-families up-regulated in response to light stress and has been defined as a specific ROS marker [28]. However, studies in grapevine have already shown an opposite response (down-regulation under drought and heat [8], and under high light [18]). The present work further confirms these findings in both studied var-ieties. Nudix hydrolases are ubiquitous enzymes that hydrolyse a large variety of nucleoside diphosphate derivatives [29, 30]. The protein NUDT17 has been associated with biotic stress in Arabidopsis thaliana [31] and recently, a cytoplasm RhNudix1was found to catalyse a step in the pathway for scent monoterpene-sin in roses [32]. Cell wall genes, namely those coding for expansins, pectinesterases, and endoxyloglucan transferases are usually down-regulated in typical abi-otic stress responses when cell division and growth are hindered [33], and thus it is not surprising to find a ß-expansin among the genes down-regulated in both varieties and in two different abiotic stresses (L and H).
The varieties reacted differently in the field experi-ment. In fact, conversely to IS and in agreement with the PCA plot, the total number of differentially expressed genes was slightly higher in TN (1951) than in TR (1622) field plants (Fig. 3c), 311 up-regulated and 228 down-regulated under NI in both varieties (Fig. 3d). The results obtained indicate that, under the same field conditions each variety expressed specific sets of genes, whereas only a minor proportion of the stress response was shared. However, when transcripts responsive to the field NI treatment were directly compared to the IS re-sponsive ones, the results evidenced a variety-dependent response (Additional file 4). In Trincadeira, although the
number of W and L-responsive genes was higher than in NI, only a small proportion of IS and NI-responsive genes overlapped (Additional file 4a–c). Focusing on TN plants we observe a distinct behaviour: a lower number of IS-responsive genes but a higher proportion overlap-ping with the NI responsive ones (Additional file 4d–f). A species-associated response was recently described for desiccated leaves of three Vitis species, which differed in activation of ABA and ethylene signalling pathways ac-cording to their sensitivity or tolerance to drought [34]. A variety-associated response has been previously described for metabolite accumulation in Cabernet Sauvignon and Sangiovese berries [35]. Furthermore a transcriptomic var-ietal specificity comprising 180 novel genes not found in the already sequenced grapevine varieties was identified in the Italian cv. Corvina [36].
Distribution of differentially expressed genes into functional categories is similar in both varieties
Treatment-responsive transcripts were assigned into seven functional categories (Cellular process, Metabolism, Regu-lation, Response to stimulus, Signalling, Transport, and Unknown) according to GrapeGen 12x_v2.1 annotation (http://genomes.cribi.unipd.it/grape/) (Additional file 5). In Trincadeira (TR) under individual stress (IS), most functional categories presented more down- than up-regulated genes. Exceptionally, Response to stimulus and Regulation (in W) and Signalling and Transport (in L) showed more up-regulated genes. Additionally, in H most genes were down-regulated in all functional categories (Additional file 5). These results differ from a previous study with the grapevine variety Aragonez (syn Tempra-nillo) in equivalent IS conditions, where H offered a higher amount of responsive genes as compared to W [8]. With few exceptions, each stress treatment caused a higher number of down-regulated genes in all functional categories, which differs significantly from other studies in which up-regulated genes were prevalent [8, 37]. Metabol-ism was the category including the highest number of down-regulated genes (Additional file 5), consequently metabolism breakdown dominated plant responses.
Despite the fact that TN presented fewer responsive genes in controlled IS conditions when compared with TR (Fig. 3B), the percentage of genes in three relevant functional categories, Response to Stimulus (stress
(See figure on previous page.)
Fig. 3 Differentially expressed genes in growth room and in field experiments. a Number of total, up- or down-regulated genes of the microarray showing significant expression changes after individual stresses in comparison to the control. b Venn diagrams showing the number of genes distinct or common to the different individual stresses. c Number of total, up- or down-regulated genes of the microarray showing significant expression changes in the field trial. d Venn diagrams showing the number of transcripts distinct or common to both varieties (left) and the up or down-regulated transcripts distinct or common to both varieties in the field stress trial in relation to control (right). Heat, High light, Water deficit in Trincadeira (left) and Touriga Nacional (right). Top, up-regulated genes; Bottom, down-regulated genes; TR, Trincadeira; TN, Touriga Nacional; FTN, Field Touriga Nacional; FTR, Field Trincadeira
response), Signalling (hormone and other signalling pathways) and Regulation (transcription factors) was compared between the two varieties (Additional file 6). The functional annotation of up-regulated genes shows that water stress (W) gave the highest percentage in Regulation category in TN and in Signalling category in TR, a contrasting response to the IS treatments between the two varieties. Conversely, Trincadeira under high light (L) and heat (H) showed a higher percentage of up-regulated genes in Regulation. However, both varieties had similar percentages of down-regulated genes upon all stresses (Additional file 6). As a whole, different quantitative and qualitative responses to the IS treat-ments were observed between the two varieties. Trinca-deira activated a greater transcriptome reprogramming than TN to cope with the same environmental condi-tions, namely investing more in enzymes and metabo-lites of the antioxidative system as reported for the same varieties under heat stress [13]. The smallest reprogram-ming in TN is enough to react more rapidly and effi-ciently than TN, confirming the better adaptability of this variety as before [12]. However, when comparing TN and TR under field NI conditions, the percentage of responsive genes annotated in the selected categories tended to be higher than for IS in both varieties, with the exception of down-regulated genes after H stress (Additional file 6). These results evidence the contrast-ing responses of both varieties between controlled and field conditions.
Stress-responsive genes showing the greatest magnitude of change are variety-specific
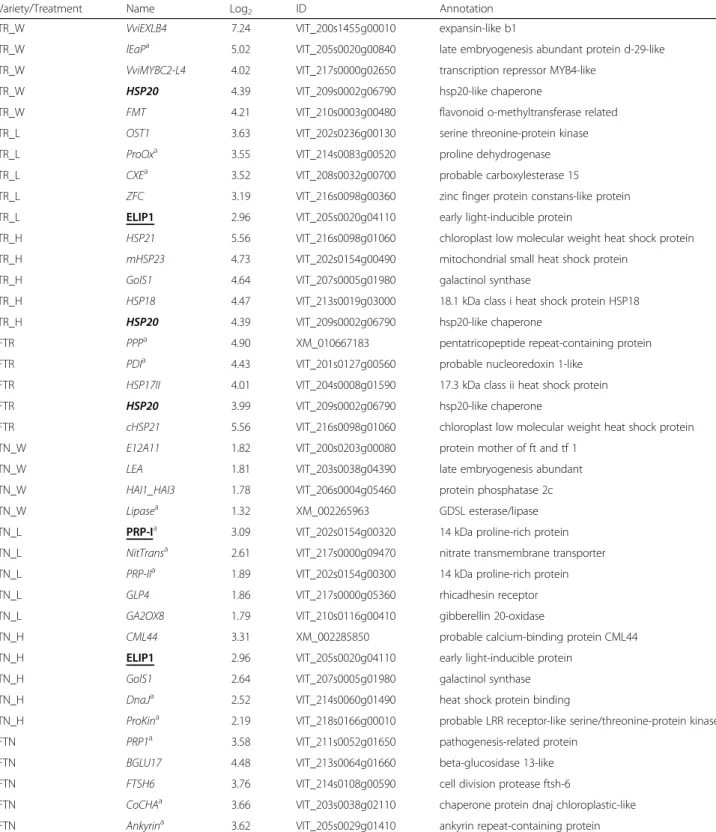
For each variety, circa 30 genes most up- (Table 2) or down-regulated (Table 3), based on the expression fold change (treatment/control) were selected from the microarray. Ten were assigned to each individual stress (IS) treatment (five up and five down-regulated). This se-lection included genes without annotation (Unknown cat-egory in GrapegenDB) when homologous transcripts were identified at NCBI database (http://www.ncbi.nlm.nih.gov/) (Tables 2 and 3; Additional file 7).
When Trincadeira (TR) plants were subjected to water stress (W) (Table 2) the gene VviEXLB4, an
expansin precursor [26] with log2 (fold change) of
seven was the most up-regulated gene (Table 2; Additional files 7 and 8). This gene family has been demonstrated to be highly expressed during the initial phase of drought stress in Arabidopsis [38, 39]. Conversely to TR, VviEXLB4 was not significantly induced in TN, further evidence for the distinct response of this variety to drought. Other greatly up-regulated genes in TR under W include VviMYBC2-L4 [40, 41] and HSP20 both reported to be in-volved in several abiotic stresses including drought and heat [13, 29, 37]. In TR the five most up-regulated genes
after light stress (L) were OST1, ProOx, CXE, ZFC, and ELIP1 (Table 2; Additional files 7 and 8). OST1 belongs to the serine threonine-protein kinase protein class and is in-volved in response to several abiotic stresses [42–44] and CXE codes for a protein with carboxylesterase activity with a role in plant detoxication [45]. In TR under heat stress (H) four of the five most up-regulated genes code for small heat shock proteins (HSPs) (Table 2 and Additional file 7) confirming this family as the most im-portant class of genes responding to heat stress [8, 13]. The fifth gene, GolS1, belongs to the galactinol synthase family previously described as responsive to drought and dehydration [46, 47], as well as, induced by heat in grape-vine berries [48, 49]. Regarding the most down-regulated genes (Table 3), in TR under W stress, two genes coding for cell wall remodelling enzyme were significantly re-pressed: the expansin precursor (VviEXPA18, conversely to the up-regulated VviEXLB4 referred to above) and a
polygalacturonase gene (PG2). Among the
down-regulated transcripts after W stress were a lipase, a CML and a gene coding for a thiazole biosynthetic enzyme (THI1) (Additional file 7). This gene was described as playing an important role in mitochondrial DNA damage tolerance, [50–52], membrane modulation [53], and as be-ing over-expressed under low temperature conditions [37]. The fact that our plants were kept at room temperature (22–25 °C) except in H treatment, can ex-plain the down-regulation of this gene after the H of IS treatment. Under L stress, the most down-regulated genes were assigned to four functional categories: Unknown (BAP2), Metabolism (ASP and NUDT17), Signalling (Clmd) and Regulation (ERF5-1) [54, 55] (Additional file 7). Clmd codes for calmodulin, involved in signaling path-ways through the modulation of the activity of other en-zymes [56]. Under H the most down-regulated genes include the ABA hydrolase CYP707A1, one ethylene re-sponsive factor (ERF-1), a zinc finger ZAT10 (STZ), one cytosolic class-I small heat-shock protein (HSP18) and WRKY46 (Additional file 7). In field NI conditions (F) the most down-regulated genes in TR were within the Metab-olism functional category, two serine carboxypeptidase (SCPL7_scpl18 and scpl16_scpl17), one chalcone synthase (TT4), a gibberellin oxidase (GA20OX1) and a fifth tran-script of the Transport functional category that codes a 14 kDa proline-rich protein also down-regulated in Tour-iga Nacional field NI (Additional file 7).
Focusing on Touriga Nacional (TN) plants, due to the low magnitude of change obtained in the micro-array across the several ISs, some of the five most up (Table 2), or down regulated genes (Table 3) have
log2 (fold change) < 2. Within the four most
up-regulated genes is a late embryogenesis abundant pro-tein transcript (LEA) which is involved in dehydration and desiccation [57, 58]. Under L, the five most
up-Table 2 Up-regulated genes
Variety/Treatment Name Log2 ID Annotation
TR_W VviEXLB4 7.24 VIT_200s1455g00010 expansin-like b1
TR_W lEaPa 5.02 VIT_205s0020g00840 late embryogenesis abundant protein d-29-like TR_W VviMYBC2-L4 4.02 VIT_217s0000g02650 transcription repressor MYB4-like
TR_W HSP20 4.39 VIT_209s0002g06790 hsp20-like chaperone
TR_W FMT 4.21 VIT_210s0003g00480 flavonoid o-methyltransferase related TR_L OST1 3.63 VIT_202s0236g00130 serine threonine-protein kinase
TR_L ProOxa 3.55 VIT_214s0083g00520 proline dehydrogenase
TR_L CXEa 3.52 VIT_208s0032g00700 probable carboxylesterase 15
TR_L ZFC 3.19 VIT_216s0098g00360 zinc finger protein constans-like protein TR_L ELIP1 2.96 VIT_205s0020g04110 early light-inducible protein
TR_H HSP21 5.56 VIT_216s0098g01060 chloroplast low molecular weight heat shock protein TR_H mHSP23 4.73 VIT_202s0154g00490 mitochondrial small heat shock protein
TR_H GolS1 4.64 VIT_207s0005g01980 galactinol synthase
TR_H HSP18 4.47 VIT_213s0019g03000 18.1 kDa class i heat shock protein HSP18
TR_H HSP20 4.39 VIT_209s0002g06790 hsp20-like chaperone
FTR PPPa 4.90 XM_010667183 pentatricopeptide repeat-containing protein FTR PDIa 4.43 VIT_201s0127g00560 probable nucleoredoxin 1-like
FTR HSP17II 4.01 VIT_204s0008g01590 17.3 kDa class ii heat shock protein
FTR HSP20 3.99 VIT_209s0002g06790 hsp20-like chaperone
FTR cHSP21 5.56 VIT_216s0098g01060 chloroplast low molecular weight heat shock protein TN_W E12A11 1.82 VIT_200s0203g00080 protein mother of ft and tf 1
TN_W LEA 1.81 VIT_203s0038g04390 late embryogenesis abundant
TN_W HAI1_HAI3 1.78 VIT_206s0004g05460 protein phosphatase 2c
TN_W Lipasea 1.32 XM_002265963 GDSL esterase/lipase
TN_L PRP-Ia 3.09 VIT_202s0154g00320 14 kDa proline-rich protein TN_L NitTransa 2.61 VIT_217s0000g09470 nitrate transmembrane transporter TN_L PRP-IIa 1.89 VIT_202s0154g00300 14 kDa proline-rich protein
TN_L GLP4 1.86 VIT_217s0000g05360 rhicadhesin receptor
TN_L GA2OX8 1.79 VIT_210s0116g00410 gibberellin 20-oxidase
TN_H CML44 3.31 XM_002285850 probable calcium-binding protein CML44
TN_H ELIP1 2.96 VIT_205s0020g04110 early light-inducible protein
TN_H GolS1 2.64 VIT_207s0005g01980 galactinol synthase
TN_H DnaJa 2.52 VIT_214s0060g01490 heat shock protein binding
TN_H ProKina 2.19 VIT_218s0166g00010 probable LRR receptor-like serine/threonine-protein kinase FTN PRP1a 3.58 VIT_211s0052g01650 pathogenesis-related protein
FTN BGLU17 4.48 VIT_213s0064g01660 beta-glucosidase 13-like
FTN FTSH6 3.76 VIT_214s0108g00590 cell division protease ftsh-6
FTN CoCHAa 3.66 VIT_203s0038g02110 chaperone protein dnaj chloroplastic-like FTN Ankyrina 3.62 VIT_205s0029g01410 ankyrin repeat-containing protein
a
Genes whose short name was attributed by the authors to facilitate writing. The five most up-regulated genes in Trincadeira (TR) and Touriga Nacional (TN) individual stress treatments (IS): Water deficit (W); High light (L); Heat (H); and Field: Trincadeira (FTR), Touriga Nacional (FTN). Name, expression value (in log2gene
expression, ID from 12x_v2.1 (http://genomes.cribi.unipd.it/grape/) or NCBI accession. Genes highlighted in bold represent genes that are shared between treatments and genes highlighted in underline represent genes shared between varieties, in Table2and between Table2and3
regulated genes belong to the Transport or Metabol-ism (Primary and Secondary) functional categories (Additional file 7). Under H, the induced genes have
all log2 (fold change) > 2, CML44, ELIP1 (as in TR L)
and GolS1 (as in TR H), the HSP gene DnaJ and
ProKin, a gene coding a protein kinase (Additional file 7). Of note is the absence of small HSPs.
Considering the TN down-regulated genes (Table 3) in water (W) stress, only two transcripts fulfilled the estab-lished criterion, one being THI1, also a down-regulated Table 3 Down-regulated genes
Variety/Treatment Name Log2 ID Annotation
TR_W LipGDSLa −3.95 XM_002272934 GDSL esterase/lipase
TR_W VviEXPA18 −3.92 VIT_217s0053g00990 expansin
TR_W CMLa −3.73 VIT_218s0001g01630 ef hand family protein TR_W THI1 −3.49 VIT_210s0116g00530 thiazole biosynthetic enzyme
TR_W PG2 −3.47 VIT_201s0127g00850 probable polygalacturonase non-catalytic subunit jp650-like TR_L Clmda −3.58 XM_002277463 putative calcium-binding protein CML19
TR_L ERF5-1 −3.58 VIT_216s0013g00950 ethylene-responsive transcription factor 5
TR_L NUDT17 −3.56 VIT_217s0000g02050 Nudix hydrolase 17
TR_L BAP2a −3.19 VIT_215s0048g02070 BON1-associated protein (BAP2)
TR_L ASP −3.17 VIT_218s0001g07340 aspartyl protease
TR_H STZ −4.38 VIT_218s0001g09230 zinc finger protein ZAT10-like TR_H WRKY46 −4.15 VIT_215s0046g01140 WRKY transcription factor 46 TR_H SRS2 −3.87 VIT_216s0013g00300 ATP-dependent DNA helicase
TR_H ERF-1 −3.86 VIT_202s0234g00130 ethylene-responsive transcription factor 1a TR_H CYP707A1 −3.85 VIT_202s0087g00710 abscisic acid 8-hydroxylase
FTR SCPL7_SCPL18 −4.04 VIT_203s0091g01290 serine carboxypeptidase-like 18-like FTR PRP-Ia −3.64 VIT_202s0154g00320 14 kDa proline-rich protein FTR GA20OX1 −3.32 VIT_216s0022g02310 gibberellin 20-oxidase
FTR TT4 −3.32 VIT_205s0136g00260 Chalcone synthase
FTR SCPL16_SCPL17 −3.18 VIT_203s0088g00260 serine carboxypeptidase-like 18-like TN_W THI1 −3.49 VIT_210s0116g00530 thiazole biosynthetic enzyme TN_W Pepda −1.54 VIT_218s0001g00510 prolyl oligopeptidase-like protein TN_L HSP17 −4.83 VIT_213s0019g02760 17 kDa class i heat shock protein TN_L ERF5-1 −3.62 VIT_216s0013g00950 ethylene-responsive transcription factor 5 TN_L HSP17II −3.43 VIT_204s0008g01500 17 kDa class ii heat shock protein TN_L Clmda −3.58 XM_002277463 putative calcium-binding protein CML19 TN_L HSP18 −3.41 VIT_213s0019g02770 18 kDa class i heat shock protein TN_H SsPa −4.36 VIT_200s0586g00030 stem-specific protein
TN_H XTR6 −3.30 VIT_211s0052g01260 probable xyloglucan endotransglucosylase hydrolase protein TN_H JAZ8 −3.16 VIT_210s0003g03810 protein tify 5a-like
TN_H NUDT17 −3.56 VIT_217s0000g02050 Nudix hydrolase 17
TN_H VviVQ3 −2.87 VIT_202s0025g01280 WRKY transcription factor 41 FTN PRP-Ia −3.64 VIT_202s0154g00320 14 kDa proline-rich protein FTN PYL4 −3.41 VIT_213s0067g01940 abscisic acid receptor pyl4 FTN PRP-36a −3.37 XM_003631687 36.4 kDa proline-rich protein FTN PME61 −3.17 VIT_205s0062g01160 pectinesterase family protein
FTN ZIP2 −3.16 VIT_206s0004g05070 zinc transporter
a
Genes whose short name was attributed by the authors to facilitate writing. The five most down-regulated genes in Trincadeira (TR) and Touriga Nacional (TN) individual stress treatments (IS): Water deficit (W); High light radiation (L); Heat (H); and in the Field: Trincadeira (FTR), Touriga Nacional (FTN). Name, expression value (in log2gene expression), ID from 12x_v2.1 (http://genomes.cribi.unipd.it/grape/) or NCBI accession. Genes highlighted in bold represent genes that are
gene in TR after W. It is interesting to note that the most down-regulated genes found after light (L) are three HSPs, an ERF and a calcium-binding protein (Clmd), both in common with TR L. Under H the most down-regulated genes include XTR6 a gene for a remod-elling cell wall protein, the gene for the same Nudix hydrolase (NUDT17) referred to above as down-regulated in TR under L stress, and the gene VviVQ3, coding for a WRKY-interacting factor [23], that may be implicated in the response to biotic stress in Arabidopsis [59]. Although this WRKY gene isoform was down-regulated in TN under H, other V. vinifera cv. Aragonez WRKY transcription factors responded to drought and heat stress [8]. In TN, the most-responsive genes to the NI field treatment showed changes in expression ranging
between 3.6 and 4.5 log2 (fold change). The most
up-regulated genes were the biotic stress responsive pro-teins (PRP1) and ankyrin repeats protein [60] a β-glucosidase (PHA) a cell division protease (FTSH6) and a co-chaperone HSP (CoCHA). The five most down-regulated genes code for an ABA receptor (PYL4), a pectinesterase, a Zn transporter and two proline-rich proteins (PRP-I and PRP-36) (Additional file 7). Curi-ously, (PRP-I) was up-regulated after L stress as referred above.
Array validation by RT-qPCR
The expression of the five most up- and down-regulated genes selected from the microarray (Tables 2 and 3) were quantified by RT-qPCR in individual stress (IS) and field (F) samples (Additional file 8) in order to assess the correlation between both methods. The obtained correl-ation coefficients were above 0.9 except for Touriga Nacional (TN) under water deficit (W) stress (r = 0.75) and high light (L) stress (r = 0.57) (Additional file 9). In general expression trends measured by microarray and RT-qPCR were the same with few exceptions. Although in Trincadeira (TR) VviMYBC2-L4 was up-regulated by W in the array, it was down-regulated in the RT-qPCR. The four up-regulated transcripts in TN W were down-regulated in the RT-qPCR (Additional file 8). One possible explanation regarding the discrepancy of these
up-regulated genes is the extremely low log2 (fold
change) values, just over the limit value, of TN W genes, which barely fulfilled the established criteria.
Except for drought, less transcriptome reprogramming is activated in Touriga Nacional under combined abiotic stresses
The expression of the genes presented in Tables 2 and 3 was analysed in the leaf samples collected under com-bined stress treatments [water;high light (WL), water;
heat (WH), high light;heat (LH) and water;high
light;heat (WLH)] by RT-qPCR To ascertain the gen-omic response of field (F) NI samples, Trincadeira (TR) and Touriga Nacional (TN) leaves were probed as well (Fig. 4 and 5). The actual experimental approach is ra-ther unique so few results are available so far, only allowing a scarce comparison with our data. Considering TR, the correlation between the values in the respective ISs (W and L) and the combined WL was 0.81. The combined water;high light treatment attenuated the re-sponse observed in W for several genes (VviEXLB4, IEaP, HSP20, FMT, THI1) indicating that water respon-sive genes, including those previously reported [9, 13], have their expression inversed when W and L stresses are imposed simultaneously (Fig. 4a). In contrast WL en-hanced the response of several L up-regulated genes (OST1, CXE, ZFC) (Fig. 4a). Among the down-regulated genes in TR analysed by RT-qPCR, after WL stresses, only thiazole biosynthetic enzyme (THI1) changed its ex-pression pattern. However, down-regulation of THI1 seems to be countered by the simultaneous imposition of WL, becoming up-regulated. THI1 response to W was also mitigated when W and H were combined (Fig. 4b), similarly to the response of H down-regulated genes (WRKY, SRS2, ERF-1 and CYP707A1), although the overall correlation was very high, 0.9. Under LH (Fig. 4c) the response of three L-responsive genes (OST1, CXE and Clmd) and only one H-responsive gene (the H down-regulated ERF-1) were also significantly reverted. Similarly, a broad transcriptome inhibition after drought combined with heat had been shown be-fore in Arabidopsis thaliana plants [9, 61], indicating a reversal of drought responses by heat. The lower down-regulation of ERF-1 and Clmd in the combined LH might reveal more about their functions and interaction regarding environmental responses (see above). Of note is V. pseudoreticulata ERF-1 which showed contrasting transcriptional response to different abiotic stress treat-ments [62]. The low variations in Trincadeira genes after LH treatment made their overall correlation the highest of the tested combined stresses (r = 0.95) (Fig. 4c). This suggests most of the responses to L and H in TR are inde-pendent or similar as reported for Arabidopsis, even though combined high light and heat response only corre-lated strongly with the heat response [63]. When the three individual stresses were combined (WLH) (Fig. 4d) the ex-pression of most W-responsive genes was significantly at-tenuated. High light (L) and heat (H) up-regulated genes showed the same profile under WLH. Where a lower re-sponse of down-regulated genes under IS was generally observed, the overall correlation was still high, 0.92 (Fig. 4d). In TR field (Fig. 4e) samples, many W-responsive genes did not amplify, while the response of most other IS-selected genes decreased with exception of the W and L down-regulated CML, and ASP, respectively,
Water/Light/Heat -8 -6 -4 -2 0 2 4 6 8 10 VviEXLB4 lEaP VviMYBC2 -L4 HSP20 FMT LipGDSL VviEXPA18 CML THI1 PG2
OST1 ProOx CXE ZFC ELIP1 Clmd
ERF5-1 NUDT17 BAP2 ASP Water Light Gene Expression (Log 2 ) -10 -8 -6 -4 -2 0 2 4 6 8 10 VviEXLB4 lEaP VviMYBC2 -L4 HSP20 FMT LipGDSL VviEXPA18 CML THI1 PG2 HSP20 HSP21 HSP23 -MITO GolS1 HSP18 STZ WRKY46 SRS2 ERF -1 CYP707A1 Water Heat Gene Expression (Log 2 ) -6 -4 -2 0 2 4 6 8 10
OST1 ProOx CXE ZFC ELIP1 Clmd
ERF5-1 NUDT17 BAP2 ASP HSP20 HSP21 HSP23 -M IT O GolS1 HSP18 STZ WRKY46 SRS2 ERF -1 CYP707A1 Light Heat Gene Expression (Log 2 ) -8 -6 -4 -2 0 2 4 6 8 10 VviEXLB4 lEaP VviMYBC2 -L4 HSP20 FMT LipGDSL VviEXPA18 CML THI1 PG2 OST1
ProOx CXE ZFC ELIP1 Clmd
ERF5 -1 NUDT17 BAP2 ASP HSP20 HSP21 HSP23 -MITO GolS1 HSP18 STZ WRKY46 SRS2 ERF-1 CYP707A1
Water Light Heat
Gene Expression (Log 2 ) -6 -4 -2 0 2 4 6 8 10 VviEXLB4 lEaP VviMYBC2 -L4 HSP20 FMT LipGDSL VviEXPA18 CML THI1 PG2
OST1 ProOx CXE ZFC ELIP1 Clmd
ERF5 -1 NUDT17 BAP2 ASP HSP20 HSP21 HSP23 -MITO GolS1 HSP18 STZ WRKY46 SRS2 ERF-1 CYP707A1
Water Light Heat
Gene Expression (Log 2 ) r = 0.81 r = 0.9 r = 0.95 r = 0.92 r = 0.45 Water/Light Water/Heat Light/Heat Field
a
b
c
d
e
and the consistently up-regulated HSP20 upon H stress, a low correlation of 0.45 was obtained.
Considering Touriga Nacional (TN), when W and L stresses were combined (Fig. 5a) the expression of W-and L-responsive genes changed significantly. Down-regulation of THI1 and Pepd by W was significantly at-tenuated and L-responsive transcripts exhibited a higher variation. The up-regulated response of NitTrans and HSP17 was enhanced under WL, while the response of four other L up-regulated genes was attenuated or re-versed resulting in r = 0.58 (Fig. 5a). WH combination gave rise to an even higher variation in the W responsive transcripts (Fig. 5b). Considering H-responsive tran-scripts, the expression of two up-regulated genes (GolS1 and DnaJ) was enhanced while the down-regulation of XTR6 and JAZ8 was attenuated. However, the r value in WH was 0.75 (Fig. 5b). Gene expression after LH (Fig. 5c) was consistent with the respective individual stress RT-qPCR values with an r = 0.85, the highest in TN stress combinations (Fig. 5c). Touriga Nacional re-sults confirm that responses to L and H follow the same trend as in TR (above) and Arabidopsis [63]. After WLH treatment (Fig. 5d), all the W and the majority of the L response genes exhibit significantly different expression profiles, while H-responsive genes maintained the same trend. The variation in W and L transcripts caused a low r, 0.35 (Fig. 5d). In TN field NI samples, when the IS transcripts were tested most transcripts did not amplify or their expression was significantly dif-ferent from IS gene expression, resulting in a very low r value, 0.18 (Fig. 5e).
Our results confirm the limited accuracy of extrapolat-ing the effects of individual, or even combined, abiotic stress in controlled conditions to actual plant growth and functioning [10]. Grafted and well rooted grapevine plants growing in the field or potted plants obtained from cuttings in controlled conditions certainly respond differently to environmental changes. Taken together, the above results show how complex the relationship is between gene expression and the environmental setting. However, the experimental set up applied to two geno-types can elucidate unique transcriptomic responses as-sociated with particular tolerance mechanisms after each stress, per variety. Furthermore, our results also show that the grapevine capacity to manage abiotic stress re-sponse is intrinsically variety-linked. While TR responded
clearly to IS treatments and that response was maintained under combined ISs, in TN, the responses varied a great deal under IS combination, especially when W was in-volved. This seems to confirm the higher tolerance of TN, with less transcriptome reprogramming except when water deficit is involved [8, 13].
Transposable elements and grapevine abiotic stress responses
It is known that most genomes comprise transposable elements (TEs) whose activation by stress suggests their role as key players in genome plasticity to survive in ad-verse environments [64, 65]. Grapevine is not an excep-tion with about one fifth of its genome comprising this type of repeats [66]. To gain more information about the Vitis transposable sequences still not characterized, we queried those sequences present in the Unknown func-tional category against a transposable elements database (http://www.girinst.org/). In this query we obtained homologies for 20 % of the sequences with known trans-posable elements (Additional file 10: Figure S1) and we found that TEs are represented within Trincadeira (TR) and Touriga Nacional (TN) stress-responsive genes. The percentage of matches ranged from 28 to 40 % in TR and from 25 % to 36 % in TN (Additional file 10: Table S1). Within TEs, two classes are predominant, DNA transposons and LTR retrotransposons (Additional file 10: Tables S2 and S3).
Clustering the profiles of the expressed TEs using the
k-means algorithm resulted in 8 groups in TR
(Additional file 10: Figure S2) and 7 groups in TN (Additional file 10: Figure S3). These profiles showed that in Trincadeira W stress, 58.8 % of the TEs were down-regulated and 41.2 % were up-regulated while after L more or less the same number of up and down-regulated TEs was obtained. Strikingly, monitoring TEs in field Trincadeira samples (FTR) revealed a burst of activity with 70 % of the TEs up-regulated. The compari-son between TR and TN under IS was somewhat com-promised given the generally low activity in the latter. However, as in TR, 58.7 % TEs in field Touriga Nacional (FTN) showed up-regulation. Although detecting TEs transcripts does not necessary mean that they are trans-posing, we do not rule out the stress-induced TE mobil-ity hypothesis put forward for other species [67, 68] favouring the genetic variability eventually useful for
(See figure on previous page.)
Fig. 4 Gene expression response upon combined abiotic stresses in Trincadeira. Gene expression analysed by RT-qPCR for the five most up- and down-regulated genes when ISs are combined: water:high light (a); water:heat (b); high light:heat (c); water:high light:heat (d); field conditions (e). Colour-code for gene expression according to stress response: water deficit (blue); high light (yellow); heat stress (red); the combination of water deficit, high light and/or heat (dark green) and genes expressed in the field experiment (purple). Grey arrows represent significant statistical differences in gene expression between individual and combined stress treatments under controlled conditions or field experiment, p < 0.05. Log2
-8 -6 -4 -2 0 2 4 6 8 10 Lipase E12A11 LEA HAI1_HAI3 THI1 Pepd PRP -I NitTrans PRP -II GLP4 GA2OX8 Clmd HSP17 ERF5 -1 HSP17II HSP18 Water Light Gene Expression (log 2 ) -8 -6 -4 -2 0 2 4 6 8 10 Lipase E12A11 LEA HAI1_HAI3
THI1 Pepd ELIP1 GolS1
CML44 DnaJ ProKin NUDT17 SsP XTR6 JAZ8 VviVQ3 Water Heat Gene Expression (log 2 ) -8 -6 -4 -2 0 2 4 6 8 10 PRP -I NitTrans PRP -I I GLP4 GA2OX8 Clmd HSP17 ERF5 -1 HSP17II HSP18
ELIP1 GolS1 CML44 DnaJ ProKin
NUDT17 SsP XTR6 JAZ8 VviVQ3 Light Heat Gene Expression (log 2 ) -8 -6 -4 -2 0 2 4 6 8 10 12 Lipase E12A11 LEA HAI1_HAI3 THI1 Pepd PRP -I NitTrans PRP -II GLP4 GA2OX8 Clmd HSP17 ERF5-1 HSP17II HSP18
ELIP1 GolS1 CML44 DnaJ ProKin
NUDT17
SsP
XTR6 JAZ8
VviVQ3
Water Light Heat
Gene Expression (log 2 ) -8 -6 -4 -2 0 2 4 6 8 10 Lipase E12A11 LEA HAI1_HAI3 THI1 Pepd PRP -I NitTrans PRP -I I GLP4 GA2OX8 Clmd HSP17 ERF5-1 HSP17II HSP18
ELIP1 GolS1 CML44 DnaJ ProKin
NUDT17
SsP
XTR6 JAZ8
VviVQ3
Water Light Heat
Gene Expression (log 2 ) r = 0.58 r = 0.75 r = 0.85 r = 0.35 r = 0.18 Water/Light Water/Heat Light/Heat Water/Light/Heat Field
a
b
c
d
e
adaption to a changeable environment [65, 69]. Our data revealed several fragments of TEs (Additional file 10:Figures S4 and S5) that could partially contribute to the plasticity of individual genes, for instance, through new introns, exons, or chimeric genes. These are not rare events, since a high proportion of Angiosperm genes harbour TEs, as ferred for rice where more than 10 % of transcripts are re-ported to contain TEs [70]. We also performed an expression profile analysis of the TEs common to the ap-plied treatments (Additional file 10: Figure S6). The results revealed changes in the expression of some TEs, pointing to stress-induced TE activity, a result that can explain the adaptation to environmental challenges [69, 71]. The mech-anisms involved in activation and repression of TEs in plants are still not clearly understood and are beginning to be unravelled. Our data show that TEs changed expression in a stress-specific manner, suggesting a potential role of TEs in grapevine stress response and adaptation, deserving further investigation.
Conclusions
Microarray data were obtained from leaves of two grape-vine varieties commonly used in Portugal for wine mak-ing, Touriga Nacional (TN) and Trincadeira (TR). They were subjected to individual abiotic stress treatments in growth room controlled conditions and in agronomic field conditions, and confirmed TN as less responsive to abiotic stress imposed in the growth room than TR. Re-garding the combination of individual abiotic stresses, the expression of selected genes was as expected from the individual stresses (ISs), with only a few genes exhi-biting statistically different levels of expression, pointing to antagonist or in lower frequency synergistic interplay between the ISs. Only under the field environmental constraint, when both varieties were compared for full ir-rigation (FI) and no irir-rigation (NI) did Touriga Nacional exhibit an unequivocal transcriptomic response. This re-sult may indicate that TN has a different threshold for the level of stress it can withstand before triggering a re-sponse. A high number of differentially expressed genes were assigned to the Unknown category [21]. It cannot be excluded that several key genes for grapevine stress re-sponse are still with non-described function. An interest-ing fact was that 20 % of the manually re-annotated Unknown category genes were assigned to mobile ele-ments, a significant class in any genome, including
grapevine [66]. Finally, the results allow the conclusions: 1) experiments in controlled conditions still remain a use-ful resource to study the effect of single stresses although correlations to field condition results must be cautious; 2) varieties of the economically important crop grapevine, even when cultivated in common areas under extreme en-vironmental conditions, can display gene expression pro-files evidencing a considerable intra-species diversity of responses to the environment; 3) mobile elements are well represented in grapevine stress-responsive transcriptome but their response to abiotic stress remains mostly un-known, deserving to be studied in depth.
Methods
Growth room plant material and stress treatments Cuttings from pruned wood of selected Vitis vinifera L. plants of the varieties Touriga Nacional (TN) and Trin-cadeira (TR) were grown in 3 l pots in the growth room
under the following controlled conditions: 200 μmol
quanta m−2· s−1 irradiance, 16 h light/8 h dark
photo-period, temperature of 25 °C day/ 23 °C night and well-watered with nutrient solution [72]. The growth room has 72 m2 and is adapted to provide controlled condi-tions of light and temperature.
Individual stresses (ISs) were applied when shoots were 50 to 60 cm high (after circa four months from cuttings planting) always in the middle of the light period, so that sampling took place shortly after that
period. The treatments applied were: W– stop irrigation
until the pre-dawn leaf water potential (Ψw) was −0.9 MPa, value that is consistent with a severe water
stress [73]; high light (L) – 1 h at 2,000 μmol · m2 · s-1;
heat (H) – 1 h at 42 °C (temperature measured at the
surface of the leaf ) provided by a homogenous heat
source; WL – a combination of both L and W; WH – a
combination of both W and H; LH– a combination of L
and H; WLH– a combination of W, L and H. Ψw was
measured with a pressure chamber, Model 600, PMS In-struments Company (Albany, OR). Samples consisted of the first, second and third totally expanded leaves from the shoot apex and were taken 1 h after the start of the stress treatment together with control samples (or, in
the case of WS, when the pre-dawn leafΨwreached the
desired value), frozen in liquid nitrogen and stored at −80 °C until RNA extraction. Chlorophyll a fluorescence was measured using a Pulse Amplitude Modulation
(See figure on previous page.)
Fig. 5 Gene expression response upon combined abiotic stresses in Touriga Nacional. Gene expression analysed by RT-qPCR for the five most up- and down-regulated genes when IS are combined: water:high light (a); water:heat (b); light:heat (c); water:high light:heat (d); field conditions (e). Colour-code for gene expression according to stress response: water deficit (blue); light stress (yellow); heat stress (red); the combination of water deficit, light and/or heat (dark green) and genes expressed in the field experiment (purple). Grey arrows represent significant statistical differences in gene expression between individual and combined treatments under controlled conditions or field experiment, p < 0.05. Log2fold
Fluorometer (mini-PAM, Photosynthesis Yield Analyzer Walz, Germany), with a saturation pulse intensity
ex-tending up to 18000μmol photons m-2 s-1 and actinic
light corresponding to the Photosynthetically Active Radiation (PAR). Dark adaptation for chlorophyll a fluor-escence was performed and the following measurements were undertaken: ground state fluorescence (Fo),
max-imal fluorescence (Fm), variable fluorescence (Fv = Fm–
Fo) and maximum quantum yield of the PSII system
(Fv/Fm = [Fm– Fo]/Fm); together with the light adapted
measurement of F’v/F’m.
Field plant material and irrigation treatment
The field trial plants, Touriga Nacional and Trincadeira, were from the grapevine selection collection, PORVID Association, Pegões, PT (38° 38’ 55 N; −8° 39’ 14 O).
The climate in the Pegões vineyard is Mediterranean with Atlantic influence with hot dry summer days and fresh nights, and mild winters (Additional file 1). The soil is derived from podzols, with a sandy surface layer (0.6–1.0 m) and clay at 1 m depth. Several genotypes of Touriga Nacional and Trincadeira were established in the vineyard. Both varieties were grafted on 1103 Paul-sen rootstock in 2002. The plants are spaced 2.5 m be-tween rows and 1 m within rows and trained on a vertical trellis with a pair of movable foliage wires for upward shoot positioning. In the field, only irrigation was used as treatments, thus two treatments were ap-plied: full irrigated (FI) and non- irrigated (NI). Irriga-tion water in FI treatment was applied with drip
emitters (4.0 L h−1 for FI) two per vine, positioned
30 cm from the vine trunk. The water was supplied ac-cording to the crop’s evapotranspiration (ETc.). Samples were taken simultaneously in both varieties when the pre-dawn leaf water potential was circa −0.7 MPa in the
NI plants and higher than −0.2 MPa in the FI plants
(Fig. 1). Samples consisted of the first and second totally expanded leaves, per plant and per treatment, which were frozen in liquid nitrogen until RNA extraction. RNA extraction
Samples were ground with a mortar and pestle in the presence of liquid nitrogen. Total RNA was extracted using the Spectrum™ Plant Total RNA kit (Sigma-Aldrich, St. Louis, MO, USA). RNA quality and quantity were de-termined using a Nanodrop 2000 spectrophotometer (Thermo Scientific, Wilmington, DE, USA).
Hybridization to Affymetrix GeneChips
Thirty-six samples (three replicates per treatment in-cluding control plants) were analysed at the Genomics Unit of the Spanish National Centre for Biotechnology (CNB-CSIC, Madrid). RNA integrity analyses were done with an Agilent’s Bioanalyzer 2100 using the NanoChip
protocol [8]. The custom GrapeGen Affymetrix Gene-Chip® (A-AFFY-162 and GPL11004 ArrayExpress and GEO accession numbers, respectively) [24], was proc-essed as previously described [74]. Briefly, biotinylated
RNA was prepared from 2μg of total RNA according to
the standard Affymetrix protocol. After the first and sec-ond strand synthesis of cDNA in vitro transcription was performed using T7 RNA polymerase and biotinylated nucleotides, to produce biotin-labeled cRNA. Labelled cRNA was fragmented to the 50–200-bp size range, and each sample was added to a hybridization solution con-taining 100 mM 2-(N-morpholino) ethanesulfonic acid, 1 M Na+, and 20 mM of EDTA in the presence of 0.01 % of Tween-20 to a final cRNA concentration of
0.05μg/ml. Hybridization was performed for 16 h at 45 °C
[8]. Each GeneChip was washed and stained with streptavidin-phycoerythrin in a Fluidics Station 450 (Affy-metrix) following the EukGE-WS2v5 script. After
wash-ing, the chips were scanned at 1.56 μm resolution in a
GeneChip® Scanner 3000 7G System (Affymetrix). The software used was GeneChip Operating Software.
Data analysis
Eight data arrays from a total of 36 samples analysed (eight sample types in three biological replicates) were normalized to a baseline array with median CEL inten-sity by applying an Invariant Set Normalization Method [75]. Normalized CEL intensities of the arrays were used to obtain model-based gene expression indices based on a PM (Perfect Match)-only model [76]. Replicate data (triplicates) were weighted gene-wise by using inverse squared standard error as weights and analysed using the DNA-Chip Analyzer software. It allows assessment for expression indexes and calculation confidence inter-vals for fold changes. A lower confidence bound (LCB) cutoff between 1.2 and 1.3 was used to assess differen-tially expressed genes with a median False Discovery Rate (FDR) < 5 % [76].
All transcripts were annotated following 12x_v2.1 draft annotation of the grapevine genome [21] allowing 70 % of the genes to be identified within the 12x_v2.1 assembly reference genome. A gene was declared to be differentially expressed in a given condition only when it had a pres-ence call in all three replicates. The subsequent validation of this approach was performed by RT-qPCR.
Microarray data analysed in this study have been submit-ted to the Gene Expression Omnibus (GEO) database (www.ncbi.nlm.nih.gov/geo/) under the number GSE57669. Principal component analysis (PCA)
PCA projects high-dimensional data into lower dimen-sions by summarizing the variation of a high number of variables to a reduced number of principal components, and calculates the proportion of variation explained by
each principal component [77]. Individual replicates of samples were projected into a three-dimensional space (http://www.partek.com/pgs) according to their expres-sion data. The first three principal components were plotted.
cDNA synthesis for RT-qPCR
Nucleic acid concentration of each sample was quan-tified by spectrophotometry using the software Gen5 1.09 (Synergy HT, Bio-Tek Instruments, Winooski, USA). Total RNA quality was assessed using the
A260/A280 and A260/A230. Only RNA samples with
A260/A280 between 1.8 and 2.1 and A260/A230
be-tween 2.0 and 2.2 were used. Total RNA integrity was checked through 1 % agarose gel electrophoresis under denaturing conditions (data not shown). RNA samples were treated with RQ1 RNase-Free DNase (Promega, Madison, WI, USA). cDNA was
synthe-sized from 2 μg of total RNA using oligo(dT)20 in a
20 μL-reaction volume using RevertAid Reverse
Transcriptase (Fermentas Life Science, Helsingborg,
Sweden) according to the manufacturer’s
recommen-dations. cDNA was stored at −20 °C until further
use.
Gene selection for microarray validation and primer design
Genes for the microarray validation were selected from the five most highly up-regulated genes and five most highly down-regulated genes for each variety/
treatment (log2 [treatment/control] fold change higher
than 2 or lower than −2). Deviations from this
principle occurred when there was no NCBI accession number for the selected gene plus its functional cat-egory and annotation was unknown/no hit or re-peated in the other five selected genes. In these cases, subsequent genes were selected providing their
ex-pression (in log2) was higher/lower than 2/-2. In
Touriga Nacional (TN) under water (W) and light (L) stress the amount of transcripts was small and there were few or none with expression above or lower than 2/-2 therefore the most up or down-regulated genes were chosen. This resulted in a total selection
of 65 genes across varieties/treatments (32
up-regulated and 33 down-up-regulated). Primers for these genes were designed using the software Primer Prem-ier 5.0 (PremPrem-ier Biosoft International) using a primer length of 20 ± 2 bp, melting temperature of 60 °C ± 2 °C, a guanine-cytosine content of circa 50 % and an expected amplicon size of 180–280 bp (Additional file 11). We also checked, in silico, primer specificity compared to the grapevine 12x_v2.1 assembly refer-ence genome (http://genomes.cribi.unipd.it/grape/).
Real-Time qPCR
The primer selection for RT-qPCR is of the utmost im-portance [78]. So we adopted primers and microarray probes to target the same exon to avoid possible bias in-troduced by the secondary structure of the cDNA [79] or by differential splicing. Special attention was also paid
to the selection of the internal references and
normalization methods, since they can influence the re-sults significantly [80]. The real-time qPCR was per-formed in 96 well white reaction plates (Bio-Rad, Hercules, CA), using an IQ5 Real Time PCR (Bio-Rad, Hercules, CA) with three biological replicates and two
technical replicates. The 20 μL reaction mixture was
composed of 1μL cDNA diluted 50-fold, 0.5 μM of each
gene-specific primer and 10μL master mix
(SsoFast_Eva-Green Supermix, Bio-Rad, Hercules, CA). Amplification of PCR products was monitored via intercalation of Eva-Green (included in the master mix). The following pro-gram was applied: initial polymerase activation, 95 °C, 3 min; then 40 cycles at 94 °C 10 s (denaturation), 60 °C 20 s (annealing), 72 °C 15 s (extension), followed by a melting curve analysis to confirm the correct amplification of target gene fragments and the lack of primer dimmers. The PCR products were run on 2 % agarose gels to make sure that there was only one amplicon of the expected size. PCRs with each primer pair were also performed on samples lacking cDNA template, in triplicate (no template controls). To assess amplification efficiency of the candate genes, identical volumes of cDNA samples were di-luted and used to generate five-point standard curves based on a five-fold dilution series (1; 1:5; 1:25; 1:125; 1:625), in triplicate. Amplification efficiency (E) is
calcu-lated as E = 10(−1/a)-1, “a” being the slope of the linear
regression curve (y = a log(x) + b) fitted over the log-transformed data of the input cDNA dilution (y) plotted against the respective quantification cycle (Cq) values (x). E-values of the target genes were considered comparable when they did not exceed 100 ± 10 %, corresponding to a standard curve slope of 3.3 ± 0.33. All cDNA samples were diluted 50 fold and were amplified in duplicate in two in-dependent PCR runs.
To generate a baseline-subtracted plot of the logarith-mic increase in fluorescence signal (ΔRn) versus cycle number, baseline data were collected between cycles 5
and 17. All amplification plots were analysed with an Rn
threshold of 0.2 at the beginning of the region of expo-nential amplification, to obtain Cq (quantification cycle) and the data obtained were exported into a MS Excel workbook (Microsoft Inc., USA) for analysis. Reference genes used were ACT, TIF and TIF-GTP [80].
Statistical analysis of Real-time qPCR
For the relation between the expressions of the selected genes and the reference genes the relative quantity
values were transformed into log2 (thus rendering them
parametric) and tested through ANOVA in the program SAS 9 (for Windows, SAS Institute Inc., Cary, NC, USA). When the p value of the ANOVA was lower than 0.05 a Tukey test was performed and statistically significant differences were accepted for a p value lower than 0.05.
Additional files
Additional file 1: Maximal, medium and minimal temperatures and precipitation at Pegões Experimental Station (38° 38’ 55 N; −8° 39’ 14 W). (PDF 223 kb)
Additional file 2: Hierarchical cluster analysis (HCA) of microarray results for both varieties, Trincadeira and Touriga Nacional. (PDF 63 kb) Additional file 3: Gene expression responses shared between the two varieties under high light and heat. TN, Touriga Nacional; TR, Trincadeira; H, heat stress; L, high light stress. (XLSX 14 kb)
Additional file 4: Genes exclusive and shared between field and growth room controlled stress treatments. (PDF 157 kb)
Additional file 5: Distribution in functional categories of differentially expressed genes in growth room and field experiments. (PDF 302 kb) Additional file 6: Percentage of genes expressed after Heat, Light and Water stress growth room treatments in Trincadeira and Touriga Nacional plants in three selected functional categories. (PDF 290 kb)
Additional file 7: Functional categories of the selected up-and down-regulated genes. (XLSX 19 kb)
Additional file 8: Validation of the microarray gene expression by RT-qPCR. (PDF 31 kb)
Additional file 9: Correlation between the gene expression from the microarray and RT-qPCR analysis. (PDF 141 kb)
Additional file 10: Analyses of responsive transcripts in the Unknown Functional Category. (PDF 453 kb)
Additional file 11: Primers used for amplification of up- and down-regulated genes by RT-qPCR. (XLSX 13 kb)
Abbreviations
ABA:Abscisic acid; ACT: Actin gene; C: Control sample; °C: Degrees Celsius; ELIP: Early Light-Inducible Protein; FDR: False Discovery Rate; FI: Full irrigation; FTN: Field Touriga Nacional; FTR: Field Trincadeira; h: Hours; H: Heat; HCA: Hierarchical clustering analysis; IS: Individual stress; L: High light; LH: High light;heat; LTR: Long terminal repeats; m: Meter; MPa: Mega Pascal; NI: No irrigation; PCA: Principal component analysis; PC1: Principal component 1; PC2: Principal component 2; PSII: Photosystem II; RT-qPCR: Quantitative reverse transcriptase-polymerase chain reaction; TEs: Transposable elements; TF: Transcription factor; TIF: Translation initiation factor eIF-3 subunit 4; TIF-GTP: Translation initiation factor eIF-2B alpha subunit; TN: Touriga Nacional; TN H: Touriga Nacional Heat stress; TN L: Touriga Nacional High Light stress; TN W: Touriga Nacional Water stress; TR: Trincadeira; TR H: Trincadeira Heat stress; TR L: Trincadeira High Light stress; TR W: Trincadeira Water stress; W: Drought stress; WH: Water;heat stress; WL: Water;high light stress; WLH: Water;high light;heat stress Acknowledgements
The authors would like to thank Jose Miguel Zapater from Genomics Unit of the Spanish National Centre for Biotechnology (CNB-CSIC, Madrid). The field work was performed at PORVID Association (Pegões, PT) and the authors thank the president of its executive board, Prof. Antero Martins. Funding
The research was funded by Fundação para a Ciência e Tecnologia (FCT): project PTDC/AGR-GPL/099624/2008; LEAF (UID/AGR/04129/2013); the post-doc grants SFRH/BPD/64905/2009 to MR and SFRH/BPD/85767/2012 to LC and PhD grants SFRH/BD/85824/2012 to JLC and SFRH/BD/110274/2015 to MJNR.
Availability of data and materials
The microarray sets supporting the results of this article have been submitted to the Gene Expression Omnibus (GEO) database (www.ncbi.nlm.nih.gov/geo/) under the number GSE57669. Authors’ contributions
MR and SA conceived the study. MR and JDB performed the array analysis. JLC and LC carried out the experimental work. MR and MJNR performed the bioinformatics analysis. MR, JLC, LC drafted the manuscript. PCB and SA contributed to the revised and final version of the manuscript. All authors read and approved the final version of the manuscript.
Competing interests
The authors declare that they have no competing interests. Consent for publication
Not applicable.
Ethics approval and consent to participate Not applicable.
Author details
1Instituto Superior de Agronomia, LEAF, Linking Landscape, Environment,
Agriculture and Food, Universidade de Lisboa, 1349-017 Lisboa, Portugal.
2Instituto Gulbenkian de Ciência, 2780-156 Oeiras, Portugal.3Instituto de
Ciencias de la Vid y del Vino, CSIC-Universidad de La Rioja-Gobierno de la Rioja, 26007 Logroño, Spain.
Received: 31 May 2016 Accepted: 28 September 2016
References
1. Jones GV, White MA, Owen RC, Storchmann C. Climate change and global wine quality. Clim Change. 2005;73:319–43.
2. Chaves MM, Flexas J, Pinheiro C. Photosynthesis under drought and salt stress: regulation mechanisms from whole plant to cell. Ann Bot. 2009;103:551–60.
3. Chaves MM, Santos TP, Souza CR, Ortuño MF, Rodrigues ML, Lopes CM, et al. Deficit irrigation in grapevine improves water-use efficiency while controlling vigour and production quality. Ann Appl Biol. 2007;150:237–52. 4. White MA, Diffenbaugh NS, Jones GV, Pal JS, Giorgi F. Extreme heat reduces
and shifts United States premium wine production in the 21st century. Proc Natl Acad Sci U S A. 2006;103(30):11217–22.
5. Hannah L, Roehrdanz PR, Ikegami M, Shepard AV, Shaw MR, Tabor G, et al. Climate change, wine, and conservation. Proc Natl Acad Sci U S A. 2013;110(17):6907–12.
6. Chaves M, Zarrouk O, Francisco R, Costa J, Santos T, Regalado A, et al. Grapevine under deficit irrigation: hints from physiological and molecular data. Ann Bot. 2010;105(5):661–76.
7. Cramer GR. Abiotic stress and plant responses from the whole vine to the genes. Aust J Grape Wine Res. 2010;16:86–93.
8. Rocheta M, Becker JD, Coito JL, Carvalho L, Amancio S. Heat and water stress induce unique transcriptional signatures of heat-shock proteins and transcription factors in grapevine. Funct Integr Genomics. 2014;14(1):135–48. 9. Rizhsky L, Liang H, Shuman J, Shulaev V, Davletova S, Mittler R. When
defense pathways collide. The response of Arabidopsis to a combination of drought and heat stress. Plant Physiol. 2004;134(4):1683–96.
10. Mittler R. Abiotic stress, the field environment and stress combination. Trends Plant Sci. 2006;11:15–9.
11. Agudelo-Romero P, Erban A, Sousa L, Pais MS, Kopka J, Fortes AM. Search for transcriptional and metabolic markers of grape pre-ripening and ripening and insights into specific aroma development in three Portuguese cultivars. PLoS One. 2013;8, e60422.
12. Costa JM, Ortuño MF, Lopes CM, Chaves MM. Grapevine varieties exhibiting differences in stomatal response to water deficit. Funct Plant Biol. 2012;39(3):179–89.
13. Carvalho LC, Coito JL, Colaço S, Sangiogo M, Amancio S. Heat stress in grapevine: the pros and cons of acclimation. Plant Cell Environ. 2015;38(4):777–89.
14. Rizhsky L, Hongjian L, Mittler R. The combined effect of drought stress and heat shock on gene expression in tobacco. Plant Physiol. 2002;130:1143–51.