João Pedro Coias Vieira
Bachelor of Sciences in Micro and Nanotechnologies Engineering
Optical coherence tomography for the evaluation
of vulnerable plaques with nanoprobes
Dissertation submitted in partial fulfillment of the requirements for the degree of
Master of Science in
Micro and Nanotechnologies Engineering
Adviser: Doctor Mariana Torres Carvalho, Research Engineer, International Iberian Nanotechnology Laboratory Co-adviser: Doctor José Ricardo Ramos Franco Tavares,
Full Professor, NOVA University of Lisbon
Examination Committee Chair: Prof. Dr. Rodrigo Ferrão de Paiva Martins
Rapporteur: Prof. Dr. Rui Alberto Garção Barreira do Nascimento Igreja Members: Prof. Dr. José Ricardo Ramos Franco Tavares
Dra. Mariana Torres Carvalho
Optical coherence tomography for the evaluation of vulnerable plaques with nanoprobes
Copyright © João Pedro Coias Vieira, Faculdade de Ciências e Tecnologia, Universidade NOVA de Lisboa.
A Faculdade de Ciências e Tecnologia e a Universidade NOVA de Lisboa têm o direito, perpétuo e sem limites geográficos, de arquivar e publicar esta dissertação através de exemplares impressos reproduzidos em papel ou de forma digital, ou por qualquer outro meio conhecido ou que venha a ser inventado, e de a divulgar através de repositórios científicos e de admitir a sua cópia e distribuição com objetivos educacionais ou de inves-tigação, não comerciais, desde que seja dado crédito ao autor e editor.
This document was created using the (pdf)LATEX processor, based on the “novathesis” template[1], developed at the Dep. Informática of FCT-NOVA [2].
“Pedras no caminho? Eu guardo todas. Um dia vou construir um castelo.” — Nemo Nox
Acknowledgements
I wish to express my thanks to all those who have in any way allowed this thesis to come true.
Firstly I want to thank Dr. Mariana Torres Carvalho of the International Iberian Nan-otechnology Laboratory, for letting me be part of her working group and having believed in me and my abilities.
Thank you also for the theme of the work, that has always attracted me, which most of the time managed to help overcome the difficulties that arose. I am also grateful for the freedom of action that was decisive for this work to contribute to my personal development. To my friend and lab partner Sara Fonseca, for all the help and company during all this months which allowed us both to grow.
I would also like to thank Prof. José Ricardo Ramos Franco Tavares, from the Faculty of Science and Technology of the NOVA university of Lisbon, the conversations that, one way or another, always gave important practical results.
I also appreciate the simple, correct and scientific way that has always approached our working meetings without never allowing the discouragement to settle in.
To Dr. Carlos Galvão Braga at the Cardiology Department of Hospital of Braga and Dr. Victor A. Jimenez Diaz team at the Cardiology Department of Hospital Alvaro Cun-queiro of Vigo, thank you for your permission and availability in conducting tests at each of their facilities using the clinical OCT systems and also the exchange of impressions which were extremely helpful to me.
To Andrea Cruz, research fellow at INL, for all the help and discussions regarding the biotinylation of the antibodies.
To Sara Abalde-Cela and Alexandra Teixeira, from the microfluidics group at INL, for all the help and availability in the synthesis of the gold nanostars.
To all the amazing people that I’ve met and were part of my stay at INL, in Braga, thank you so much for all the great and fun moments, and for always pushing me to challenge myself. Without you guys it would have been way more tedious.
Um agradecimento a todo o corpo docente do DCM, em especial ao Prof. Rodrigo Martins e à Prof. Elvira Fortunato sem os quais este curso não existiria. Aos professores Pedro Barquinha e Daniela Gomes e às responsáveis pelos laboratórios no CENIMAT Alexandra Gonçalves e Sónia Pereira, um muito obrigado por toda a ajuda que me deram, não só nesta tese como em tantos outros projectos e pelo bom espírito de equipa que se nota por todo o CENIMAT. Tornaram o meu primeiro contacto com o mundo da investigação deveras inesquécivel.
À Inês e Pina, minhas amigas de sempre e para sempre, agradeço as longas conversas, as melhores aventuras e a preocupação com que sempre tiveram comigo.
Ao grande Success, Açoriana, Ferreira, Castelo, Mariana e Luís, que venham daí muitos mais convívios. Vocês são grandes!
Aos meus maravilhosos amigos Marta, Alexandra, Diogo, Mariana, Rodrigo e Pedro pelos anos de amizade e partilha de momentos, obrigado por tudo.
E, finalmente agradeço à minha família, que sem eles nunca teria conseguido chegar onde cheguei:
Aos meus avós, pelo infindável carinho. Ao meu avô, professor e amigo, que tanto me acompanhou.
À minha tia, tanto pelo apoio, como pelos miminhos e carregamentos que ajudaram sempre a encurtar a distância onde quer que tenha estado.
Ao meu pai pela atenção e sólida formação dada e à minha mãe que decerto teria ficado muito feliz por este momento.
Os meus eternos agradecimentos. A eles dedico este trabalho.
Abstract
This project aims to design and develop a robust diagnostic intravascular imaging system forin situ detection of labeled coronary vulnerable plaques, consisting in the integration
of targeted nano-probes with a novel protocol for IV-OCT (Intravascular optical coherence tomography) imaging, to analyze anatomical and molecular features of plaques with high precision, sensitivity and specificity.
This approach to molecular imaging using IV-OCT focuses primarily in the inves-tigation of possible contrast agents. Thus, this study is composed, in addition to their functionalization, by the comparison of gold nanostars and Poly(n-butyl cyanoacrylate) (PBCA) microbubbles as possible candidates. The results show a special attention to PBCA microbbubles being that they exhibited the most noticeable scattering e↵ect lead-ing to more valuable imaglead-ing.
A three-dimensional structured tissue-mimicking phantom was also presented for use in IV-OCT. The phantom was fabricated from a PDMS matrix and titanium dioxide additive, capable of producing a wide variety of scattering densities. We describe the fabrication, characterization and IV-OCT imaging of these phantoms and demonstrate their utility in functionalization with two types of contrast agents.
Finally, commercial Endothelium-targeted PBCA microbubbles (Fujifilm Visualson-ics) were tested using clinical IV-OCT systems inpost mortem human arteries allowing its
unequivocal location in the sample. The results present the first steps towards adding to the routinely used IV-OCT a new functionality.
Dissertation goals: Contrast agent-aided molecular imaging process. The direct visual-ization of endogenous disease markers in the body is nonexistent as it is not possible to distinguish from surrounding tissue using OCT imaging. The proposed method rests in the use of exogenous contrast agents with the specificity to bind to the target in question. Image designed in Adobe Illustrator®.
Keywords: Gold nanoparticles, Molecular Imaging of atherosclerosis, Nanotechnology, OCT intravascular imaging, PBCA microbubbles, Targeted nano-probes.
Resumo
Este projeto tem como objetivo delinear e desenvolver um sistema robusto de diagnóstico por imagem intravascular para a deteção in situ de placas coronárias vulneráveis, que
consiste na integração de nano-sondas endereçadas a bio-marcadores característicos da doença com um novo protocolo de imagem intravascular por tomografia de coerência ótica (IV-OCT). Conseguindo assim analisar características anatómicas e moleculares das placas com alta precisão, sensibilidade e especificidade.
Esta abordagem de imagem molecular usando IV-OCT concentra-se principalmente na investigação de possíveis agentes de contraste. Assim, este estudo é composto, para além sua funcionalização, na comparação de nanoestrelas de ouro e microbolhas de poli(n-butil cianoacrilato) (PBCA) como possíveis candidatos. Os resultados apresentam as mi-crobolhas de PBCA em foco, dado que estas exibem um efeito de dispersão mais perceptí-vel, levando a imagens mais valiosas.
É importante salientar que um simulador físico de tecidos biológicos (Phantom) foi igualmente apresentado para uso em IV-OCT. Este material, criado para mimetizar algu-mas das propriedades óticas das artérias humanas, foi fabricado a partir de uma matriz de polidimetilsiloxano (PDMS) na qual foram dispersas nanopartículas de dióxido de titânio, sendo possível obter uma ampla variedade de densidades de espalhamento da luz. A fabricação, caracterização e imagem por OCT dos referidos phantoms é descrita, bem como a demonstração da sua utilidade na funcionalização com dois tipos de agentes de contraste.
Por fim, destaca-se que microbolhas de PBCA comerciais (Fujifilm Visualsonics) foram funcionalizadas com anticorpos contra células endoteliais e testadas usando sistemas clí-nicos de OCT em artérias humanaspost mortem, permitindo a sua localização inequívoca
na amostra. Os resultados apresentam os primeiros passos em direção a acrescentar uma funcionalidade extra ao IV-OCT utilizado rotineiramente na cardiologia intervencional.
Palavras-chave: Imagem Intravascular de OCT, Imagem Molecular de Aterosclerose, Mi-crobolhas de PBCA, Nano-sondas direcionadas, Nanopartículas de Ouro, Nanotecnologia, Simuladores de tecido.
Contents
Acknowledgements vii
Abstract ix
List of Figures xv
List of Tables xix
Symbols xxi
Acronyms xxiii
Motivation and Objectives xxv
1 Introduction 1
1.1 Overview of atherosclerosis . . . 1
1.2 Current diagnosis methods . . . 2
1.2.1 Currently used methods in cardiovascular diseases . . . 2
1.2.2 Principles of OCT . . . 3
1.3 How tissue material appears in OCT . . . 5
1.4 OCT perspectives . . . 6
1.5 Molecular contrast agents: Micro and nanoparticles . . . 7
2 Materials and Methods 9 2.1 Synthesis and Characterization of the contrast agents . . . 9
2.1.1 Gold Nanostars (GNST) . . . 9
2.1.2 PBCA microbubbles . . . 9
2.2 Functionalization . . . 10
2.2.1 Immobilization of gold nanostars on PDMS surface . . . 10
2.2.2 Biofunctionalization . . . 10
2.3 Phantom design . . . 12
2.3.1 Scattering agents . . . 12
2.3.2 PDMS nanocomposite phantoms . . . 12
2.4 OCT . . . 12
3 Results and Discussion 13 3.1 Phantom characterization . . . 13
3.1.1 Scattering agents . . . 13
3.1.2 Optical characterization . . . 14
3.1.3 Synthesis and characterization of contrast agents . . . 16
3.2 Functionalization . . . 19
3.2.1 Immobilization of GNST on the surface of PDMS . . . 19
3.2.2 Biofunctionalization . . . 21
3.3 Optical coherence tomography . . . 23 xiii
CONTENTS
4 Conclusion and Future Perspectives 33
Bibliography 35
Annexes 41
I Nanostars synthesis 41
II MB biofunctionalization protocol 43
II.1 Biotin Labeling Reaction . . . 43 II.2 Antibody filtration . . . 43 II.3 Vevo MicroMarker Contrast Agent Conjugated with the Isotype Control
Antibody . . . 43
III Nanostar shape 45
IV GNST immobilization APTES 47
V Biotin quantification 49
VI OCT A-Scans 51
List of Figures
1 Dissertation goals: Contrast agent-aided molecular imaging process. The di-rect visualization of endogenous disease markers in the body is nonexistent as it is not possible to distinguish from surrounding tissue using OCT imag-ing. The proposed method rests in the use of exogenous contrast agents with the specificity to bind to the target in question. Image designed in Adobe Illustrator®. . . ix 1.1 Atherosclerotic plaque development. The monocytes can adhere and pass
through the endothelium, where they transform into macrophages and ingest the foreigner low-density lipoproteins, becoming foam cells that contribute to the narrowing of blood vessels (Retrieved from Ref [12]). . . 1 1.2 Comparison between di↵erent imaging techniques in terms of imaging depth
and resolution. Retrieved from the website of the Optical and Biomedical Engineering Laboratory,"Introduction to OCT", University of Western Australia. 2 1.3 Depiction of the basic interferometric OCT setup. Catheter scheme and
posi-tioning within a sample. Image designed in Adobe Illustrator®. . . 3 1.4 OCT scan Types. A-scan, B-scan, tomographic reconstruction (3D
reconstruc-tion and secreconstruc-tioning). Image designed in Adobe Illustrator®. . . 4 3.1 Scanning electron microscopy (SEM) images of the hydrothermally
synthe-sised TiO2 powders and the commercially available ones: (a) TiO2 powder synthesised at CENIMAT/i3N; (b and c) Commercial food grade TiO2in dif-ferent magnifications. . . 13 3.2 Photographs of mould casted PDMS slabs prepared with and without added
scattering agents. . . 14 3.3 Extinction vs wavelength of stock PDMS substrate and of PDMS substrates
with di↵erent concentrations of TiO2 nanoparticles. Obtained without the cuvette on the spectrometer: Substrate adhered to the stand (Approximate thickness of 1 mm). . . 15 3.4 Thickness measurement distribution of each layer from optimized phantom.
Surface tension causes the sides of the phantom to curve contributing to the deviations in the thickness measurement . . . 16 3.5 Extinction spectra of the Au nanoparticle seeds and following gold nanostars
from 380 - 1400 nm. . . 17 3.6 TEM images of MC01 batch of gold nanostars. Diameter distribution for MC01
(58 ± 19 nm) and SA56 (53 ± 9 nm) samples. . . 18 3.7 Emission spectra of Nile blue dye at 5% power of a 633 nm laser. . . 19 3.8 Schematic of the GNST immobilization process. Image designed in Adobe
Illustrator and MolView®. . . 19 3.9 Confocal microscope images of functionalized stock PDMS. A)Transmission
image, B) Reflection image, C) Transmission plus fluorescence. . . 20 xv
List of Figures
3.10 Confocal microscope images of functionalized scattering PDMS (TiO2PDMS). A)Transmission image,B) Reflection image, C)Reflection plus fluorescence . . 21 3.11 Schematics of the tissue phantom imaging. A controlled amount of the nanoprobe
solution is put on a small area of the phantom. The phantom is curved (nanoprobe area inside); and put inside an Eppendorf with water. Image designed in Adobe Illustrator®. . . 23 3.12 Phantom study of the contrast agents (MB: Microbubbles and GNST: Gold
nanostars) for OCT. (A) Eppendorf full of water; (B) PDMS stock phantom in water; (C) PDMS phantom with dispersed TiO2 (10 mg) - Scatterer; (D) PDMS stock with dried MB spot on the surface; (E) Scatterer PDMS with dried MB spot on the surface; (F) PDMS stock with dried GNST spot on the surface and respective “shadow e↵ect”; (G) Scatterer PDMS with with dried GNST spot. 24 3.13 Profile of double layer phantoms. Two profile plots are represented. One of
the regular phantom (A-scan 1) the other in a region with MB (A-scan 2). . . 25 3.14 OCT cross-section of a stented artery section. Adapted from OCT
Com-pendium by Holger Nef and Albrecht Elsãsser [50] and Science Picture Co stock photos. . . 26 3.15 a) OCT cross-section of a initial optical phantom were MB contrast is visible,
followed by b) the respective unwrapped image and the c) carpet view from all the cross-section taken in the OCT pull-back. . . 27 3.16 OCT cross-section of a double PDMS layer optical phantom with MB
shadow-ing e↵ect, followed by the respective unwrapped image and the carpet view from all the cross-section taken in the OCT pull-back. . . 28 3.17 Normal coronary artery. Adapted from: OCT Compendium by Holger Nef
and Albrecht Elsãsser [50] . . . 29 3.18 OCT setup allowing the fix of both phantoms and arteries while testing. Image
designed in Adobe Illustrator®and draw.io [Browser-based end-user diagram-ming application] (2019). . . 29 3.19 OCT cross-section and respective unwraped image of two sections of human
carotid artery. +MB: Artery section incubated with targeted MB; -MB: artery section incubated in blocking solution; S: separation between the two artery sections. . . 30 3.20 Carpet view from the artery sections OCT pull-back. -MB: Artery section
in-cubated with targeted MB;-MB: artery section incubated in blocking solution; Ar: Artifact . . . 31 II.1 Lyophilized VeVo MicroMarker® stored in a glass vial. The vial contains a gas
head-space consisting of nitrogen (N2) and perfluorobutane (C4F10). Graph-ical representation of Non-targeted and Target-Ready surface-modified mi-crobubbles (MB). Adapted from "Discover Nonlinear Ultrasound Contrast Agent Imaging", FUJIFILM VisualSonics website using Adobe Illustrator®. . 44
List of Figures
III.1 Optical absorption spectra (centre) showing the e↵ect of the size/shape of GNST in plasmon peak position [36]. The decrease of the GNST tips leads to weaker plasmonic e↵ect and at lower wavelengths. . . 45 IV.1 Confocal microscope images of functionalized stock PDMS. A)Transmission
image,B)Fluorescence image. . . 47 V.1 BSA calibration curve and respective linear fit. . . 49 VI.1 Raw profile of double layer phantoms. In profile A, a region without MB, two
distinct scattering profiles are noticed from the two layers with di↵erent TiO2 concentrations. The intensity decay is dissimilar between the layers. . . 51
List of Tables
3.1 GNST morphological characterization and particle count. . . 18 3.2 Protein absorption quantification. . . 22 3.3 Identification of the tissue and the structures using reflection and attenuation.
Adatpted from: OCT Compendium by Holger Nef and Albrecht Elsãsser [50] 31 V.1 BSA concentration in saline solution versus respective absorbance values used
in the standard calibration curve. . . 49 V.2 Measured absorbance of the di↵erent aliquots from the filtration process and
the respective interpolation of the concentration based on the calibration curve. . . 50
Symbols
" Extinction coefficient (M 1cm 1)Abs280 Absorbance at 280 nm
Abs400 Absorbance at 400 nm
C Concentration (M)
L Optical path length (cm)
lc Coherence length
Acronyms
ACS Acute coronary syndromes
CVD Cardiovascular diseases
FD-OCT Fourier domain optical coherence tomography
GNST Gold nanostar
IV-OCT Intravascular optical coherence tomography
LDL low-density lipoproteins
LSPR Localized surface plasmon ressonance
MB Microbubble
MCOCT Molecular contrast-based optical coherence tomogra-phy
MWCO Molecular weight cut-o↵
NIR Near-infrared
OCT Optical Coherence Tomography
VE-cadherin vascular endothelial cadherin
Motivation and Objectives
Cardiovascular diseases (CVDs), the leading causes of death in the western world, are now gaining ground also in developing countries [1] . Enormous e↵orts are being put into raising awareness, research and treatment of the spectrum of CVDs, including acute coronary syndromes (ACS) and stroke. A study by the World Health Organization, the World Heart Federation and the World Stroke Organization into Cardiovascular Disease Prevention and Control state that: “from the two-thirds of all deaths in the world, which belong to non-communicable diseases, almost 50 % are from CVDs alone” [2] . Further-more, CVDs should not only be recognized as a significant cause of morbidity but also as a major economic burden and an obstacle to global development and sustainability[3].
Although our knowledge of disease progression leading to plaque build-up in atheroscle-rosis has increased over the last few years, our ability to predict future events is still insuf-ficient. Di↵erent imaging technologies are being developed to visualize various features of vessel walls that could indicate the onset of acute cases such as ACS and stroke, but there is yet no single technique that provides a robust prognosis of CVDs [4].
In this context, Optical Coherence Tomography (OCT) has rapidly evolved from its initial ophthalmological applications into a plethora of medical fields, like interventional cardiology. Since its development in 1991, at the Department of Electrical Engineering Computer Science on the Massachusetts Institute of Technology (MIT) [5], the many advances in OCT not only strengthened the vast applicability of the technology, but also continue to bring enthusiasm to applications that may still be discovered. Considering that OCT is a minimally invasive imaging method upholding high penetration depth and spatial resolution, when compared to other imaging techniques [6].
Due to the technological shift in 2003 from the nowadays-called time-domain OCT to the fourier-domain, the rapid imaging of the intervascular medium was finally attainable and several clinically approved imaging systems have appeared soon after. Nevertheless, with all the many advances, OCT still has room for innovations, not only on hardware but also in software and optical systems. Other techniques can be implemented in the same system, providing multidimensional information to the OCT data. For instance, recent techniques such as Doppler [7] and Polarization sensitivity OCT [8] have brought additional contrast to clinical images and the ability to visualize and quantify blood flow; while supercontinuum fiber laser sources are being used to obtain high-resolution images [9] and computational adaptive optics where suggested as the algorithm of choice for an improved aberration correction [10].
However, a clear and unmet clinical need remains: the identification of metabolic changes in the tissue. Despite OCT significance in the diagnosis of clinically important diseases and unprecedented resolution of vessel microstructural features, imaging of disease biomarkers is still elusive. OCT is foremost a morphology imaging technique and many diseases do not promote a significant change in the tissue so the OCT can observe. Therefore, to visualise these morphological alterations, it is necessary the use of contrast agents. However, trough the best of our knowledge, there are no contrast agents that can couple OCT contrast with biological targeting [11], and thus, there are no clinical
MOTIVATION AND OBJECTIVES
approaches to image disease biomarkers in biological processes using this technology. This project fits in this contest to improve current diagnostic capabilities of intervascular OCT as a clinical tool. We proposed to attain that goal combining OCT with molecular imaging. Thus, the specific objectives of this work were:
• Synthesis and characterization of contrast agents able to produce significant OCT signal;
• Optimization and development of a tissue simulating platform for rapid testing of contrast agents;
• Synthesis of functionalized nano-probes for targeting arteries;
• Integration of targeted nano-probes with IV-OCT imaging, in an innovative protocol to analyse anatomical and molecular features within post mortem human arteries. In addition to putting into practice the hard skills learned during the course of Micro and Nanotechnologies, this work greatly influenced the development of soft skills that helped substantially in the di↵erent practical aspects of this thesis. Namely in designing user interfaces, optimizing graphical outputs, and delivering specific data analysis tools using MATLAB programming language, complemented with custom designed illustra-tions/pictograms using the vector graphics editor (Adobe Illustrator®).
Chapter
1
Introduction
1.1 Overview of atherosclerosis
Cardiovascular disease (CVD) is a generic term applied to a large number of conditions a↵ecting both the heart and blood vessels. It is the leading cause of death in the world and continues to be a significant burden for all society [1]. It mainly includes coronary heart diseases (blood vessels supplying the heart muscle), cerebrovascular diseases (blood vessels supplying the brain) and peripheral arterial diseases (blood vessels supplying the arms and legs). Above all, the most common reason for all these disorders is the build-up of fat deposits inside of the artery walls, a process referred to as atherosclerosis (Figure 1.1).
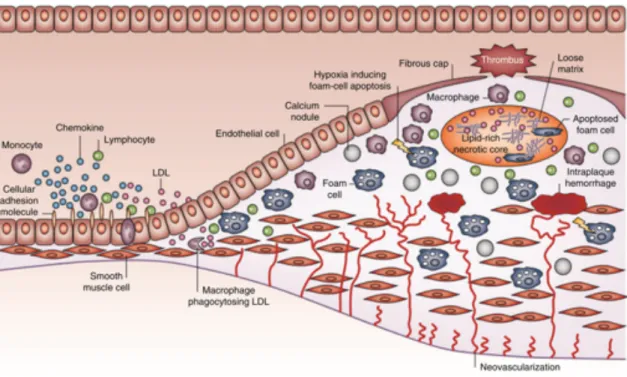
Figure 1.1: Atherosclerotic plaque development. The monocytes can adhere and pass through the endothelium, where they transform into macrophages and ingest the for-eigner low-density lipoproteins, becoming foam cells that contribute to the narrowing of blood vessels (Retrieved from Ref [12]).
At the beginning of the atherogenic process, patches of arterial endothelial cells begin to express on their surface selective adhesion molecules [e.g.: selectin, vascular cell adhesion molecule 1 (VCAM-1) and intercellular adhesion molecule 1 (ICAM-1) [12]] that bind with various classes of leukocytes. This cell dysfunction process does not occur naturally, it is a response to lesions on the endothelium wall at predisposed regions (e.g. near branch points and along the inner curvature of the arteries) [12] due to risk factors such as hypertension, smoking and high cholesterol level. At these sites, low-density lipoproteins (LDLs) go through the endothelium and promote an inflammatory response that leads to endothelial dysfunction. Once adhered to the endothelium, the leukocytes penetrate the
CHAPTER 1. INTRODUCTION
intima (innermost layer of the artery) and di↵erentiate into macrophages that scavenge for the foreigner LDLs. However, once the macrophages uptake reaches a limit point, the inflammatory process no longer remains under control and a chronic process takes place. Macrophages with an excess intake of lipids turn into “foam cells” and agglomerate in the interior of the vessel walls, forming an atheroma or plaque. These plaques are the basis for the atherosclerotic process and lead to the narrowing of the blood vessels (stenosis). Although atherosclerosis on its own is rarely fatal, the rupture and thrombosis of the atheroma account for all the acute cases such as heart attacks and strokes. The assessment of these vulnerable plaques, that have a high risk of rupturing, remains a challenge in cardiology [4] . After all, these plaques are mainly diagnosed accounting the morphology of the vessel walls (i.e. high luminal stenosis and thin cap). However, it is acknowledged that the risk of rupture depends more on the plaque composition rather than its anatomy [4].
1.2 Current diagnosis methods
It is impossible to proclaim that a perfect imaging solution exists since it is not guar-anteed that it will be optimal in every diagnostic situation. Di↵erent systems perform optimally in di↵erent types of clinical practice settings. As so, several criteria are consid-ered when comparing alternative imaging methods for plaque characterization - namely, the resolution, imaging depth and sample intrusiveness (Figure 1.2).
The following sections will overview OCT in cardiology, comparing with other tech-niques and finally the basic principles of this imaging method.
Figure 1.2: Comparison between di↵erent imaging techniques in terms of imaging depth and resolution. Retrieved from the website of the Optical and Biomedical Engineering Laboratory,"Introduction to OCT", University of Western Australia.
1.2.1 Currently used methods in cardiovascular diseases
In the diagnosis of coronary heart disease, the first common approach for the medical doctor is coronary angiography [4]. This exam detects sites of luminal stenosis for fur-ther treatment such as stent placement using an intravascular contrast agent and X-ray imaging. Angiography is used primarily to localise the region where there is a blood
1.2. CURRENT DIAGNOSIS METHODS
flow blockage, however, it does not have enough resolution to visualize specific structures in the artery wall. In this sense, Optical coherence tomography (OCT) has been a very promising imaging solution in distinguishing the composition of plaque structures, fit-ting between conventional optical microscopy (confocal and fluorescent microscopy) and ultrasound (Figure 1.2) [6]. Whereas methods such as magnetic resonance imaging (MRI) and intravascular ultrasound achieve greater imaging depths, allowing the diagnosis of larger areas, OCT far exceeds in terms of resolution. A typical OCT allows for spatial resolution up to 10 µm [6], and its ability to perform in vivo images is greatly appreciated. In the case of cardiovascular imaging, a catheter-based OCT works as a minimally evasive solution, allowing the detailed visualization of the arterial layers and the accurate assess-ment of plaque features in small arteries (0.5 to 1.5 mm) [13]. As so, IV-OCT has proven to be a promising imaging modality in obtaining cross-sectional tomographic vascular images [14].
1.2.2 Principles of OCT
The imaging process in OCT can be viewed as the light equivalent of ultrasound, measur-ing the “echoes” of light backscattered by the sample to build an image. In intravascular OCT (IV-OCT), a fibre optics cable (catheter) transmits the light and collects the reflec-tion inside an artery, while rotated and pulled across its length. There are two main approaches to obtain OCT data: time-domain and Fourier-domain methods. Originally, OCT was developed as an interferometric technology where the spatial information was obtained depending on the time delay between the sample and a reference beam. As so, a very basic OCT setup, depicted in Figure 1.3, closely resembled a Michelson interferome-ter.
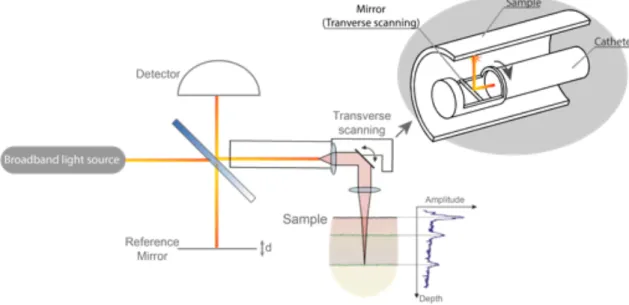
Figure 1.3: Depiction of the basic interferometric OCT setup. Catheter scheme and positioning within a sample. Image designed in Adobe Illustrator®.
The Michelson interferometer is a common configuration for optical interferometry. A 3
CHAPTER 1. INTRODUCTION
beam splitter divides the light beam emitted from a light source, so that half goes into a reference path (mirror) and the other half to the sample. The beams are reflected back in both arms of the interferometer and recombined before being detected by a sensor, producing an interference e↵ect.
Figure 1.4: OCT scan Types. A-scan, B-scan, tomographic reconstruction (3D reconstruction and sectioning). Image designed in Adobe Illustra-tor®.
However, it is essential to note that this interfer-ence, meaning constructive/destructive interaction between the two light beams, only occurs when the optical path on both arms of the interferometer is almost equal (di↵erence smaller than the coherence length of the light source). Thus, by moving the reference arm, the location of a certain feature in the sample can be assessed with the resolution of the coherent length of the source. Moreover, a inter-ference pattern is obtained depending on the mir-ror position, corresponding to the specific reflection characteristics of a feature in the sample at that po-sition (optical path distance).
Performing a pre-determined sweep of the refer-ence mirror positions, which correspond to an imag-ing depth range, one axial (Z) scan is obtained. This is also referred to as an amplitude scan (A-scan) and corresponds to a map of the di↵erent reflections within one axial direction (Figure 1.4). Addition-ally, it is possible to obtain a cross-section of the sample by joining multiple A-scans from directions transverse to the light beam (B-scan). Finally, by combining multiple B-scans a 3D model of the sam-ple is attained.
It is important to note that the coherence length of the light source (lc) determines the axial reso-lution. Oversimplifying, the coherence length de-scribes the distance over which two beams main-tain a constant phase di↵erence hence interference is observed between these two beams. For this reason, broadband light sources, which have low-coherence, are used to better di↵erentiate the reflec-tions from individual structures in the path of the beam.
However, in 2003, di↵erent studies have demonstrated that the shifting from Time-domain methodology to Fourier-Domain improved the detection sensitivity by several orders of magnitude [15]. As so, current devices no longer use the conventional OCT
1.3. HOW TISSUE MATERIAL APPEARS IN OCT
setup, they obtain measurements in the frequency space, though the same principle of interferometry remains. In Fourier-Domain OCT (FD-OCT) the reference arm of the system is fixed and the measurements are wavelength-dependent. In general terms, the intensity of light hitting the detector (I) that defines the OCT output signal is given in
terms of the resulting electric field,E, in equation 1.1 [16].
I⇡cn"2 |0 E|2 (1.1) Wherec is the speed of light in vacuum, n is the refractive index of the medium and "0the vacuum permittivity. Nevertheless, the resulting electric field,E, corresponds to an interaction between the electrical component of the optical field from the sample arm (Es) and the electrical component from the reference arm (Er), in the form(1.2):
|E|2= |Es|2+ |Er|2+ 2|Es||Er|cos(!⌧) (1.2)
Where ! corresponds to the source optical frequency and ⌧ to the delay caused by the optical path di↵erence between the sample and the reference arms. In the Time-domain OCT, the frequency ! is fixed and the ⌧ changes with the movement of the reference mirror. The cosine term then yields a maximum received signal when ⌧ = 0, i.e., the optical path distance di↵erence between the reference and sample arms is zero. As long as the movement of the mirror is known (position ⇥ time), interferograms such as the one observed in Figure 1.3, of the light intensity versus mirror displacement I(⌧), can be obtained. In contrast, the Fourier-Domain OCT fixes the reference mirror position, maintaining the optical path di↵erence constant and measuring the intensity spectrum in the frequency domain I(!), which is then converted to a measurement equivalent to the Time-Domain using the inverse Fourier transform. A detailed discussion of the numer-ous practical aspects of optical coherence tomography and mathematical formulations is beyond the scope of this work. Additional information on this topic can be found in pertinent works already reported [16–18].
1.3 How tissue material appears in OCT
In OCT, light from the source is attenuated (scattered and absorbed) as it passes through the tissue sample. The strength of backscattering, the main imaging process in OCT, provides a mechanism to di↵erentiate structures and is influenced by the di↵erent con-stituents in the biological medium (cells, organelles and fibres) [19]. Absorption, on the other hand, occurs mainly in pigments, such as haemoglobin and melanin and water [20]. It limits on how much the OCT can measure, and it depends on the source wavelength and the tissue characteristics. Therefore it is important to note that, in order to achieve greater imaging depths in tissues, absorption must be the lowest possible (ignoring scat-tering e↵ects). Therefore, as di↵erent biomolecules absorb certain wavelengths more readily than others do, a diagnostic/therapeutic spectral window is always defined when working with light-tissue interactions [21]. Light at wavelengths in the near-infrared (NIR) spectral region, from 1100 to 1350 nm, correspond to low blood absorption
CHAPTER 1. INTRODUCTION
and deoxyhemoglobin) [21]. To this end, the central wavelength of the IV-OCT light source is generally chosen in the range of 1250 to 1350 nm [22] . Moreover, the size, shape, density of di↵erent scattering structures and their refractive index predetermine the character of light propagating in tissues. Allowing for a morphologic assessment of the interior of vessel walls and a preliminary study of their composition.
1.4 OCT perspectives
As referred, plaque vulnerability seems to depend more in composition than morphology. As a result, diagnosis with OCT falls short due to the inability of detecting distinctive biological traits, such as disease chemical markers. The ideal imaging method should report not only the volume of plaques within the artery walls but also plaque biologi-cal characteristics. Thus, to enhance the capability of this imaging system would be to combine OCT with molecular imaging. This hybrid optical imaging approach exploiting the high-resolution and excellent penetration depth of OCT with a smart optical con-trast agent could dramatically enhance imaging capabilities. A concon-trast agent that can elicit molecular contrast grants the possibility of tracking the distribution of biochemical components in samples [23]. Thus, allowing trailing diseases evolution in patients and trial subjects. There are two ways by which molecular contrast–based OCT (MCOCT) procedures can be utilized to image a particular chemical or protein distribution within a target:
• Directly detecting the chemical or protein due to its innate contrast capabilities; • Attaching a contrast agent to a vehicle that recognizes and binds to the chemical or
protein in question.
In the work of Yang et al. [24], an example of this first method is presented (Direct detection). The distribution of a plant protein (phytochrome A) is achieved from pairs of consecutive OCT A-scans. This specific protein can reversibly switch between two states with di↵erent absorption maxima accordingly to the wavelength of an externally exposed light. In this type of technique, the contrast agent is endogenous to the target organism. However, it is not very often that we find the required protein or chemical that also performs well as a contrast agent. Moreover, even if in principle it should be possible to genetically-engineer animal models to express these proteins for biomedical research applications, simpler and quicker diagnosis methods are required.
For the second method presented of MCOCT imaging, the molecular target is high-lighted by what we can refer has marker “buoys”. An exogenous contrast agent that is efficiently distinguished by the OCT can be functionalized so that it ties to the particular chemical or protein of interest. As a figure of speech, imagine a diver as an antibody that finds and binds to the wanted protein (Treasure) (Figure 1). Attached to him is the buoy that pops up on the water surface, warning the boats that a diver will soon float. The only detectable signal by means of OCT is the buoy, from which by now the position can be used to co-localize both the diver and the protein sought for. This method has a very significant advantage, since it can be used to recognize and map chemicals or protein that
1.5. MOLECULAR CONTRAST AGENTS: MICRO AND NANOPARTICLES
are otherwise undetectable directly by OCT in the target tissue, as long as it is possible to design a contrast agent that is visible in the OCT system.
1.5 Molecular contrast agents: Micro and nanoparticles
Optical molecular imaging is rapidly expanding using new exogenous molecular probes [25]. Di↵erent types of contrast agents are being studied for OCT [4], however, mainly four categories apply: scattering, modulating, absorbing and plasmon resonant probes. For the first category, scattering, the most common particles are metals and other particles with a refractive index significantly di↵erent from the tissue. Scattering is an optical phenomenon that depends on size of the particles and the wavelength of the light (as the case of Raleigh and Mie scattering), but it generally increases with the magnitude of the refractive index di↵erence between the particle and the surrounding media. The microbubbles studied in this work are an example of this category.
Since OCT detects light backscattered from refractive index mismatches it was fore-casted that gas-filled microbubbles would produce contrast in OCT. In fact, the first study of the e↵ects of microbubbles was presented in 2002 by Barton et al. [26]. Initial tests in phantoms demonstrated that MB can be used as contrast agents for OCT [26]. Since the microbubbles increased the attenuation coefficient of blood a great advantage in the use of MB arised and became the main focus of such contrast agents. The enhanced visualization of the blood vessel lumen, because after all the optical properties of blood are very similar to the surrounding tissue [26].
More recently studies have focused on the quantitative assessment of the MB contrast in well-controlled systems that accurately mimic tissue optical properties and flow con-ditions [27]. However, the study of targeted imaging using MB in OCT has been lacking. While microbubbles are being readily used with ultrasound systems to the point that there are already FDA approved commercial contrast agents.
In the second case, modulating probes modify one observable property in situ, like the case of the plant protein presented by Yang et al. [24]. While background remains constant, the alternation between di↵erent observable states allows for an improved detection. Which, in this case, depends mostly on the comparison of two consecutive images. The absorbing probes case is based on the local attenuation due to absorption [25]. Instead of focusing in the local optical changes, the e↵ect of absorbing probes is noticed in deeper structures of the tissue, as reduced backscattering intensity is observed in these regions. In this case, the contrast agent promotes a shadow e↵ect, as it absorbs most of the light passing through, structures that are behind it do not receive enough light to be visualised. Finally, plasmon-resonant probes address the trend of reducing the size of the probes while maintaining a sufficient scattering cross section. This is accomplished by the use of metal nanoparticles that exhibit a phenomenon called surface plasmon resonance (SPR). The collective excitation of electrons promotes an increased scatter e↵ect in the nanoparticles, and it depends on the material, size, and structure of the particle.
Chapter
2
Materials and Methods
Additional information and the detailed protocols regarding this section can be consulted in Annex I and II.
2.1 Synthesis and Characterization of the contrast agents
2.1.1 Gold Nanostars (GNST)
The detailed protocol on all the steps for the synthesis of gold nanostars can be found in annex I. Gold nanostars were synthesised using a method modified by the microfluidics group at INL, of a previously reported seed-mediated growth by Pandian Senthil Kumar
et al [28]. Already synthesised, citrate stabilized 15 nm spherical gold nanoparticles,
produced with the Turkevich method [29] were previously coated with polyvinylpyrroli-done (PVP) and used as gold seeds for the following GNST synthesis (Au@citrate@PVP - 2 ⇥ 10 3M). For the typical seed-mediated growth, 2.5 g of polyvinylpyrrolidone (PVP MW = 10,000 g mol 1) were dissolved in 25 mL of N, N’-dimethylformamide (DMF, MW= 73.09 g mol 1), using an ultrasound sonicator, until all was dissolved. Following, 99.15 µL of an aqueous solution of chloroauric acid (HAuCl4 - 0.1268 M) was added to the solution under magnetic stirring. During the 1 min of mixing, the solution got lighter in colour from the reduction of Au3+ to Au
1+. Following, 317 µL of Au@PVP seeds (2 ⇥ 10 3 M) were quickly added to the solution still under stirring. The reaction flask was left covered with aluminium foil to protect it from light. Within 2 h, the color of the solution changed from brownish to a very dark blue/grey, indicating the formation of gold nanostars in solution. The resulting gold nanostars were washed (5500 rpm, 60 min) with IPA to stop the reaction and remove excess reactants.
To prepare codified gold nanostars, 4 µL of ammonium hydroxide (NH4OH- 29%), 2 µL of an ethanol solution of mercaptoundecanoic acid (MUA – 3.75 mM) and di↵erent fluorescence dyes (10 4 M) were added to 2 mL Eppendorf’s containing 0.8 mL of a 1 mM solution of the previously synthesised gold nanostars. Although only one of the fluorescence dye was used in the further experiments (Nile Blue - NB), di↵erent batches of GNSTs were also coded with toluidine blue (TB). After continuous magnetic stirring for 2 hours, each one of the solutions passed through 2 washing steps composed of an ultrasound bath for 2 min and centrifuge at 2500 rpm for 30 min. Each time re-dispersing in IPA until 1 mL. The resultant gold nanostars where characterized using a FEI Quanta 650 FEG scanning electron microscope and further absorbance measurements were taken in a Perkin-Elmer LAMBDA 950 UV-VIS-NIR Spectrophotometer. The size distribution was preformed using the imaging processing package Fiji for ImageJ.
2.1.2 PBCA microbubbles
Poly(n-butyl cyanoacrylate) (PBCA) microbubbles where kindly provided by Prof. Twan Lammers’ (ExMI, Helmholtz Institute for Biomedical Engineering - Germany) group. Two di↵erent varieties of PBCA microbubbles where received. Initially, PBCA microbubbles where obtained in Triton-X without any surface active groups. This microbubbles varied
CHAPTER 2. MATERIALS AND METHODS
in size from 1.8 to 2.5 µm and where produced in professor Twan lammers group [30]. The second batch consisted of VeVo MicroMarker® Target-Ready contrast agents (from Fujifilm Visualsonics) made by Bracco Research SpA. These where used for further bio-functinalization procedures. Using the preparation protocol from Fujifilm Visualsonics, VeVo MicroMarker® Target-Ready contrast agents were reconstituted. Initially 0.7 mL of saline was injected into the microbubble flask with a 21G ½” needle attached to 1 mL syringe. The syringe was then removed letting the vial vent with the needle still injected. Finally, the needle was removed completely, and the vial gently agitated for 10 seconds. The synthesis process of both batches can be analyzed in detail in reference [30].
2.2 Functionalization
2.2.1 Immobilization of gold nanostars on PDMS surface
The immobilization method was performed using a modification of the previously re-ported work of Nguyen Ba Trung,et al. [31]. The formerly synthesised coded (Nile blue)
gold nanostars were deposited on a poly(dimethylsiloxane) (PDMS) substrate based on electrostatic interactions. Substrates were first activated with oxygen plasma for 2 min. On this step, a mask in the form of another PDMS slab or adhesive tape, was used to cover a specific area of the substrate, in order to adhere the nanoparticles on the ex-posed side. Following a washing step with ethanol, the substrates were dried with N2gas. The cleaned substrates where then immersed in di↵erent silane solutions. Initially the silane crosslinker used was (3-Aminopropyl)trimethoxysilane (APTMS, sigma Aldrich) at 1%(v/v) and 8.33%(v/v) ethanol solution. While in the end it was switched to (3-Aminopropyl)triethoxysilane ( -APTES, sigma Aldrich) at 1%(v/v). The substrates where immersed for 5 or 15 min in each of the solutions. From here on, the substrates were immediately cleaned with ethanol and water to remove any residual silane molecules. Then the masks were removed. Next, the samples were annealed at 80°C for 1 hour and 30 minutes. Finally, the substrates are immersed on the colloid gold nanostars solution, previously prepared, again for 1h and 30 min and thoroughly rinsed with deionized water. The substrates are well dried and placed in the oven for an annealing step of 1 hour at 80 ºC. A Zeiss LSM780 confocal microscope with 34 simultaneous confocal fluorescence counting channels was used to access the distribution of the coded nanoparticles. 2.2.2 Biofunctionalization
The detailed protocol of the biofunctionalization process can be found in annex II.Tissue. -80 °C frozen human carotid was obtained for immunohistochemistry, these samples are
considered in a protocol with INMLCF (Instituto Nacional de Medicina Legal e Ciências Forenses). The artery sections where cut crosswise into two pieces, defrosted and fixed in acetone at -20 °C. Following, all the samples were washed three times in PBS.
2.2. FUNCTIONALIZATION
Biotin-labelling of Unconjugated Goat Anti-rabbit IgG antibody. Immunoglobulin (IgG) molecules (Novex by Life technologies TM, Lot 62-10-092817) where first biotiny-lated using Thermo ScientificTM EZ-Link TM Sulfo-NHS-LC-Biotin (sulfosuccinimidyl-6-[biotin-amido]hexanoate) (MW: 556.59 ;Lot. Nr. A39257 21335). The devised protocol was based on the user’s guide for the EZ-Link TM product (MAN0016133, Pub. Part No.21611855). Initially a 10 mM solution of the biotin reagent was prepared in 500 µl of ultrapure water. Following, a 60-fold molar excess of biotin (10 µl) was taken from the prepared solution and added to 3.75 mL of a saline solution containing 250 µg of the stock antibody. The solution was then incubated at room temperature for 30 min. The re-sulting antibodies where further purified using Amicon Ultra-0.5 Centrifugal Filter units with a Ultracel-100 regenerated cellulose membrane and a nominal molecular weight limit of 100 k at 2000 rpm for 2 min. The protein concentration on di↵erent steps of the filtration was obtained with a Nanodrop 2000 microvolume spectrophotometer from Thermo Scientific.
Immunohistochemistry procedures. Primary immunohistochemistry of rabbit anti-VE-Cadherin IgG antibodies (Thermo Fisher, Code: V1514-200UL, Lot. 016M4804V) was
performed overnight (8h) at 4°C. The primary antibody solution was prepared accord-ing to the recommended values described by the supplier. From a PBS bu↵er solution containing 1% of bovine serum albumin (BSA), 4 mL where mixed with 20.4 µl of anti-VE-Cadherin IgG. The positive artery samples where then immersed in this solution
and left incubating overnight. The negative samples where immersed in a PBS blocking solution with 3% BSA and also left overnight. After this process the samples were washed three times in PBS. The VeVo MicroMarker microbubbles where reconstituted from the respective vial as referenced in section 2.1.2 and the preparation protocol from Fujifilm Visualsonics was again used for further biofunctionalization. Using a 21G ½” needle with a 1 mL syringe 0.3 mL of the filtered biotinylated Goat Anti-rabbit IgG (20 µg) where in-jected into the microbubble vial (total volume of 1 mL). The functionalized contrast agent solution was then gently agitated by hand for 1 min and left to rest at room temperature for 15 minutes.
Thesecondary immunohistochemistry step was finally performed by transferring the fully assembled microbubble solution to an Eppendorf with the positive artery section, adding 2 mL of saline to top the required 3 mL necessary for the experiment. Joining the secondary antibody (Goat Anti-rabbit IgG) with the primary antibody (rabbit anti-VE-Cadherin IgG). The incubation step was performed for 1 hour at 4°C while agitating
and was followed by three washes in PBS. The artery sections where supended in a saline solution.
CHAPTER 2. MATERIALS AND METHODS
2.3 Phantom design
2.3.1 Scattering agents
The TiO2nanoparticle synthesis was performed in CENIMAT/i3N at NOVA University. The hydrothermal-microwave assisted method was slightly adapted from a previously re-ported work [32]. A CEM Discover SP Microwave Synthesiser was used for the hydrolysis of a solution containing 2 mL of a titanium precursor (Titanium (IV) isopropoxide, sigma Aldrich), 5 mL of an acid catalyst (Nitric acid, sigma Aldrich) and 55 mL of ethanol. The solution was first prepared under magnetic stirring until all reactants were fully mixed. Only then where 20 mL transferred to a Pyrex reaction vessel and placed in the microwave synthesiser. Next a predefined program was set for 1 hour and 15 min with the following set points: 200 ºC, 100 PSI and 100 W. Further commercial TiO2powders where used in later phantoms. The Characterization of the TiO2powders was performed on a FEI Quanta 650 FEG electron microscope.
2.3.2 PDMS nanocomposite phantoms
SYLGARD® 184, a two-part Polydimethylsiloxane (PDMS) kit from DOWSIL (formerly DOW CORNING, Michigan, EUA) was used as the matrix material for the phantoms. The kit is composed of a base (PDMS) and a curing agent (reactive). The PDMS phantoms were produced in a two-step approach. First, the titanium dioxide particles with a weight percentage of 0.6% to 3% (according to which layer) are introduced into the base resin without the reactive. Each of the mixtures was initially hand mixed and then placed in the ultrasounds for at least 4 h. Next, the required amount of the PDMS composite was transferred to a separate container were the curing agent was added in a ratio of 10:1. The final compound was mixed and poured into the moulds were each layer is left to cure for 1 h at 65 °C. The composite material was synthesized by simple mixing, without any treatment to both the matrix PDMS and titanium dioxide nanoparticles. It is important to note that the compositions of the phantoms here presented were based and modified from the article in Ref [33], which uses alumina as the scattering agent. Furthermore, as in the work by Bisaillonet al. [33], we decided not to use anything to induce absorption
in the phantoms.
2.4 OCT
Two di↵erent clinical IV-OCT systems where used in situ, thanks to the partnership with Dr. Victor A. Jimenez Diaz team at the Cardiology Department of Hospital Alvaro Cun-queiro (University Hospital of Vigo, Spain) and Dr. Carlos Galvão Braga at the Cardiology Department of Hospital de Braga (2CA-Braga, Portugal). Pullbacks from University Hos-pital of Vigo were acquired from a Lunawave coronary imaging console with a Fastview coronary imaging catheter (Terumo Corporation, Ashitaka, Japan), hereafter referred to as “Terumo-OCT”. While pullbacks from Hospital de Braga were acquired using the ILUMEN FD-OCT system from Abbott (formerly St. Jude Medical, St. Paul, MN) with a C7 Dragonfly catheter.
Chapter
3
Results and Discussion
3.1 Phantom characterization
3.1.1 Scattering agents
To introduce optical scattering, white titanium dioxide (TiO2) powders were added to the phantoms. These were chosen as potential scattering agents for the optical phantoms as they are a easily synthesized material and even commercially available at low-cost.
Commonly used as a whitening pigment in paint, sunscreens and even food couloring, TiO2powders are often used to fabricate OCT phantoms even tough their refractive index (2.3) greatly exceeds those from most often biological structures [34]. However, in the context of this research, the emulation of tissue optical properties was mainly oriented on how light interacts with the phantom and not the rigorous mimicking of all the optical properties of common tissues. As so the main concern was obtaining di↵erent magnitudes of scattering scales by mixing di↵erent concentrations of TiO2.
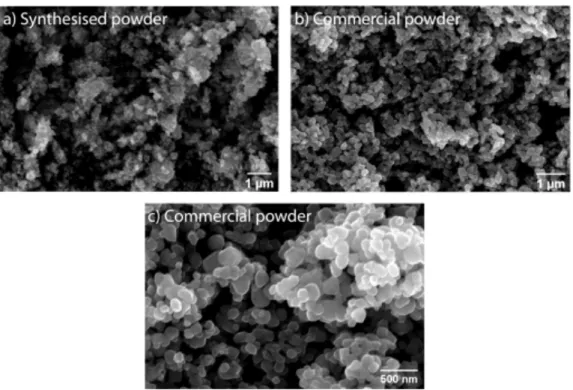
Initially a small amount of TiO2 powder was synthesised at CENIMAT/i3N using a hydrothermal-microwave assisted method. After further development of the phantoms, commercial food grade TiO2 was purchased. A comparison of both samples was taken using scanning electron microscopy. The hydrothermally synthesized TiO2 exhibited irregular morphology throughout all the sample with particles smaller in size than those seen in the commercial powder. However, the commercial powder is composed of roughly spherical nanoparticles with sizes ranging from 70 to 300 nm.
Figure 3.1: Scanning electron microscopy (SEM) images of the hydrothermally synthe-sised TiO2powders and the commercially available ones: (a) TiO2powder synthesised at CENIMAT/i3N; (b and c) Commercial food grade TiO2in di↵erent magnifications.
CHAPTER 3. RESULTS AND DISCUSSION
The size and dispersion of these TiO2particles were very similar to sub-/extracellular structures that dissipate light in typical tissues. Actual biological tissues are more com-plex than a homogeneous distribution of identical spherical particles or even randomly shaped ones. A mixture of large and small particles may be a good approximation to de-scribe tissue scattering properties. Figure 3.2 presents the di↵erence between the initial stock PDMS and the turbid PDMS composite with about 0.142 % (w/w) of the synthesised TiO2.
(a) Stock PDMS (b) Scattering PDMS
Figure 3.2: Photographs of mould casted PDMS slabs prepared with and without added scattering agents.
Once a uniform distribution of the TiO2powders into the PDMS matrix was achieved, the optical characterization of the di↵erent PDMS slabs, made following a rigorous proto-col such that the final thickness remained similar in all measured samples, was performed and it is presented in the following section.
3.1.2 Optical characterization
Ultraviolet-visible (UV-Vis) spectra measured in transmission mode of each of the mould-casted PDMS layers (Figure 3.2) are displayed in Figure 3.3. Confirming the transparency of the stock PDMS matrix in all the recorded spectrum (350-1500 nm) with the exceptions of weak absorption peaks at around 1200 nm due to vibrations in the polyatomic CH3 groups in the PDMS [35]. The silicone matrix obtained using the Sylgard 184 kit presents a very uniform group refractive index of about 1.4 (at a wavelength of 1.3 µm) [34] very close to common tissues. The extinction is however significantly increased with the rise in the titania content thus, when the light passes through the film, it would be more difficult for the photons to pass the di↵usive film. The central wavelength of the clinical OCT systems in use ( OCT = 1350nm) is represented in the graph as a vertical red line. At this wavelength the composite PDMS with a total weight percentage of 3 % TiO2has about twice the amount of the extinction of the 0.6 wt% phantom. As a result, di↵erent magnitudes of scattering from each of the phantom are expected during the OCT measurements. With this in mind, a multi-layered phantom was devised in order to reproduce the structure of actual blood vessel walls.
3.1. PHANTOM CHARACTERIZATION
The blood vessels are divided into three layers [33] that are composed of di↵erent types of cells:
• Intima, is the inner layer, mainly composed of endothelial cells has the middle OCT signal;
• Media, is the middle layer, composed by connective tissue and smooth muscle cells, has the lowest OCT signal ;
• Adventitia, is the outer layer, composed by fibrous tissue to provide support to the artery. It has the highest OCT signal from all the three layers.
In this work only the two innermost layers (Intima and Media) were considered for the phantom structure. The developed fabrication process only allowed the synthesis of layers with about 1 mm (Figure 3.4) and the stacking of three di↵erent layers led to non-malleable phantoms that were difficult to curve into the desired format for measurement in the OCT system. In future procedures, if necessary, the phantoms could be constructed with the help of a 3D printer, which would allow better control of the thickness of the layers.
Figure 3.3: Extinction vs wavelength of stock PDMS substrate and of PDMS substrates with di↵erent concentrations of TiO2nanoparticles. Obtained without the cuvette on the spectrometer: Substrate adhered to the stand (Approximate thickness of 1 mm).
Figure 3.4 represents the box plots with the variation of the thickness measurements of each of the layers. The thickness measurements were performed using the image analysis software ImageJ on the images obtained in the OCT systems, considering the pure PDMS refractive index. On both of the layers the spacing between the di↵erent parts of the box indicates some degree of dispersion of the measured thickness, which expresses an heterogeneous thickness throughout the PDMS slabs.
CHAPTER 3. RESULTS AND DISCUSSION
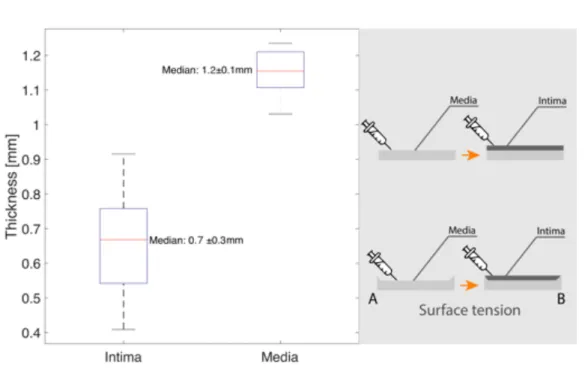
Figure 3.4: Thickness measurement distribution of each layer from optimized phantom. Surface tension causes the sides of the phantom to curve contributing to the deviations in the thickness measurement
In fact when observing the OCT cross-section of a phantom with both layers stacked (Figure 3.16) smaller thickness of the intima and larger in the media are noticed on the edges. This thickness distribution is mostly due to tensions with the mould during the fabrication process. When the first layer is poured and spread the surface tension with the mold walls creates a receding contact angle which when cured creates a protrusion in the slabs (Figure 3.4-A). In turn, when the second layer is transfered the inverse inprint occurs (Figure 3.4-B). This features in the phantom lead to the overall variations in the measured thickness.
3.1.3 Synthesis and characterization of contrast agents
The synthesised gold nanostars where optically and morphologically characterized. Fig-ure 3.5 shows the UV-Vis spectra of the 15 nm gold nano seeds (blue) used in the synthesis of the gold nanostars whose spectra is observed in red.
Extensive literature is found on both the synthesis and optical characteristics of gold nanostars [36, 37]. In all this reports two di↵erent localized surface plasmon ressonance (LSPR) modes are described, corresponding to di↵erent locations of the near electric field in the nanoparticles (central core (seed) and tips). Surface plasmons (SP), which involve collective oscillations of electrons confined to a metal/dielectric boundary, can interact strongly with incident electromagnetic fields [38]. Their behavior is directly influenced by several parameters including the structure, shape, and size. This ultimately a↵ects the optical properties of the nanoparticle, which can be observed via its UV-Visible absorption.
3.1. PHANTOM CHARACTERIZATION
Figure 3.5: Extinction spectra of the Au nanoparticle seeds and following gold nanostars from 380 - 1400 nm.
The prepared gold nanostars (GNST) display a well defined plasmon band with a maxi-mum absorbance at 810 nm (tip mode), together with a weaker shoulder around 555 nm corresponding to the core mode as shown in Figure 3.5. The GNST seeds have only one band as expected at around 555 nm. The e↵ect of the tip mode LSPR presents interest-ing possibilities as a large enhancement of the electric near field and light concentration occurs near this wavelength. A so-called "antenna e↵ect"[39]. Moreover, a study by Abhi-tosh Kedia and Pandian Senthil Kumar [36], showed that is also possible to precisely tune the gold nanostars LSPR peaks by controlling the shape of the tips. Sharper tips lead to an enhanced red-shift of the tip mode LSPR (Annex III.1 ) which can then be tuned to a region near the central wavelength of the OCT imaging where a very strong interaction occurs, enhancing the backscattered light.
Moreover, UV-Vis spectra of the GNST allowed to obtain their concentration in the measured solution. At a wavelength of 400 nm organic molecules and the surface plasmon resonance of the gold nanoparticles have only minor influence. The absorbance is mainly due to interband transitions of gold and therefore can serve as a robust measure of the concentration [40]. As so, using the Beer-lambert law the concentration of an absorbing species can be related to the absorbance (Abs400), as it has a linear relationship (Equation 3.1) [41].
Abs400= " ⇥ L ⇥ C (3.1)
Where " is the extinction coefficient (M 1cm 1), L is the optical path in cm, and C the concentration in molarity. Assuming that a extinction of 1.2 at 400 nm corresponds to a complete gold reduction (C = 0.5 mM) [42] and that the optical path corresponds to 1 cm, the extinction coefficient of gold nanoparticles (" = 2.4⇥103M 1cm 1) is initially obtained.
CHAPTER 3. RESULTS AND DISCUSSION
From here on, using the same equation, the calculation of the molar concentration of the GNST was possible to attain. This values are then used in conjunction with the morphology characteristics to obtain the value of particles/ml.
The morphological characterization by transmission electron microscopy is shown in Figure 3.6. The images were analyzed using Image J and the diameter of the gold nanos-tars was measured. For that, in image containing several GNSTs (> 100 particles), an automated algorithm was used to draw an elipse around each star and the diameter was measured. The obtained distribution is shown in Figure 3.6 for two di↵erent batches, named SA56 and MC01.
Figure 3.6: TEM images of MC01 batch of gold nanostars. Diameter distribution for MC01 (58 ± 19 nm) and SA56 (53 ± 9 nm) samples.
The GNST appeared to be relatively monodispersed with a mean diameter of 58 nm (MC01). As an example of the variation during the synthesis process of the GNST, the size distribution of a diferent batch of GNST is presented (SA56). Even though the exact procedure was done in both batches a slight variation in size is observed.
Table 3.1: GNST morphological characterization and particle count. Sample Mean Diameter [nm] Concentration [mM] Particles/mL
MC01 58.58 ± 19.46 0.302 3.9⇥1010
SA51 53.25 ± 9.78 0.555 7.2⇥1010
The ensuing analysis refers to Figure 3.7 where the recorded fluorescence emission of the nile blue dye, adsorbed to the GNST surface, is present. A laser scanning microscope was used both for the fluorescence characterization of the coded GNST, characterizing it’s spectral emission properties, and the spatial mapping of said nanoparticles in further functionalization studies. The inset in Figure 3.7 represents the confocal fluorescence maps under illumination with a 633 nm laser. In each pixel of the fluorescence confocal image, the emission spectrum was recorded using the lambda mode of the microscope. In Figure 3.7 the integrated spectral information associated to the delineated region in the recorded image are shown in the spectral range of 400 nm to 750 nm.
3.2. FUNCTIONALIZATION
Figure 3.7: Emission spectra of Nile blue dye at 5% power of a 633 nm laser.
3.2 Functionalization
3.2.1 Immobilization of GNST on the surface of PDMS
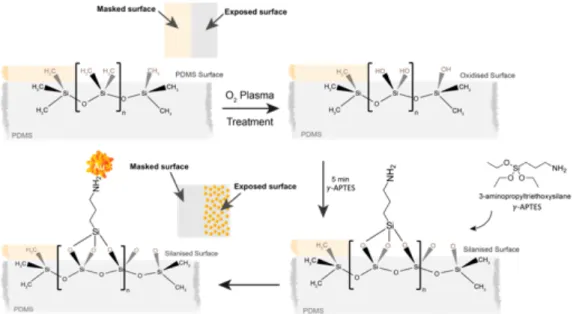
The silanization of glass substrates for the immobilization of gold nanoparticles has been for a while an efficient method of creating platforms for photonic devices, micro-electronics and biosensing [31]. In this, the well-established interaction between negatively-charged gold colloids with ionic double layer and the positively-negatively-charged amino groups is exploited. Coupling agents like amine-terminated silanes, link the inert glass and colloid gold nanoparticles using this interactions. In this work the same immobilization technique is applied to PDMS substrates. The entire procedure is represented in Figure 3.8. A selected region in the surface of the PDMS phantom was initially treated under an oxygen plasma in order replace the silane (Si–CH2) groups with silanol (Si–OH) groups, which can then react with one end of the selected amine-terminated silane.
Figure 3.8: Schematic of the GNST immobilization process. Image designed in Adobe Illustrator and MolView®.
CHAPTER 3. RESULTS AND DISCUSSION
The activation of the exposed PDMS surface creates a hydrophilic surface which al-lowed to easily evaluate if the used mask managed to create two di↵erent sections in the phantom. The PDMS is then immersed into the silane solution, where two di↵erent immersion times were tested (5 and 15 min). This step was crucial for the following depo-sition of the GNSTs, since for immersion times over 5 min no nanoparticles managed to get attached. To confirm the deposition of the GNST, a confocal fluorescence microscope was used to detect the nile blue coated GNST.
A confocal fluorescence microscopy image of the resulting un-/functionalized surface of the PDMS is present bellow (Figure 3.9). This results were obtained after the optimization of the GNST immobilization using an ethanol solution with 8.33%(V/V) APTMS silane. Three di↵erent channels were used when analyzing the samples. A transmission channel obtained through a transmission camera in the setup. A second reflection channel set to detect any reflected light from the sample with the same wavelength as the laser in use. And finally a fluorescence channel which detects the wavelengths that compose the nile blue emission spectrum (Figure 3.7). In a confocal setup the reflection channel was used to make sure that the fluorescence signal was indeed coming from the surface of the PDMS, since the majority of the reflection of the used laser is at this interface between the two di↵erent materials (air/PDMS).
Figure 3.9: Confocal microscope images of functionalized stock PDMS. A)Transmission image, B) Reflection image, C) Transmission plus fluorescence.
In Figure 3.9-C an interface is clearly visible between a region where the fluorescence signal is null (covered side) and a side where the GNST are evenly distributed trough the surface. Following, the same process was preformed for the scattering PDMS slabs and the results are presented bellow (Figure 3.10). Although the successful padronization was also achieved in this substrates another e↵ect was noticeable. The GNST accumulate in certain regions of the phantom which leads to the clusters observed in the fluorescence image. This result is believed to be due to the added titania nanoparticles in the PDMS matrix which create porous-like structures that trap GNST. Furthermore two di↵erent silane reagents were used for the immobilization technique APTMS and APTES. Initially the plan was to follow the procedure reported by Nguyen Ba Trung, et al. [31] were a
3.2. FUNCTIONALIZATION
Figure 3.10: Confocal microscope images of functionalized scattering PDMS (TiO2PDMS). A)Transmission image,B) Reflection image, C)Reflection plus fluorescence
1%(v/v) APTES solution is used to obtain the best results. However at the beginning of this work such reagent was not available thus the similar silane molecule APTMS as used. Yet to obtain obtain the same results the final concentration of APTMS (8.33 %(v/v)) had to be higher than the reported for APTES. The results using APTES (with the exact procedure as reported in [31]) are presented in the annex IV, showing an even more uniform immobilization of the GNST.
3.2.2 Biofunctionalization
In order to fully assemble the VeVo MicroMarker target-ready microbubbles, secondary antibodies had to be initially biotinylated to facilitate the immobilization with the strep-tavidin in the surface of the MB (Figure II.1). This process was done with the aid of a biotinylation reagent from Thermo Scientific (EZ-Link Sulfo-NHS-LC-Biotin (lot nr. 21335, MW: 556.59)) which allows the the direct labeling of antibodies, or any other biomolecules which contain free amine groups. The EZ-link user guide was followed in order to accomplish the best possible results.
Initially to obtain an acceptable level of incorporation of the biotin in a dilute solution of antibodies a greater fold molar excess of biotin reagent was accounted for. The user guide referred a 50-fold molar excess of biotin to label 50-200 µg in 200-700 µl of bu↵er and considering that the antibody solution in use was even more diluted (250 µg of Ab in 3.750 mL) a 60-fold molar excess of biotin reagent was considered as a better approach.
After the correct amount of biotin reagent was determined and the labeling process was performed a process of desalting or dialysis had to be devised in order to remove excess non-reacted and hydrolyzed biotin reagent that remained in the solution. A number of dialysis membranes and size-exclusion resins were studied for this process however they did not present the resolution required for the efficient separation of the small molecules of biotin, neither an e↵ective way to obtain high sample recoveries. As so, diafiltration devices that featured high-molecular weight cut-o↵s (MWCO) were the opted solution. This devices have micro-molecule permeable filters with the correct MWCO that separates immunoglobulins (>150kDa) from small proteins, peptides and even vitamins such as