DEVELOPMENT AND VALIDATION
OF A LC-MS/MS METHOD FOR
QUANTITATIVE ANALYSIS OF BISPHENOL A
AND TETRABROMOBISPHENOL A IN
SEAFOOD AND SEAWEED
Cátia Adriana Almeida Oliveira
Master in Quality Control
Faculty of Pharmacy of University of Porto
FACULDADE DE FARMÁCIA
Universidade do Porto
Desenvolvimento e validação de um método
de LC-MS/MS para a análise quantitativa de
bisfenol A e tetrabromobisfenol A em
amostras de peixe e algas
Cátia Adriana Almeida Oliveira
Dissertação do 2º Ciclo de Estudos
Conducente ao Grau de Mestre em Controlo de Qualidade
– especialização em Alimentos e Água
Trabalho realizado sob a orientação de
Doutora Sara Silva Cunha
e Professor José Oliveira Fernandes
MEDIANTE DECLARAÇÃO DO INTERESSADO, QUE A TAL SE
COMPROMETE.
i
throughout the development of this work. Due to all the difficulties overcome in the beginning of this project in which both learned, today I resolve problems more quickly. I appreciate the autonomy that her let me have throughout the year, instigating me to break my limits and go beyond the obvious.
To Professor José Fernandes for all his help finding new objectives, new visions and new challenges for me in the field of this work. His knowledge is so vast that always made me even more fascinated by the subject and want to do more and better.
To all collaborators of the Laboratory of Bromatology and Hidrology who readily helped me when I needed in the access to the materials and equipment.
To my fellow master’s course for all the lunches, all the laughter and all the conversations. Without them, I could not stop for a coffee, relax and think. Especially to Silvia, the fighter mum, to Cristina, sincere friend, to Angela, the best listener, to Claudia, the playful, to Rose, the loving, to Rita and Tiago, the couple with more quality in Oporto and surroundings.
To my dear friends, the companions I have done throughout my life. Without them I would not be complete. Thank you for all the endless hours they heard me talk about bisphenols, tupperwares, fish and algae. In particular: to Joana, my closest friend and soulmate for all the support and advices and who pulls me up to dream, and Titan, who pulls me down to earth.
To my boyfriend Édi for all the support, patience, enthusiasm and presence. His joy allowed me to overcome the darkest days and his attention to all my projects helped me improve my skills and train my presentations until they were perfect.
To my father Alfredo, the man who never stopped believing me since the day I was born. For all his advices, caring and support. To my mother Manuela, for all the love and the glitter in her eyes when she sees the little steps I am taking to a better future. They are my super-heroes and they lead me to always want to evolve more and more. To my little brother Tiago, for calming me down when the nerves take care of me, for relieving the pressure over my shoulders and even without seem, always be there aware of me and fighting for me.
ii
substances with endocrine disrupting properties, like bisphenol A (BPA) and its analogous tetrabromobisphenol A (TBBPA) has been observed. BPA is highly used in the production of polycarbonate plastics and epoxy resins used in several food containers, while TBBPA is a known brominated flame retardant (BFR) present in epoxy, polycarbonate and phenolic resins. When conditions that trigger it occur, these chemicals may leach into the ambient and accumulate, with harmful effects for both human and wildlife.
The aim of this work was the optimization of an analytical procedure based on liquid chromatography-tandem mass spectrometry (LC-MS/MS) for the simultaneous determination of BPA and TBBPA on fourty-six seafood samples and fourteen mussels samples collected in different European regions and on thirty-eight seaweed samples, both included in the ECsafeSEAFOOD project. Initially, three extraction techniques described in literature were compared. Best results were achieved with the use of QuEChERS (quick, easy, cheap, rugged, safety) procedure followed by liquid-liquid extraction, with recoveries above 70%. The optimized technique was validated concerning to linearity, precision (intraday and interday precision) and recovery.
In a total of forty-six seafood samples analysed, BPA was detected in eleven (approximately 24%) while five (approximately 11%) presented TBBPA. In seafood, the results obtained where highly variable and disperse, being different even on samples from the same specie but collected in different time or region. In mussels, both BPA and TBBPA were detected and quantified. Seaweeds did not presented any traces of these contaminants.
Despite BPA and TBBPA levels found in seafood and mussels were generally low and within the regulated and safety limits, the contamination of the endocrine disruptors (EDs) should not be ignored since there are researchers who consider that the toxicity of these compounds takes place at levels far below these stablished as limits. The absence of both EDs in the seaweeds subjected to study may indicate that the contaminants are not absorbed or phytoremediated by these. More studies should be developed concerning these contaminants in foodstuff. Optimized extraction techniques, particularly regarding fat removal from the sample prior to analysis should be developed in order to improve precision and recovery.
iii
público sobre os efeitos adversos das substâncias com propriedades de desregulação do sistema endócrino, como o bisfenol A (BPA, do inglês) e o seu análogo tetrabromobisfenol A (TBBPA, do inglês). O BPA é um composto sintético muito utilizado na produção de plásticos de policarbonato e de resinas epóxidas utilizadas em várias embalagens de alimentos, enquanto o TBBPA é conhecido como um retardador de chama bromado (BFR, do inglês) presente em resinas epóxidas, policarbonatadas e fenólicas. Em condições propícias, estes compostos podem ser libertados no ambiente e acumular-se, com efeitos nocivos para homens e animais.
O objetivo deste trabalho foi a otimização de um procedimento analítico baseado em cromatografia líquida com espectrometria de massa tandem (LC-MS/MS, do inglês) para a determinação simultânea de BPA e TBBPA em quarenta e seis amostras de peixes e catorze amostras de mexilhões recolhidas em diferentes regiões europeias e em trinta e oito amostras de algas, trabalho incluído no âmbito do projeto europeu ECsafeSEAFOOD. Inicialmente, compararam-se três técnicas de extração descritas na literatura, tendo os melhores resultados sido obtidos com o uso do procedimento QuEChERS, seguido de um
clean up líquido-líquido, com recuperações acima de 70%. A técnica otimizada foi validada
relativamente à linearidade, precisão (precisão intra-dia e inter-dias) e recuperação.
Num total de quarenta e seis amostras de peixes analisados, onze (cerca de 24%) apresentam níveis de BPA enquanto cinco (cerca de 11%) apresentam níveis de TBBPA. Nos peixes, os resultados obtidos foram altamente variáveis e dispersos, mesmo para amostras da mesma espécie recolhidas em tempo ou região diferente. Em mexilhões, ambos o BPA e o TBBPA foram detetados e quantificados. As algas não apresentaram quaisquer vestígios destes contaminantes.
Apesar dos níveis de BPA e TBBPA encontradas em peixes e mexilhões terem sido baixos e dentro dos limites regulamentados, a contaminação com desreguladores endócrinos não deve ser ignorada, até porque existem investigadores que consideram que a toxicidade destes compostos tem lugar mesmo em níveis muito inferiores aos limites em vigor. A ausência de BPA e TBBPA nas algas em estudo pode indicar que estes contaminantes não são absorvidos nem metabolizados por estas. Mais estudos devem ser desenvolvidos a respeito destes contaminantes. Técnicas de extracção optimizadas, especialmente no que respeita à remoção de gordura das amostras, devem ser desenvolvidas a fim de se obter melhores precisões e recuperações.
iv ACKNOWLEDGEMENTS………i ABSTRACT………...ii RESUMO………...iii LIST OF CONTENTS………..iv LIST OF FIGURES……….vii LIST OF TABLES………ix
ABBREVIATIONS AND SYMBOLS……….xi
I. THEORETICAL PART 1. World fisheries and seafood consumption……….1
1.1. Nutritional value of seafood………..3
1.2. Contaminants and Seafood Accumulation………...3
2. Seaweeds ………5
2.1. Nutritional value of seaweed………6
2.2. Contaminants and Seaweed Phytoremediation ………...6
3. Importance of studying BPA and TBBPA in seafood and seaweed………..…..9
4. Bisphenol A………..11
4.1. Properties of BPA………11
4.2. Sources of exposure to BPA……….12
4.3. Metabolism and toxicity of BPA……….16
4.4. Legislation………18
5. Tetrabromobisphenol A……….20
5.1. Properties of TBBPA………...20
5.2. Sources of exposure to TBBPA………21
5.3. Metabolism and toxicity of TBBPA………23
5.4. Legislation………24
6. Brief review of analytical methodology……….26
6.1. Sample preparation……….26
6.2. Liquid-liquid extraction (LLE) and solid phase extraction (SPE)………..27
6.3. Solid phase microextraction (SPME)………28
6.4. Matrix solid phase dispersion (MSPD)……….29
6.5. QuEChERS………..30
6.6. Dispersive liquid liquid microextraction (DLLME)………30
6.7. Soxhlet extraction………31
6.8. Pressurized Liquid Extraction (PLE)……….32
v
6.10.2. Liquid chromatography coupled to mass spectrometry (LC-MS) and tandem mass
spectrometry (LC-MS/MS)…………...………..35
6.10.3. Gas chromatography coupled to mass spectrometry (GC-MS)………….………..38
6.10.4. Immunochemical techniques………...40
7. BPA and TBBPA occurrence in seafood ………...43
7.1. Bisphenol A………..43
7.2. Tetrabromobisphenol A………..47
8. BPA and TBBPA occurrence in seaweed ………..………...52
II. EXPERIMENTAL PART 1. Chemicals and reagents………..……….55
2. Standards and quality control materials………..………...…55
3. Sampling………..………..56
4. Sample preparation………..……….61
5. LC-MS/MS equipment and conditions………..………..63
III. RESULTS AND DISCUSSION 1. Optimization of the analytical methodology to quantify BPA and TBBPA by LC-MS/MS……….……64
1.1. Optimization of chromatographic conditions………..………64
1.2. Optimization of extraction conditions………..………69
2. BPA and TBBPA determination in SEAFOOD………..………73
2.1. Validation………..………..73
2.1.1. Linearity………..……….………...73
2.1.2. Precision………..……….………..75
2.1.3. Recovery………..………..75
2.1.4. Method detection limit (MDL) and method quantification limit (MQL)………...………..………..76
2.1.5. Levels of BPA and TBBPA in Seafood…...….……….………..77
3. BPA and TBBPA determination in MUSSELS………..………81
3.1. Validation………..………..81
3.1.1. Linearity ………..……….…………..81
3.1.2. Recovery………..………....………..82
3.1.3. Method detection limit (MDL) and method quantification limit (MQL)………...………..………..83
3.1.4. Levels of BPA and TBBPA in Mussels…….……….………..…84
4. BPA and TBBPA determination in SEAWEED………..……86
3.1. Validation………..………..86
vi
(MQL)………...………..……….88
3.1.4. Levels of BPA and TBBPA in Seaweed...………...………89
IV. CONCLUSIONS………..………..93
vii
Figure 1 World capture fisheries and aquaculture production………...…….….…1
Figure 2 World seaweed production……….……….……..5
Figure 3 Phytoremediation processes applicable for the remediation of toxic compounds by plants………...………..7
Figure 4 Synthesis of bisphenol A from the reaction of phenol with acetone in the presence of an acid catalyst………...……….11
Figure 5 Production of polycarbonate by the condensation polymerisation reaction of BPA and carbonyl chloride………...12
Figure 6 Production of epoxy resins………..……….13
Figure 7 Thermal paper………..………..14
Figure 8 Schematic diagram depicting the glucuronidation of BPA in the liver and the route of elimination of unconjugated BPA from serum in rodents and primates after initial absorption from the gut and transport to the liver……….16
Figure 9 Elements of the NIEHS BPA research program. NIOSH, National Institute for Occupational Safety and Health………..………..….18
Figure 10 Tetrabromobisphenol A………...20
Figure 11 TBBPA application in expoxy resins in printed circuit boards ..……….…21
Figure 12 SPME device consists of a fused-silica fibre coated with an appropriate stationary phase attached to a modified microsyringe………....28
Figure 13 ESI fussl scan mass spectrum of tetrabromobisphenol acquired in negative ion mode……….………..……….…37
Figure 14 EI mass spectra of BPA………...………...38
Figure 15 Electron impact mass spectra of BPA O-bis(trifluoroacetyl) derivative……….38
Figure 16 Chemical structures of the haptens of BPA used to develop the immunoassay. BPAA: 2-[4-(1-(4-hydroxyphenyl)-1-methylethyl) phenoxy])acetic acid; BPAB: 4-[4-(1-(4-hydroxyphenyl)-1-methylethyl) phenoxy]butyric acid; BPAH: 6-[4-(1-(4-hydroxyphenyl)-1-methylethyl) phenoxy]hexanoic acid; BPVA: 4,4-Bis(4-hydroxyphenyl)-valeric acid...…40
Figure 17 Biotin-streptavidin amplification system…………...………..41
Figure 18 VHH-AP coating of TBBPA and immunoassay…………..………..42
viii
South China, and GC-MS detection………...………....……53
Figure 21 Sample preparation QuEChERS and LLE procedures steps prior to
LC-MS/MS analysis………...……….….63
Figure 22 LC-MS/MS apparatus………...………...64
Figure 23 Ion spectrum of BPA after direct infusion in the MS/MS system with collision at 30 kV. The product ions selected from BPA confirmation and quantification were 211.43 m/z and 133.14 m/z, respectively………....67
Figure 24 Ion spectrum of TBBPA after direct infusion in the MS/MS system with collision at 40 kV. The product ions selected from TBBPA confirmation and quantification were 446.00 m/z and 419.87 m/z, respectively………...67
Figure 25 Ion spectrum of BPAd16 after direct infusion in the MS/MS system with collision at 20 kV. The product ions selected from BPA confirmation and quantification were 223.25 m/z and 142.18 m/z, respectively………...…68
Figure 26 Ion spectrum of BPB after direct infusion in the MS/MS system with collision at 26 kV. The product ions selected for BPB confirmation and quantification were 226.83 m/z and 212.32 m/z, respectively………..68
Figure 27 LC-MS/MS product ions chromatogram of a solution of 100 ng/mL BPA and TBBPA and 40 ng/mL BPAd16 and TBBPA13C12 after extraction with Gallart-Ayalla method (Gallart-Ayala et al., 2013)………..………..……69
Figure 28 LC-MS/MS product ions chromatogram of a solution of 100 ng/mL BPA and TBBPA and 40 ng/mL BPAd16 and TBBPA13C12 after extraction with a mixture of ethyl acetate/MeOH (1:1, v/v) followed by a clean-up in a 5 min ultrasounds bath and salting-out with the addition of 4 g MgSO4 and 1 g NaCl and 7 mL ultra-pure MilliQ water……….…...71
Figure 29 LC-MS/MS product ions chromatogram of a solution of 100 ng/mL BPA and TBBPA and 40 ng/mL BPAd16 and TBBPA13C12 after extraction with
acetonitrile followed by a salting-out with the addition of 4 g MgSO4 and 1 g NaCl and 7 mL ultra-pure MilliQ water and clean-up with n-hexane/MTBE (3:1, v/v) and n-hexane/benzene (3:1, v/v)……….…72
Figure 30 LC-MS/MS product ions chromatogram of a solution of 100 ng/mL BPA and TBBPA and 40 ng/mL BPAd16 and TBBPA13C12 after extraction with
acetonitrile followed by a salting-out with the addition of 4 g MgSO4 and 1 g NaCl and 7 mL ultra-pure MilliQ water with 100 µL of HCl 0.01 M and clean-up with n-hexane/MTBE (3:1, v/v) and n-hexane/benzene (3:1, v/v)……….74
Figure 31 Calibration curve with monkfish large from Round I samples extracted TBBPA standard solutions (n=2)………...……75
ix
Table 1 Fish production in 2000 and 2004 and expectations for future years. Adapted from: FAO Review of the state of world marine fishery resources. Rome, 2005………..……….2
Table 2 BPA levels (ng/g) found in canned seafood from different studies since 2010. *average; nd: non-detected……….……….44
Table 3 TBBPA levels (ng/g) found in river and sea fish samples from different studies since 2004. *average; nd: non-detected………...…….48
Table 4 Seafood species from Round I (captured in April-June, 2014) for BPA and TBBPA analysis and their respective location……….….57
Table 5 Seafood species from Round II (captured in September-January, 2015) for BPA and TBBPA analysis and their respective capture location……..…...59
Table 6 Number of seaweed samples analysis for each contaminant (BPA and
TBBPA) and times of collection……….……..61
Table 7 Optimized conditions to LC-MS/MS analysis of BPA and TBBPA, with the I.S. BPAd16 and BPB (for seaweed samples) for BPA and TBBPA13C12 for TBBPA determination………..65
Table 8 Calibration curves equations obtained from the analysis of Round I and Round II selected samples fortified with BPA and TBBPA at crescent concentrations and respective correlation coefficient (R2). I.S. at 40 ng/ml………..…..77
Table 9 Intra-day precision in RSTD (%) of BPA and TBBPA after extractive procedure in large monkfish sample from Round I (n=6)………...78
Table 10 Inter-day precision in RSTD (%) of BPA and TBBPA after in large monkfish sample from Round I (n=6)………...78
Table 11 Recovery (%) of BPA and TBBPA and respective STD after extractive
procedure in large monkish from Round I (n=6)………..……....79
Table 122 MDL and MQL (ng/g dw) for both BPA and TBBPA determined in large
monkfish sample from Round I...……….79
Table 13 BPA and TBBPA levels (ng/g dw) found in seafood samples from Round I (n=2). nd=not detected……….……80
Table 14 BPA and TBBPA levels (ng/g dw) found in seafood samples from Round II (n=2). nd=not detected……….……81
Table 15 Calibration curves equations obtained from the analysis of mussels sample fortified with BPA and TBBPA at crescent concentrations and respective correlation coefficient (R2). I.S. at 40 ng/mL………..……...85
x
Table 17 MDL and MQL (ng/g dw) for both BPA and TBBPA determined in mussel samples………...86
Table 18 BPA and TBBPA levels (ng/g dw) found in mussel samples from Rounds I and II (n=2).nd=not detected……….…………..87
Table 19 Calibration curves equations obtained from the analysis of seaweed sample fortified with BPA and TBBPA at crescent concentrations and respective correlation coefficient (R2). I.S. at 80 ng/mL………..…….………..90
Table 20 Recovery (%) of BPA and TBBPA and respective STD after extractive
procedure in seaweed samples………...……….……..90
Table 21 MDL and MQL (ng/g dw) for both BPA and TBBPA determined in seaweed samples, 360h after addition of a solution of 10.0 ng/mL BPA and TBBPA…91
Table 22 BPA and TBBPA levels (ng/g dw) found in seaweed samples with different spiking and collected at different times (n=2) from the 10 ng/mL BPA and TBBPA concentrated media. nd=not detected………..…92
xi
AA Anhydride acetic
ABS Acrylonitrile Butadiene Resins
AP Alkaline phosphatase
APCI Atmosphere-pressure chemical ionization
BADGE Bisphenol A dyglicyl ether
BA-ELISA Biotin-streptavidin amplified ELISA
BAN Bromoacetonitrile
BFDGE Bisphenol F dyglicyl ether
BFR Brominated flame retardant
BPA Bisphenol A
BPA-G Bisphenol A monoglucuronide
BPA-LC Bisphenol A leaching velocity
BPB Bisphenol B
BSA Bovine serum albumine
BSTFA N-O-bis(trimethylsilyl)trifluoroacetamide
bw body weight
C18 Octadecyl bonded encdcapped silica
C8 Octyl bonded endcapped silica
DCM Dichloromethane
DDT Dichlorodiphenyltrichloroethane
DLLME Dispersive liquid-liquid microextraction
dw dry weight
ECNI Electron chemical negative ionization
ED Endocrine disruptor
EFSA European Food Safety Authority
ELISA Enzime-Linked Immunosorbent Assay
EPA Environmental Protection Agency
ESI Electrospray ionization
EU European Union
FDA Food and Drug Administration
FMS Fluid Management Systems
GC Gas chromatography
GC-MS Gas chromatography-mass spectrometry
GC-MS/MS Gas chromatography tandem mass spectrometry
GPC Gel permeation chromatography
HBB Hexabromobenzene
HBCDD Hexabromocyclododecane
IPMA Instituto Português do Mar e da Atmosfera
LC Liquid chromatography
LC-MS Liquid chromatography-mas spectrometry
LC-MS/MS Liquid chromatography tandem mass spectrometry
LD50 Median lethal dose
LC50 Median lethal concentration
LLE Liquid-liquid extraction
xii
MCF Methylchloroformate
MDL Method detection limit
MeCN Acetonitrile
MeOH Methanol
MIPs Molecular Imprinted Polymers
MQL Method quantification limit
MRM Multiple reaction monitoring
MS Mass spectrometry
MSFD Marine Strategy Framework Directive
MSPD Matrix solid-phase dispersion
MTBE tert-butylmethyl ether
MW Molecular weight
nd not detected
NIEHS National Institute of Environmental Health Sciences
NOEL No observable effect level
NOGE Novolacs diglycidyl ether
NP 4-nonylphenol
NTP National Toxicological Program
OP 4-tertoctylphenol
PAH Polycyclic aromatic hidrocarbons
PBDE Polybrominted diphenyl ether
PC Polycarbonates
PCB Perchlorinated biphenyls
PCP Polycarbonate plastic
PFC Perfluorinated compounds
PLE Pressurized liquid extraction
POC Persistent organic compounds
QMS Quadrupole mass analyser
REACH Commission Regulation No. 1907/2006 concerning the Registration,
Evaluation, Authorization and Restriction of Chemicals
RfD Reference Dose
SCHER Scientific Committee on Health and Environmental Research
SPE Solid-phase extraction
SPME Solid-phase microextraction
STD Standard deviation
TBBPA Tetrabromobisphenol A
TDI Tolerable dose intake
THF Tetrahydrofuran
TMCS Trimethylchlorosilane
UPLC Ultra performance liquid chromatography
1
1. World fisheries and seafood consumption
According to European Regulation No. 853/2004 “seafood comprises fishery products and live bivalve molluscs, and no distinction is made between products coming from the sea and other sources, nor between wild catch and aquaculture species”. It states that fishery products include “all seawater or freshwater animals (except for live bivalve molluscs, live echinoderms, live tunicates and live marine gastropods, and all mammals, reptiles and frogs) whether wild or farmed, and including all edible forms, parts and products of such animals” (ECR, 2004).
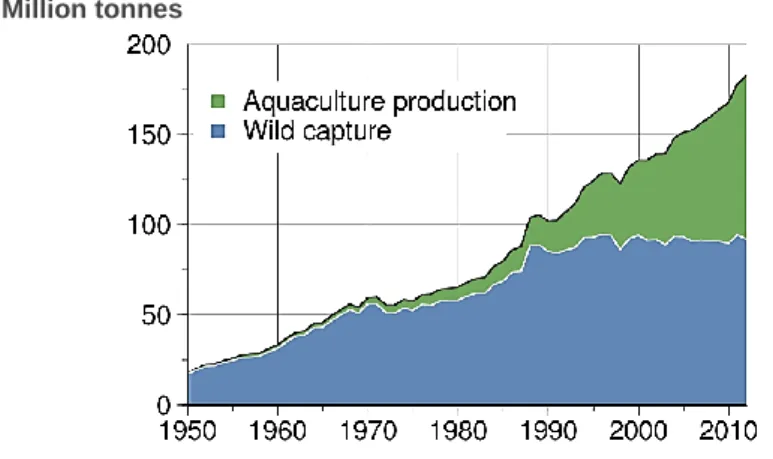
Fish production has been growing in the last five decades, as can be seen in Figure 1, in aquaculture as well as the capture of rivers and oceans. Global capture fishery production of 93.7 million tonnes in 2011 was the second highest ever (93.8 million tonnes in 1996) (FAO, 2014). In 2009, the Northwest Pacific area was the largest contributor to global fish supply (25%), followed by Southeast Pacific (16%) and Western Central Pacific (14%), while the sixteen remaining marine fishing areas comprise 45% of average catches (FAO, 2011). In 2014, the Northwest and Western Central Pacific are the areas with highest and still-growing catches (FAO, 2014).
Figure 1 – World capture fisheries and aquaculture production. Adapted from: FAO World Review of Fisheries and Aquaculture. Rome, 2014
2
In 2011, the highest caught groups at the global level were: herrings, sardines, anchovies; tunas, bonitos, billfishes, and cods, hakes, haddocks (FAO, 2013b). These species are the more commonly consumed by human population and in 2011, 85% of production derived for human consumption while the other 15% was destined to non-food purposes like reduction to fishmeal and fish oil, utilization as fish for ornamental purposes, for culture (fingerlings, fry, etc.), for bait, for pharmaceutical uses as well as raw material for direct feeding in aquaculture, for livestock and for animals (FAO, 2012). However, a considerable portion of the fish consumed in developed countries is not due to their own production but from imports, being expected an increasing tendency in coming years, mostly owing to steady demand and declining of domestic fishery catch (FAO, 2012).
Table 3 - Fish production in 2000 and 2004 and expectations for future years. Adapted from: FAO Review of the state of world marine fishery resources. Rome, 2005.
In Europe, seafood consumption varies widely across countries. Consumption is concentrated in the South, especially Spain and Portugal, where each consumer eats more than 40kg of seafood per year. In the South, consumers eat a wide variety of seafood including squid, shrimp, tropical fish and locally captured fish. In the Netherlands and Western Europe, each consumer eats 15-25 kg of seafood per year. The variety of fish is smaller in Western Europe than in the South. Eastern European consumers eat 5-10 kg of seafood per year and tend to eat locally produced carp or imported fish such as pangasius and tuna (FAOSTAT, 2014).
2000 2004 2010 2015 2020 2020 2030
Capture (MT) 95.6 95.0 93 105 93 116 93
Aquaculture (MT) 35.5 45.5 53 74 70 54 83
Total production (MT) 131.1 140.5 146 179 163 170 176
3
1.1.
Nutritional value of seafood
Researchers worldwide are in agreement that eating fish regularly - one or two servings weekly - may be very effective on the promotion of a healthy life. Being a high-protein, low-fat food and an excellent source of omega 3 low-fatty acids, fish consumption are known to reduce the risk of various diseases and disorders like cancer, cardiovascular, dementia, depression, diabetes, among others (Domingo, 2014) as well as may prolong life after a heart attack, lowers blood triglycerides (fats), may improve heart, can lower blood pressure and may decrease symptoms of inflammatory diseases, arthritis and psoriasis.
A portion of 150 g of fish can provide about 50–60 percent of an adult’s daily protein requirements. In 2010, fish accounted for 16.7 percent of the global population’s intake of animal protein and 6.5 percent of all protein consumed (FAO, 2014).The cholesterol content of most fish is similar to red meat and poultry, however some fish are relatively high in fat such as salmon, mackerel and catfish but most of the fat it has is poly-unsaturated. Omega 3 fatty acids help lower blood pressure and triglyceride levels. Fish is also a good source of B Vitamins B-6, B-12, biotin and niacin. Vitamin A is found mainly in fish liver oils, but some high fat fish are good sources of this vitamin. Fish is also a good source of several minerals, especially iron, phosphorus, potassium and zinc. Canned fish with edible bones, such as salmon or sardines, are also rich in calcium (Domingo, 2014).
1.2.
Contaminants and Seafood Accumulation
Marine ecosystems are the end point of several chemicals that are present in rivers by discharges or atmospheric deposition. These environmental problem is not only a potential ecological hazard but also a public health hazard since these pollutants can be present in marine food items through accumulation in marine biota (Vandermeersch et al., 2015). Contamination of seafood during production, processing and storage can also occur.
Fish and shellfish have been identified as the food items typically showing the highest concentrations of a number of harmful environmental contaminants (Llobet et al., 2003, Bocio et al., 2005) like perchlorinated biphenyls (PCBs), dioxins, residues of pesticides, toxic elements, and new emerging contaminants (Domingo, 2007).
Nowadays, emerging organic pollutants can vary from pharmaceuticals and hormones to pesticides, surfactants and plasticizers. Simultaneously to the decrease of many legacy persistent organic contaminants (POCs), such as dichlorodiphenyltrichloroethane (DDT)
4
and PCBs, in Arctic marine biota, new contaminants are emerging, like perfluorinated compounds (PFCs) (Cruz et al., 2015).
According with the European Union (EU) Marine Strategy Framework Directive (MSFD) (Directive 2008/56/EC; ECD, 2008), “Priority Contaminants” embraces all harmful contaminants in seafood that might constitute a risk for human health and for which there are scarce scientific knowledge. It includes substances for which no maximum levels have been laid down yet (in EU legislation or international standards), as well as substances for which maximum levels have been provided but require revision.
In 2010, the MSFD compiled the regulatory levels for some substances, including heavy metals (lead, cadmium and mercury), polycyclic aromatic hydrocarbons (PAHs), polychlorinated dibenzo-p-dioxins, polychlorinated dibenzofurans, dioxin-like PCBs, and radionuclides, establishing seven classes of compounds as chief Priority Contaminants, ordered according to priority as: 1) Non-dioxin-like PCBs (congeners #28, 52, 101, 138, 153 and 180); 2) BFRs; 3) PFCs; 4) Arsenic (total and inorganic); 5) Organotincompounds (tributyltin, triphenyltin, dibutyltin); 6) Organochlorine pesticides (chlordane, dichlorodiphenyltrichloroethane, dicofol, endosulfan, heptachlor, aldrin, dieldrin, endrin, hexachlorocyclohexane, toxaphene, hexachloro-benzene), and 7) Phthalates (benzylbutylphthalate, dibutyl phthalate, di-2-ethylhexyl phthalate, diisodecyl phthalate, diisononyl phthalate, diisobutyl phthalate) (Swartenbroux et al., 2010).
Meanwhile, several governmental and health authorities became highly concerned with seafood quality and safety, increasing regulation for specific contaminants and supporting the development of specific actions regarding major sea-related challenges.
The information currently available on the levels of several emerging environmental contaminants in seafood is rather fragmented and is not harmonized which may hinder the elaboration of seafood risk assessment. Therefore, a unique European database (www.ecsafeseafooddbase.eu), based on information collected from scientific literature, reports and monitoring programs concerning emerging contaminants levels in seafood, was developed within the ECsafeSEAFOOD project (www.ecsafeseafood.eu).
5
2. Seaweeds
Seaweeds are macroscopic, multicellular, marine algae attached to rock or other hard substrata that have been used over the centuries in many applications: food, filtration, fertilizer, gelling agents and others (Fleurence, 1999).
According to CEVA, the French study center for algal development, world production of seaweed has been increasing constantly since 1950, reaching 14.7 million tonnes in 2009 (Figure 2). Almost all of this production comes from Asia with Europe representing just 0.01%. An estimated 800 tonnes per year of seaweed is harvested in France with 23 different varieties being authorized for food use (CEVA, 2009).
This is leading to an innovative product range including spreadable, salads, marinates as well as salted and dehydrated presentations. It has gained more acceptances in regions like California and Hawaii, where communities of Japanese are larger. On the east coast of United States of America and Canada, some companies have begun cultivating seaweeds for human consumption, and their markets are growing. With the current trend for consumers to embrace organically grown foods and "natural" foods from clean environments, seaweeds should receive an increasing acceptance (FAO, 2003).
These algae are consumed by coastal people, particularly in East Asia, e.g. Japan, China, Korea, Taiwan, Singapore, Thailand, Cambodia, and Vietnam and also in South Africa, Indonesia, Malaysia, Belize, Peru, and Chile, where they are normally
6
eaten fresh seaweeds as salad components. Since people from these countries have migrated to other parts of the world, nowadays there are more countries consuming seaweeds in a normal daily basis. Although still a niche product in Europe, seaweed is also becoming better known and is considered a natural food and ingredient (CEVA, 2009).
2.1.
Nutritional value of seaweeds
There are three types of seaweeds that can be distinguished based on their nutrient and chemical composition: brown algae (phylum Ochrophyta, class Phaeophyceae), red algae (phylum Rhodophyta), and green algae (phylum Chlorophyta, classes Bryopsidophyceae, Chlorophyceae, Dasycladophyceae, Prasinophyceae, and Ulvophyceae). Red and brown algae are mainly used as human food sources (Ratana-arporn and Chirapart, 2006).
. Compared to terrestrial animals and plants, seaweeds are rich in dietary fibre, omega 3 fatty acids, essential amino acids, and vitamins A, B, C and E. Despite having a simpler appearance, these seaweeds are high in nutrients and pack a variety of health benefits. These include digestive health, cholesterol-lowering effects and weight loss (Rajapakse and Kim, 2011).
In addition to their use as food, macroalgae have been much in demand for environmental technology.
2.2.
Contaminants and Seaweed Phytoremediation
The introduction of organic pollutants and heavy metals in the aquatic systems through industrial discharges, agricultural uses, or waste disposal can cause serious problems. The persistence of these chemicals in the environment can lead to its destruction as well as damage to organisms, affecting negatively the stability of many aquatic ecosystems and can also cause adverse effects on human health (Perelo, 2010).
Recently, there has been increasing interest on a green technology that uses certain plant species, as algae, which accumulate, translocate and concentrate high amounts of certain toxic elements in their aboveground/harvestable parts. This happens via
7
mechanisms involving photosynthesis, transpiration, metabolism and mineral nutrition to remove degrade or render harmless pollutants in aquatic systems. It is called phytoremediation (Jatav and Singh, 2015) and has several different process associated with it (Figure 3).
Natural contamination of freshwater by heavy metals (Cd, Pb, Se, As…) has become a crucial water quality problem in many parts of the world. For example, one of the main causes of the widespread arsenic poisoning is the growing current trend around the world of drinking water from polluted underground and surface water, naturally and anthropogenic sources.
Macroalgae are capable of accumulating metals within their tissues by their immobilization in the cell wall or by their compartmentalization in vacuoles. This ability led to their widespread use as biomonitors of metals availability in marine systems. Chlorophyta and Cyanophyta are hyper-absorbents and hyper-accumulators for arsenic and boron, absorbing and accumulating these elements from their environment into their bodies (Chekroun and Baghour, 2013). Another mechanism of remotion of heavy metals from the aquatic environment results from the strong affinity of these metals to some cell wall
PHYTOEXTRACTION
Uptaking of pollutants, translocation into plant and storage in the aboveground/harvestable parts.
PHYTODEGRADATION Modification, inactivation, degradation or immobilization of the polluants through plants mechanisms.
RHIZOFILTRATION Absorption and adsorption of aquatic pollutants by algae.
Figure 3 – Phytoremediation processes applicable for the remediation of toxic compounds by plants.
PHYTOVOLATILIZATION Removal of contaminants from soil and water and consequent release in the form of gas.
PHYTOSTABILIZATION Reduction of the mobility and phytoavailability of pollutants in soil/water but no remotion.
8
components in macroalgae. It is the example of the brown algae (Phaeophyta) which accumulate metals due the high levels of sulfate polysaccharides and alginates within their cell walls (Chekroun and Baghour, 2013). Other metals have been eliminated from the environment like lead, nickel, copper, cadmium, strontium, chromium, mercury U(VI) by marine micro and macroalgae (eg. Chlorella, Ulva, Sargassum, Fucus and Ascophyllum) (Cheney et al., 2014).
There have been very few studies, however, that have examined the ability of macroalgae to accumulate persistent organic pollutants from marine waters or sediments. The earliest report of a macroalgae taking up and concentrating PCB from sediment is that of Larsson (1987) who described the ability of a freshwater green macroalga, Cladophora glomerata, to take up and concentrate PCBs to a level of 3.6 µg/g dry weight (dw) from an artificial fresh water pool containing sediment with a PCB concentration of 2.7 µg/g dw after two months (Larsson, 1987). Recently, Wang and Zhao (2007) reported that Laminaria
japonica, in laboratory conditions, have great ability to take up and metabolize
phenanthrene and pyrene. At a PAH concentration level of 0.1 mg/L, the seaweed tolerated and survived well for up two weeks and 90% phenanthrene and pyrene were removed and subsequently degraded (Wang and Zhao, 2008).
Some microalgae species have shown to biotransform organic pollutants such as chlorophenol, bisphenol A and tetrabromobisphenol A, which can be an important first step for its subsequent degradation in the environment (Hirooka et al., 2005, Sun et al., 2007). Hirooka et al. in 2005, studied the removal of BPA by the green alga Chlorella fusca. The investigators considered that C. fusca can be considered a useful organism to remove BPA from landfill leachates since this seaweed was able to remove BPA from the media with a capacity depending on the light/dark conditions (Hirooka et al., 2005). The accumulation of TBBPA and its consequent biological responses were examined in coontail (Ceratophyllum
demersum L.) in the study of Sun et al. (2007). Most of the TBBPA was accumulated after
4 day exposure and TBBPA concentration in plant increased with decreasing TBBPA concentration in growth solution. The researchers found that the TBBPA exposure increased total free radicals generation in the plants as well as lipid peroxidation and decreasing on the chlorophyll content. These results suggested that C. demersum is able to accumulate TBBPA removing it from the environment, which induces oxidative stress (Sun et al., 2007).
9
3. Importance of studying BPA and TBBPA in
seafood and seaweed
Synthetic chemicals like TBBPA and BPA are included in the group of priority environmental contaminants in seafood. Because of the persistence, bioactivity and bioaccumulation potential, concern is increasing about the possible harmful effects on ecosystems and human health.
Despite having a soil half-life of only 1–10 days, BPA's ubiquity makes it an important pollutant. In 2010, the U.S. Environmental Protection Agency reported that over one million pounds of BPA are released into the environment annually (Erler and Novak, 2010). BPA can enter the environment either directly or indirectly. Directly in the leaching from chemical, plastics coat and staining manufacturers, from paper or material recycling companies, or indirectly in the leaching from plastic, paper and metal waste in landfills (EPA, 2011) or ocean-borne plastic trash (Barry, 2009). This could lead to aquatic environment contamination and consequently to the wild life and plants in that habitat. Even though a study conducted in the US in 2005 had found that up to 91% of BPA may be removed from water during treatment at municipal water treatment plants (Drewes et al., 2005), a 2009 analysis of BPA in the water system showed that this ED is present in the surface water and sediment in the US and Europe (Klečka et al., 2009).
Resulting from the bromination of BPA, TBBPA is its tetrabrominated form, TBBPA released into wastewater would likely be transported to a treatment facility. Most TBBPA entering a treatment plant will sequester into sludge, which can be applied to soil; however, small amounts (Kuch and Ballschmiter, 2001) have also been measured in final effluents discharged into receiving waters. Materials in landfills are subject to weathering, releasing TBBPA particulates or polymer-associated TBBPA, primarily into soil and, to a lesser extent, water and air. Currently, there have been no experiments conducted on the leachability of TBBPA from polymers in landfills; however, leaching over extended time periods is a possibility given that TBBPA has some solubility in water (EU RAR 2008). Uncontrolled burns and accidental fires may release TBBPA into air, and ash from both controlled and uncontrolled incineration may contain TBBPA and other potentially hazardous degradation products (EU RAR 2008).
10
Aware that seafood is a major dietary route for human exposure to these widespread contaminants, one of the main purposes of ECSafeSEAFOOD was the monitorization of the priority environmental contaminants in seafood and the assessment of the effects of industrial and home preparation on contaminant content. In this work, we tried to access the levels of BPA and TBBPA in several seafood from rivers, seas, oceans, and aquaculture in their raw form as well as cooked. This evaluation was also made in seaweeds commonly used in feeding a large part of world population. Regarding this, is fundamental to introduce these two chemicals with a resume of their most important properties, sources of exposure, metabolism routes and associated legislation, further enhancing various aspects of possibilities for their detection and quantification in food products.
11
4. Bisphenol A
4.1.
Properties of BPA
Bisphenol A, also known as BPA or 4-[2-(4-hydroxyphenyl)propan-2-yl]phenol, is one of the highest-volume chemicals produced worldwide (Schug et al., 2012). It results from the condensation of 2 mol of phenol with 1 mol of acetone in the presence of an acid catalyst (Figure 4). It has the chemical formula C15H16O2, with a molecular weight (MW) of 228.29 g/mol belonging to the group of diphenylmethane derivatives and bisphenols. BPA is a moderately water-soluble compound (300 mg/L at room temperature) and it dissociates in an alkaline environment (pKa 9.9–11.3).
In 2011, the global BPA production reached approximately 4.4 million tonnes. In 2012, it grew by just over 372,000 tonnes if compared to the previous year and surpassed the 4.7 million tonnes mark. Asia is the dominant BPA manufacturer with nearly 53% share of the overall production volume followed by Europe and North America, holding 25% and 18% market shares, respectively. The USA, Taiwan, China, South Korea and Japan are the top five BPA producers worldwide (World BPA Production Grew by Over 372,000 Tonnes in 2012. Available from: http://mcgroup.co.uk/news/20131108/bpa-production-grew-372000-tonnes.html).
Figure 4 – Synthesis of bisphenol A from the reaction of phenol with acetone in the presence of an acid catalyst.
12
4.2.
Sources of exposure to BPA
4.2.1. Packages
BPA is used in the production of Polycarbonates (PC). These are a group of thermoplastic polymers produced by the condensation/polymerisation reaction of BPA and carbonyl chloride (Figure 5) or by melt-transesterification reaction between BPA and diphenylcarbonate used in a wide variety of common products including baby bottles, water bottles, digital media (e.g. CDs, DVDs), electronic equipment, automobiles and medical devices.
Leakage of BPA from PC into liquid foods can occur in two different manners: i) diffusion of residual BPA present in PC after the manufacturing process and hydrolysis of the polymer, metal ion or acid base catalysed when in contact with aqueous food and stimulants (Mercea, 2009); ii) release of BPA from PC containers into food dependent on the contact time, temperature, and type and pH of the food stimulant (Hoekstra and Simoneau, 2013, Aschberger et al., 2010, Kitahara et al., 2010). High temperatures as well as acidic and alkali solutions cause polymer degradation via hydrolysis, resulting in increased BPA migration. After incubation for 8, 72, and 240 h in food-simulating solvents (10% ethanol at 70°C and corn oil at 100°C), mean BPA migration increased with incubation time (Wong et al., 2005). After a sequence of washing and rinsing, Le et al. (2008) found that new PC bottles leached 1.0 ± 0.3 µg/mL BPA (mean ± standard deviaton (STD)) into the bottle content after incubation at room temperature for 7 days (Le et al., 2008). Sajiki and Yonekubo have observed that BPA leaching velocity (BPA-LV) from a polycarbonate plastic (PCP) to a solution of 50 mM glycine at pH 6 or 7 was twice that to control water, and leaching was enhanced above pH 8. At pH 11, BPA-LV was significantly higher in 50 mM glycine and methionine solutions than in 50 mM NaOH. These results indicate that
Figure 5 – Production of polycarbonate by the condensation polymerisation reaction of BPA and carbonyl chloride. Adapted from: http://en.wikipedia.org/wiki/Polycarbonate
13
basic pH and amino acids contained in water could accelerate BPA leaching (Sajiki and Yonekubo, 2004).
As an answer to consumer worries, companies have been producing “BPA-free” plastic water bottles, alternatives to PC plastic bottles. However, epoxy derivatives of BPA are still the most common monomer substrates used to form the “epoxy resin” polymer (Cooper et
al., 2011).
Epoxy resins represent the second largest use for BPA (Figure 6). With good mechanical properties (high temperature and chemical resistance), they are used as thermosetting polymers with an extensive range of applications. This polymer is present in nearly all soda and beer cans and also in the most diverse canned foods such as fish, vegetables, fruit and other foods with this type of conservation (WUR, 2012). Despite of epoxy resins as inner coatings protect several metallic food cans from rusting and corrosion, the sterilization process can be responsible for the leach of BPA from the can into the food (Múngia-López et al., 2005, Sajiki et al., 2007). Factors such as coating types, amount of coating, manufacturing and processing conditions appear to be highly important factors influencing the amount of migrated BPA into the food(Goodson et al., 2004).
Several studies report the presence of BPA in canned foodstuff worldwide. For example, recently the study of Geens et al. in 2010, where BPA concentrations in canned beverages ranged from <0.02 µg/l to 8.10 µg/l (Geens et al., 2010), and the study of Cunha
et al. (2011) that reported the presence of BPA and bisphenol B (BPB) in canned beverages
14
and powdered infant formula in the Portuguese market. In this study, BPA was detected in twenty-one of thirty canned beverages (ranging from 0.03 to 4.70 µg/l) and in two of seven powdered infant formula samples (0.23 and 0.40 µg/l) (Cunha et al., 2011). The potential exposure is dependent on contact surface, time and temperature and is more likely to happen with the high temperature processing conditions and the long shelf-life of canned foods(Rathee et al., 2012).
Another application of BPA is on thermal paper, which is used as point-of-sale receipts, labels, tickets, and print-outs from recording for example. This is a special fine paper that is coated with a chemical that changes color when exposed to heat (Figure 7). This coating is made from a leuco dye and a phenol developer such as BPA. On printing, a thermal head causes the coating components to melt and react with each other, causing the dye to become dark(Mendum and Stoler, 2011, Bierdermann et al., 2010).
Exposure can occur through oral and dermal exposure, although there is no consensus about absorption of BPA through the skin (Environmental Working Group, 2010). Biedermann et al. (2010) discovered that the total mass of BPA on a receipt is 250–1000 times higher than the amount of BPA typically found in a can of food or baby formula, as well as the amount that leaches from a BPA based plastic baby bottle(Biedermann et al., 2010). The hypothesis of dermal absorption of BPA after contact with thermal paper becomes more probable since Zalko et al. (2011) observed that viable skin efficiently absorbs BPA in short-term cultures and also an extensive metabolisation of BPA into BPA-monoglucuronide (BPA-G) and BPA-monosulfate into the skin(Zalko et al., 2011). This suspicion was also raised by Braun et al. (2011) who found significantly higher urinary BPA
Figure 7 – Thermal paper. Adapted from: https://www.sciencenews.org/article/receipts-large-%E2%80%94-and-largely-ignored-%E2%80%94-source-bpa
15
concentrations in cashiers, who had frequent contact with thermal paper, compared to women with other occupations(Braun et al., 2011).
4.2.2. Ambient
The atmosphere is a geochemical reservoir of various organic compounds, interacting with the oceans, land, and living organisms including human beings. One important environmental issue is the origin, transport and fate of organic pollutants in atmospheric aerosols and their health effects(Fu and Kawamura, 2010).
BPA is a pseudo-persistent chemical, ubiquitous in the environment because of continuous release which can occur during chemical manufacture, transport, and processing. Post-consumer releases are primarily via effluent discharge from municipal wastewater treatment plants, leaching from landfills, combustion of domestic waste, and the natural breakdown of plastics in the environment(US Environmental Protection Agency, 2011).
Characterized with a moderate hydrophobicity, BPA has a modest capacity for bioaccumulation. Based on these various characteristics, it is estimated that the largest environmental compartments of BPA are abiotic and are associated with water and suspended solids (~53%), soil (~25%), or sediments (~22%)(Flint et al., 2012).
BPA has a moderate affinity for soil organic matter, being improbable its mobility or bioavailability in soils(Fent et al., 2013). However, mobility can be affected by soil chemistry and texture. Reports of increased BPA sorption in the presence of iron, cadmium, and lead are consistent but results conflict with regards to the influence of soil pH(Li et al., 2007).
4.2.3. Wildlife
BPA is rapidly degraded in the environment through both microbial biodegradation and photodegradation and has a low potential to bioaccumulate in animals. Still, aquatic organisms that are in proximity of point source outputs of BPA are at the greatest risk of harmful effects of BPA(Crain et al., 2007, Oehlmann et al., 2009), including bioaccumulation and biomagnification in the food chain.
16
4.3.
Metabolism and toxicity of BPA
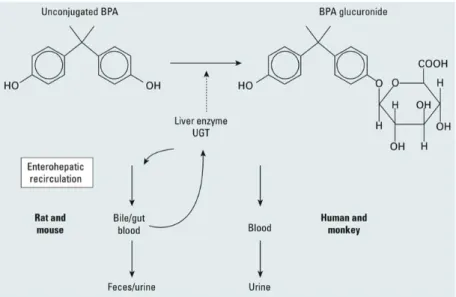
Rodents have been used in toxicokinetic studies of BPA. However, there is a significant difference in the distribution of BPA in humans and rodents (Figure 8).
In humans, metabolism of BPA is dominated by Phase II conjugation reactions of detoxification where the metabolite monoglucuronide conjugate (BPA-G) derived by glucuronidation reaction catalyzed by the uridine-5’-diphospho(UDP)-glucuronosyltransferase UGT2B15 (enzyme localized in the endoplasmic reticulum responsible for the conversion of small lipophilic compounds, such as BPA, to charged, water-soluble glucuronides)(Hanioka et al., 2008, Mazur et al., 2010). In a lower extent, BPA sulfation can also occur and is mediated probably by the sulfotransferase isoform SULT1A1, the isoform with the highest kcat/KM value for BPA conjugation(Nishiyama et
al., 2002). Unlike the aglycone form of BPA, BPA-G does not bind to the estrogen receptor
or show estrogen activities (Matthews et al., 2001). Hence, it is important to investigate the toxicokinetics of unchanged BPA, not metabolites, for prediction of the toxicity of BPA in humans. In rats BPA-G is excreted predominantly via the bile into feces and then undergoes enterohepatic recirculation while in humans and monkeys it is rapidly excreted into the urine
Figure 8 – Schematic diagram depicting the glucuronidation of BPA in the liver and the route of elimination of
unconjugated BPA from serum in rodents and primates after initial absorption from the gut and transport to the liver. Adapted from: Taylor, J. et al. (2011) “ Similarity of Bisphenol A Pharmacokinetics in Rhesus Monkeys and Mice:
17
with a faster clearance(Volkel et al., 2002) (less than 6h) than in rats (over 19h)(Mazur et
al., 2010).
There are others limitations for BPA metabolism studies such as difficulties in identifying individuals that are completely unexposed to BPA from the environment. Further, all of the current metabolic studies are based on kinetics following a single, usually high dose, while current evidence indicates that humans are experiencing multiple exposures each day.
A threshold model is being used by toxicologists when assessing the effects of possible EDs. This model relies on the principle that “the dose makes the poison,” implying that higher doses were expected to cause greater harm, defining NOEL (no observable effect level) by assessing different doses of a chemical.
The European Food Safety Authority (EFSA, 2007) established a value of 50 ng/g.day as the tolerable daily intake (TDI) and the US Environmental Protection Agency (EPA, 2009) established the same as the reference dose (RfD). These organizations conclude that current BPA levels present no risk to the general populations. However, non-linear relationships between dose and response have been observed for some EDs when it trigger observable effects at very high and low doses but almost no effect at moderate doses, for example(Lemos et al., 2009).
EDs can have detrimental effects during specific stages of development and no discernible effect during other life stages. Such chemicals may necessitate changes to toxicological study methods. It has been suggested by some toxicologists that the threshold model routinely used for risk assessment purposes by government agencies, including the EPA, should be rejected and replaced entirely(Matsumoto, 2002). Many of these studies examine only animals exposed during adulthood and thus lack information about progenies of animals treated during pregnancy. Conclusions reported by Lang et al. in 2008 suggest that follow-up longitudinal studies are crucial on infants, children, and adolescents, as well as pregnant women and fetuses. The fetus and infant are believed to be more susceptible to the estrogenic effects of BPA because of small body size and limited capacity to metabolize this substance (Lang et al., 2008).
18
4.4.
Legislation
In last years, the National Institute of Environmental Health Sciences (NIEHS) and the Food and Drug Administration (FDA) have been working together to address potential health concerns about BPA. In September 2008, the National Toxicological Program (NTP) completed a review of available research on BPA and concluded that there was “some concern for effects on the brain, behavior, and prostate gland in fetuses, infants, and children at current human exposures.” (NTP-CERHR, 2008). In 2009, FDA provided updates to the previous assessment and expressed its agreement with the NTP’s perspective(FDA, 2013).
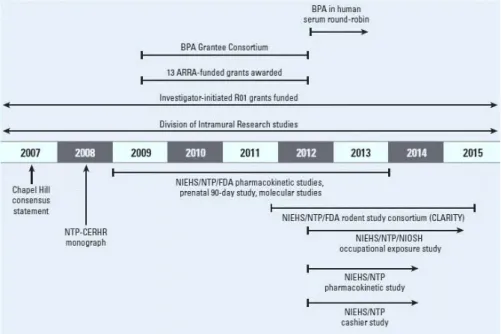
In order to improve risk assessment studies concerning this ubiquitous chemical, NIEHS launched in 2009 a multipronged research program designed to fill remaining gaps and resolve controversies about BPA toxicity studies (Figure 9)(Birnbaum et al., 2012).
In Europe, after concluding full risk assessment of BPA in 2006, EFSA set a TDI of 50 µg/kg bw.day for this substance. Between 2008 and 2011, new risk evaluations were made however the results did not justified the alteration of the TDI stablished in 2006. New scientific studies request that EFSA carries out a full re-evaluation of the human risks
Figure 9 – Elements of the NIEHS BPA research program. NIOSH, National Institute for Occupational Safety and Health. Adapted from: Birnbaum, L; Bucher, J; Collman, G; Zeldin, D; Johnson, A; Schug, T; Heindel, J. (2012)
“Consortium-Based Science: The NIEHS’s Multipronged, Collaborative Approach to Assessing the Health Effects of Bisphenol A.” Environmental Health Perspectives 120, 1640-44
19
associated with exposure to BPA through the diet, also taking into consideration the contribution of non-dietary sources to the global exposure to this chemical (EFSA, 2013). In January 2014, EFSA presented the draft opinion in which concluded that for all population groups diet is the major source of exposure to BPA and exposure is lower than previously estimated and also identified likely adverse effects on the liver and kidney and effects on the mammary gland as being linked to exposure to the chemical. It therefore recommended that the current TDI be lowered from its current level of 50 µg/kg bw.dayto 5 µg/kg bw.day. At the beginning of 2015, EFSA released a new report where it concluded that “BPA poses no risk to human health from foodstuffs because current levels of exposure are well below the temporary TDI of 4 µg/kg bw.day. This also applies to pregnant women and to the elderly. In addition, EFSA’s experts concluded that the health concern from the aggregated exposure to BPA from foodstuff, toys, dust, cosmetics and thermal paper is also below the temporary TDI of 4 ng/g bw.day. The uncertainty in the exposure estimate from toys, dust, cosmetics and thermal paper is considerable due to the very limited availability of data. The new TDI is dependent on the results of the NTP Program in 2016.
20
5. Tetrabromobisphenol A
5.1.
Properties of TBBPA
According to EFSA, “Brominated flame retardants (BFRs) are anthropogenic chemicals that are added to a wide variety of consumer/commercial products in order to improve their fire resistance. There are 5 major classes of BFRs: brominated bisphenols, diphenyl ethers, cyclododecanes, phenols and phthalic acid derivatives.” (EFSA, 2011). TBBPA falls within the category of the brominated bisphenols.
TBBPA, from the IUPAC name 2,2′,6,6′-Tetrabromo-4,4′-isopropylidenediphenol, is a BFR derived from the bromination of BPA, consisting of two hydroxyphenyl rings linked by a carbon bridge, with bromine substitution at the 3, 3′, 5 and 5′-positions (Figure 10). TBBPA is produced by the bromination of BPA with various solvents such as halocarbon alone, hydrobromic acid, aqueous alkyl monoethers, acetic acid or methanol (MeOH). With the molecular formula C15H12Br4O2 and a MW of 543.9 g/mol, it has two pka values (7.5 and 8.5) since it has two phenol groups (EFSA, 2012). TBBPA is characterized by a high lipid solubility (the protonated compound with a log Kow of 9.7), and low volatility (EFSA, 2011). At 25ºC, it has low solubility in water (4.16 mg/l), in MeOH (920 g/l) and in acetone (2400 g/l) (http://www.inchem.org/documents/ehc/ehc/ehc172.htm#SubSectionNumber:1.1.2, accessed on March 2015).
21
In 2004, TBBPA had an annual global production of more than 170 million tons, though only 20-30% of the total volume produced was used as an additive flame retardant on material subject to environmental leaching (ECB, 2006). Today, TBBPA is now the most heavily manufactured BFR in the world, with global production currently topping 200 million tons a year.It is produced in Israel, the United States, Jordan, Japan and China. The region with the highest demand for TBBPA is Asia, due to the high volume of printed wiring boards and electronics components manufactured in that region (Masten, 2002).
5.2.
Sources of exposure to TBBPA
5.2.1. Epoxy resins and polymers
TBBPA is mainly used as a reactive flame retardant in epoxy, vinyl esters and PC resins. The main application of TBBPA in epoxy resins is in printed circuit boards where the bromine content may be 20% by weight (Figure 11). Its application can be additive or reactive. When used as a reactive component, TBBPA is covalently bounded to the polymer by the phenolic hydroxy groups, being incorporated into it. However, the polymer can also contain a portion of unreacted TBBPA in excess not bounded to the polymer which can easily leach out from the polymer matrix into the environment and subsequently result in exposure of animals and humans (EFSA, 2011). On the other hand, when TBBPA is used as an additive component, the molecules are not part of the structure of the polymer itself and can be released into the environment more readily (Birnbaum, 2004). Printed circuit boards are used in communication and electronics equipment, electronic appliances, transportation devices, sports and recreation equipment, lighting fixtures and signs (Covaci et al., 2009).
Figure 11 – TBBPA application in expoxy resins in printed circuit boards. Adapted from: https://www.olimex.com/PCB/
22
TBBPA was measured in the air near a printed circuit boards production site at a level of 1.8 μg TBBPA per m3 (Zweidinger et al., 1979). Studies in Japan have found TBBPA in soil and sediment at concentration ranges of 0.5–140 μg/kg dw and 2–150 μg/kg dw, respectively (Watanabe et al., 1983). Data are very limited regarding the presence of TBBPA in biota, which may reflect its relatively short half-life in air, water, and sediment. Human TBBPA serum levels were measured by Jakobsson et al. (2002), who found TBBPA in 8 of 10 samples from computer technicians, at levels ranging from 1 to 3.4 pmol/g lipid (Jakobsson et al., 2002).
The second major application of TBBPA is when used also as a BFR in polymers such as acrylonitrile butadiene styrene (ABS) resins, high impact polystyrene (HIPS), phenolic resins, adhesives, paper, and textiles and others. Additive use accounts for approximately 10% of the total use of TBBPA (ECB, 2006).
More recently, TBBPA has been quantified in sewage sludge samples in Spain, along with other BFRs, being detected in concentration range of nd-472 ng/g (Gorga et al., 2013). Harrad and Abdallah (2011) determined TBBPA presence in dust from the four seats in five different cars, measuring usually higher levels in the front seats (Harrad and Abdallah, 2011). Ni and Zeng (2013) found considerable amounts of TBBPA in air conditioning filter dust, showing how inhalation might constitute a major pathway for human exposure to this BFR (Ni and Zeng, 2013).
TBBPA is also used in the manufacture of derivatives such as TBBPA bismethyl ether (TBBPA-bME), TBBPA bis(2,3-dibromopropyl)ether (TBBPA-bDiBPrE), TBBPA bisallyl ether (TBBPA-bAE), TBBPA bis(2-hydroxyethyl) ether (TBBPA-bOHEE), TBBPA brominated epoxy oligomer, and TBBPA carbonate oligomers. The main use of these derivatives is as flame retardants, usually in niche applications. (EFSA, 2011).
5.2.2. Ambient
Releases of TBBPA into the environment occur primarily through various waste streams generated during manufacture, processing and upon disposal of the substance and products containing the substance (i.e. dismantling, recycling, landfills, incineration,
23
accidental fires and sewage sludge applications for agricultural purposes), normally where it was introduced as an additive flame retardant (EU RAR, 2008).
Experimental microbial degradation studies have shown that in sediments under anaerobic reducing conditions TBBPA can be completely dehalogenated to BPA (Ronen and Abeliovich, 2000; Voordeckers et al., 2002; Gerecke et al., 2006). Ronen and Abeliovich (2000) also showed that BPA can be further degraded under aerobic conditions, indicating that an sequential anaerobic-aerobic process may possibly be used to completely degrade TBBPA present in contaminated soil.
5.3.
Metabolism and toxicity of TBBPA
The studies concerning the metabolism of TBBPA are limited. In an early study, Brady (1979) concluded that TBBPA is poorly absorbed from the gastrointestinal tract after administered a single oral dose (6.5–7.5 mg/kg) of 14C-labeled TBBPA to rats. The researcher found more than 95% of the parent TBBPA dose in the feces and 1.1% in the urine in 72h following administration (Brady, 1979).
Later in 2001, other researchers detected peak concentrations of 14C-TBBPA 1h following intraperitoneal administration (250 or 1,000 mg/kg) in all tissues, with higher concentrations in the fat, followed by the liver, sciatic nerve, muscles, and adrenals (Szymanska et al., 2001). The analysis of the feces showed that 10% of the radiolabeled material in the feces was tribromobisphenol A, suggesting rapid elimination in the bile and possible debromination by gastrointestinal flora (Szymanska et al., 2001).
One human study examined the half-life of TBBPA in exposed Swedish computer technicians, observing that this BFR has an estimated half-life in blood serum of 2.2 days. (Hagmar et al., 2000).
Concerning the effects of TBBPA in fish, a few studies have been made more recently. In 2012, Chan and Chan have observed the effects of TBBPA in zebrafish. Based on their results, it can be perceived the induction of thyroid α-receptor, thyroid stimulating hormone, and transthyretin genes in zebrafish embryo–larvae (Chan et al., 2012), since this chemical compete with the binding of T4 to plasma transport proteins (Meerts et al., 2000, Hamers
et al., 2006). Regarding its endocrine disruption in fish, TBBPA has shown low but multiple
hormonal activities in mosquitofish (Gambusia affinis) with significant up-regulation of vitellogenin and estrogen receptors mRNAs in the liver and testis, after exposure to 500 nM and 50 nM of TBBPA, respectively (Huang et al., 2013).