Achievement & Policy Analysis
Submitted in partial fulfillment of the requirements for
the degree of
Doctor of Philosophy
in
Engineering and Public Policy
Kristen R. Schell
B.S., Chemical Engineering, Carnegie Mellon University
M.S.E., Geography and Environmental Engineering, The Johns Hopkins
University
Carnegie Mellon University
Pittsburgh, PA
licensed under a Creative Commons Attribution 3.0 United States License. Please see
http://creativecommons.org/licenses/by/3.0/us/ for details.
The views and conclusions contained in this document are those of the author, and should not be interpreted as representing the official policies, either expressed or implied, of any sponsoring institution, the U.S. government, or any other entity.
Keywords: Renewable Energy Target (RET), generation expansion planning, probabilis-tic cost estimation, subsea power cables, complementarity modeling, equilibrium problem, electricity market, Renewable Energy Credit (REC) market.
To date, over 84% of countries worldwide have renewable energy targets (RET), requiring that a certain amount of electricity be produced from re-newable sources by a target date. Despite the worldwide prevalence of these policies, little research has been conducted on ex-ante RET policy analysis. In an effort to move toward evidence-based policymaking, this thesis develops computational models to assess the tradeoffs associated with alternatives for both RET achievement and RET policy formulation, including the option of creating renewable energy credit (REC) markets to facilitate meeting an RET goal. A mixed integer linear program (MILP), a probabilistic cost prediction model and a mixed complementarity problem (MCP) serve as the theoretical bases for the RET alternative and policy formulation analyses. From these models it was found, inter alia, that RET goals set too low run the risk of creating technological lock-in and could inhibit achievement of higher goals; probabilistic cost predictions give decision-makers essential risk information, when cost estimation is an integral part of alternatives assessment; and though REC markets may facilitate RET achievement, including REC markets in an RET policy formulation may not result in the lowest possible greenhouse gas emissions (GHG).
Atualmente mais de 84% dos países do mundo têm metas definidas para quotas de produção de energia de fontes renováveis (renewable energy target ou RET). Apesar da prevalência global destas políticas, pouca investigação tem sido conduzida na área da análise ex ante de políticas de RET. Com o objetivo de contribuir para uma formulação fundamentada destas políticas, esta tese propõe modelos computacionais para avaliar os compromissos associados a di-ferentes alternativas de cumprimento de metas e de formulação de políticas de RET, incluindo a opção de criar mercados de créditos de energias renováveis (renewable energy credit ou glsrec) para facilitar o cumprimento de metas de RET. Um modelo de programação linear inteira mista (mixed integer linear program ou MILP), um modelo probabilístico de previsão de custos, e um pro-blema de complementaridade misto (mixed complementarity problem ou MCP), constituem as bases teóricas para as análises de alternativas de cumprimento de metas e de formulação de políticas de RET. Com recurso a esses mode-los, mostra-se, inter alia, que metas de RET demasiado baixas podem criar dependências tecnológicas (technological lock-in) e podem também impedir o cumprimento de metas mais ambiciosas; que previsões probabilísticas de custos disponibilizam aos decisores informação de risco essencial, quando a estimação de custos é parte integrante da avaliação de alternativas; e que embora os mer-cados de REC facilitem o cumprimento de metas de RET, a sua inclusão numa política de RET poderá não conduzir ao nível mais baixo de emissões de gases com efeito de estufa (greenhouse gas emissions ou GHG).
I must first gratefully acknowledge the support of the Carnegie Mellon | Portugal Program, with financial support from the Fundação para a Ciência e a Tecnologia (Portuguese Foundation for Science and Technology) under Grant SFRH/BD/51563/2011. I would also like to thank the critical contributions of my dissertation committee: Seth Guikema of the University of Michigan, João Peças Lopes of the Faculty of Engineering of the University of Porto (FEUP), Gabriela Hug of ETH Zurich and Adam Warren of the U.S. Department of Energy’s National Renewable Energy Laboratory (NREL).
I would like to thank my advisors, João and Paul, for insightful research discussions, and giving me the freedom to pursue research that piqued my interest. To Senay, Hilal, Antonina and Giuseppe, thank you for making Porto feel like home. To Fayzur, Xenia and Bruno, our lunch discussions always broadened my horizons, even if they seldom enhanced my Portuguese. Thank you to everyone at EPP (GFG) for making the department feel like family. Thank you to my family for your continued love and support, and your ever enthusiastic trips to Portugal and the Azores. Finally, thank you to Ahmed, for always making me happy.
List of Acronyms xxiii
1 Introduction 1
1.1 Research questions . . . 2
1.2 Thesis overview . . . 2
2 Geographic Attribution of an Electricity System Renewable Energy Target 5 2.1 Introduction . . . 6
2.1.1 Renewable Energy Targets (RETs) . . . 6
2.1.2 RET Policy Analysis . . . 7
2.1.3 RET Technical Analysis . . . 8
2.1.4 RET Social Benefits . . . 9
2.1.5 Aim and Objectives . . . 9
2.1.6 Article Structure . . . 10
2.2 Methodological Framework . . . 10
2.2.1 Generation Expansion Planning . . . 10
2.2.2 Maximum Renewable Energy Production Per Island . . . 15
2.2.3 Case Study and Data . . . 15
2.2.4 Scenarios . . . 19
2.3.1 Scenario 1 - Isolated . . . 20 2.3.2 Scenario 2 - Regional . . . 22 2.3.3 Scenario 3 - Country . . . 24 2.3.4 Economic Implications . . . 26 2.3.5 Social Considerations . . . 29 2.3.6 Environmental Effects . . . 34 2.3.7 Discussion . . . 37 2.4 Conclusions . . . 38 2.5 Addendum . . . 40
2.5.1 Modeling Island/Isolated Power Systems . . . 40
2.5.2 Recent literature . . . 42
2.5.3 Methodology . . . 43
2.5.4 GEP Limitations . . . 44
2.5.5 Assumption Limitations and Future Work . . . 45
3 Probabilistic Cost Prediction 47 3.1 Introduction . . . 48
3.1.1 Cost Estimation Techniques . . . 49
3.1.2 Early Cost Prediction for Infrastructure Planning . . . 49
3.1.3 Paper Structure . . . 50
3.2 Data . . . 51
3.2.1 Project Attributes . . . 51
3.2.2 Data Transformation and Variable Selection . . . 52
3.3 Model Development and Selection . . . 53
3.4 Results - Model Predictive Accuracy . . . 59 3.4.1 Mean Prediction . . . 59 3.4.2 Probabilistic Prediction . . . 59 3.4.3 Model Limitations . . . 62 3.5 Case Study . . . 62 3.5.1 Problem Description . . . 63
3.5.2 Probabilistic Model Application . . . 64
3.5.3 Uncertainty Analysis and Risk Measures . . . 64
3.6 Conclusion . . . 68
3.7 Addendum . . . 69
3.7.1 Probabilistic Prediction Normality Assumption . . . 69
3.7.2 Future Work . . . 69
4 RET Policy Analysis 71 4.1 Introduction . . . 72
4.1.1 Complementarity Modeling for Policy Analysis . . . 73
4.1.2 Complementarity Modeling for Renewable Energy Policy Analysis . 73 4.1.3 Paper Aims and Structure . . . 75
4.2 Methods . . . 75
4.2.1 Generating Firm’s Problem . . . 77
4.2.2 Transmission System Operator’s (TSO) Problem . . . 79
4.2.3 Market Clearing . . . 79
4.2.4 Karush-Kuhn-Tucker Optimality Conditions . . . 80
4.2.5 Scenarios . . . 81
4.3.1 RET Achievement: Renewable Energy Investment vs. REC Trading 84
4.3.2 Greenhouse Gas Emissions . . . 86
4.3.3 Economic Efficiency of RET Policy . . . 88
4.4 Conclusions . . . 89
4.5 Addendum . . . 91
4.5.1 Future Work . . . 91
5 Conclusions 93 A Data, Generation Profiles and Costs per Island 97 A.1 Portugal Data . . . 97
A.2 Results Scenario 1 - Isolated Generation Capacity Expansion Investments . 98 A.3 Results Scenario 2 - Regional Generation Capacity Expansion Investments . 99 A.4 Results Scenario 3 - Country. Generation Capacity Expansion Investments . 100 A.5 Costs per Scenario, by Island . . . 101
A.6 Cost savings as compared to Scenario 1 - Isolated, by Island . . . 102
B Complementarity Model Specifications Per Scenario 105 B.1 Mathematical specification of Scenarios . . . 105
B.1.1 Regional-level RET without REC market: Scenarios 1b & 3b . 105 B.1.2 Firm-level RET with REC market: Scenarios 1c & 3c . . . 106
B.1.3 Firm-level RET without REC market: Scenarios 1d & 3d . . . 107
2.1 The Azores Islands [1]. An autonomous region of Portugal, the Azores Islands lie 1,400 km off the western coast of the Iberian peninsula. The archipelago’s geographical isolation has led to a reliance on fossil fuel im-ports (diesel and fuel oil) for electricity production. The electric utility is expanding investment in renewable energy, to meet the government’s 75% RET for 2018.[2] . . . 16 2.2 Scenario 2 - Regional: Annualized system cost by island and for the
entire archipelago (“System” axis), under a regional attribution of the RET. 23 2.3 Scenario 2 - Regional: renewable energy production on each
is-land, per RET. In a regional attribution of the RET, the smallest island, Corvo, never achieves higher than 22% renewable energy production. This is compared to 64% renewable production achieved in Scenario 1 - Isolated. 25 2.4 Scenario 3 - Country: renewable energy production on each island,
per RET. In a country RET, smaller islands have higher renewable energy production, at lower RETs, when compared to a regional RET. Because the demand pool is larger, relatively cheap renewable energy on the islands is attractive at lower RETs. . . 26
system cost, while the broader geographic RET attribution in Scenario 2 -Regional takes advantage of lowest cost renewables across the archipelago, resulting in a lower system cost across RETs. Scenario 3 - Country generally results in costs between Scenarios 1 and 2, though it is the least cost option for the RET range 54% - 60%, and above 72%. . . 27
2.6 Costs per scenario on São Miguel island. The least cost solution for the island of São Miguel is always Scenario 1 - Isolated. This is because, under any wider geographic attribution of an RET, the geothermal resources on São Miguel are heavily exploited. This makes the other two scenarios more costly for São Miguel locally. . . 28
2.7 Net savings per capita of Scenario 2 - Regional RET attribution. Com-pared to Scenario 1 - Isolated, a regional RET is always cheaper. The same is generally true of the comparion to Scenario 2 - Country, except after a 72% RET. This crossover point represents when investments in the regional RET maximize geothermal and biogas resources on the islands. . . 29
2.8 Generation Capacity Investments According to RET Attribution: This figure shows how the generation capacity investments change on the smallest island (Corvo) and largest island (São Miguel), when the Renewable Energy Target geographic attainment boundary is enlarged. The broader the geographic RET region is, the less investment is made on smaller islands. . 30
[%] per island on system cost. Establishing a quota for renewable energy production per island, while also meeting a regional RET, forces distribution of renewable energy investments across the islands. At high RETs, such as the 75% target of the Azores government, the effect of a quota on overall cost is small. . . 31 2.10 Scenario 2 - Regional: Effect of 75% diesel and fuel oil price
in-crease on system cost. If the cost of diesel and fuel oil were to rise by 75% each, the resulting increase in system cost would make a 50% archipelago-wide RET cost-effective. . . 32 2.11 Scenario 3 - Country: Effect of renewable energy production quota
[%] per island on system cost. Requiring a per island production quota of renewable energy has a negligible effect on cost, when meeting a country RET. The investment costs needed in mainland Portugal dominate the costs incurred on the Azores Islands. . . 33 2.12 System operating emissions per scenario. This graph shows the carbon
dioxide-equivalent (CO2eq) emissions associated with the annual operation
of the electricity system on the Azores archipelago, under each scenario. As renewable energy investment increases with higher RETs, emissions de-crease. The greatest emissions reductions are achieved at the the highest RET under the regional attribution. . . 35 2.13 Cost-effectiveness of emissions reductions, in dollars per ton CO2eq
reduced. The cost-effectiveness metric displayed here is a typical metric displayed to policy makers. It illustrates the cost of carbon abatement per scenario, per RET. . . 37
parison of model output (Ln(ConCost)), and the exponentially transformed model output, which gives cost in familiar units of $2012 USD. . . 61 3.2 Verificiation of normal probabilistic prediction assumption. . . 69 4.1 Schematic of the market equilibrium problem, adapted from [3]. . . 76 A.1 Scenario 1 - Isolated Generation Capacity Expansions by Island.
From left to right and down, the islands are listed by increasing electricity demand. This figure shows how renewable energy investment changes by RET. Lumpiness is at play in all cases. . . 99 A.2 Scenario 2 - Regional Generation Capacity Expansions by Island.
From left to right and down, the islands are listed by increasing electricity demand. This figure shows how renewable energy investment changes by RET. The strategy of RET setting becomes particularly important when the production of renewable energy from the entire archipelago can count to-wards meeting the regional RET. Natural resource characteristics, lumpiness of turbine investment and differing costs can cause the least-cost investment profile to change dramatically from one RET percentage point to the next. Long-term goals should be considered carefully before the RET is set. . . . 100 A.3 Scenario 3 - Country: Generation Capacity Expansions by Island and
mainland Portugal. From left to right and down, the regions are listed by increasing electricity demand. This figure shows how renewable energy investment changes by RET. When considering the broadest attribution of an RET, investment in local renewable energy still occurs. . . 101 A.4 Costs per island, per scenario. . . . 102
are three islands (Flores, São Jorge and Terceira) where it may be cheaper to be in an isolated scneario, particulary at low RETs. In the case of São Miguel, with large geothermal reserves, it always cheaper to have an isolated RET attribution. The cost to São Miguel of a regional or country RET is more than compensated by the savings incurred on the other islands, as shown in Figure 2.5. . . 103
2.1 List of abbreviations used throughout this article. . . . 7 2.2 Model parameters . . . 11 2.3 Average annual capacity factors [2] . . . 14 2.4 Existing Generation Capacity in 2008. Electricity generation on the
islands is dominated by diesel and fuel oil, which together account for over 81% of total generation capacity [4]. . . 16 2.5 Natural resource limitations on generation capacity expansion. Based
on the Green Islands study of the natural resource reserves of renewable en-ergy on the islands, the table shows that possibly binding limits exist for wind, hydropower, geothermal and biogas expansion [2]. . . 17 2.6 Capacity Expansion Integral. Expansions in generation capacity are
lim-ited by the size of the turbine [4]. . . 17 2.7 Demand and peak load in 2018. The annual demand per island, as well
as annual peak load, using forecasted growth values from the Green Islands study [2]. . . 18 2.8 Annual load duration curve approximation. The percentages in the
table below divide the annual load duration curve into the amount of base, middle and peak load that must be met in 2018 [5]. . . 18
International Renewable Energy Agency (IRENA) [6], and the International Energy Agency (IEA) [7]. Costs are annualized based on an 8% discount
rate and a 20 year lifetime of generation investments. . . 19
2.10 Maximum renewable energy production by island, with associated an-nualized cost. . . 21
2.11 Average percent [%] of total capacity expansions in an RET range, by generation technology. The capacity expansions included here are the expansions that occur on the islands and do not include capacity expansions in mainland Portugal. In Scenario 1, only the first two ranges can be re-ported, as not all islands can meet the higher RETs. Similarly, the final RET range for Scenarios 2 and 3 go up to the maximum RET that is achieved in that scenario, 85% and 95%, respectively. . . 24
2.12 Life-cycle emissions factors by generation technology [8]. . . 35
3.1 Submarine Power Cable Project Database . . . 53
3.2 Prediction Error by Model . . . 59
3.3 Reduction of EENS (MWh) and Risk Cost [M$] Due to Replacing the Cable [9] . . . 63
3.4 Vancouver Island Cable Cost Prediction Data . . . 64
3.5 Probabilistic Cost Prediction of Vancouver Island Cable . . . 65
3.6 Deterministic and Probabilistic Analyses . . . 65
4.1 Model sets, parameters and variables . . . 76
4.2 Description of model scenarios. . . 82
4.3 Data. The cost data is from ERSE [5], the International Renewable Energy Agency (IRENA) [6], and the International Energy Agency (IEA) [7]. . . . 83
4.5 Data. Renewable energy target (RET). . . 84 4.6 Total renewable energy investment [MW] per scenario, across time
pe-riods. . . 85 4.7 Total renewable energy credits traded [MW] per scenario, across time
periods. . . 85 4.8 REC price [$/MWh] per scenario, per time period. . . 86 4.9 Total greenhouse gas emissions (GHG) [tons] per scenario, across time
periods. . . 86 4.10 Total electricity production [MW] per scenario, across time periods. . . 87 4.11 Total profits [$] per firm, per scenario, across time periods. . . 87 4.12 Total social surplus [$] per scenario, across time periods. . . 89 A.1 Mainland Portugal data. Data used in Scenario 3 includes the mainland
of Portugal, where generation capacity and costs differ from the Azores Islands. Generation capacity data was gathered from the electricity system operator, REN (Rede Elétrica Nacional) [10]. Maximum capacity expansion is assumed to be unlimited in almost any technology except hydropower and biomass, which we assume can only expand to three times their current capacity. Capacity factor data on mainland Portugal is from [11] for wind, [12] for hydropower and wave in mainland Portugal, and from [13] for all other technologies. Cost data is from the Portuguese electric regulatory agency, [5], and the International Energy Agency (IEA) [7]. . . 97 A.2 Demand and peak load in 2018. The annual demand for mainland
Portugal, as well as annual peak load, using forecasted growth values from [14][10]. . . 97
table below divide the annual load duration curve into the amount of base, middle and peak load that must be met by the mainland Portuguese elec-tricity system in 2018 [5]. . . 98 B.1 Nodal Electricity Prices. Per Scenario, firm, time period and load type. . 108
AC Alternating Current. 36, 37 AE Absolute Error. 38, 42 AF Activity Factor. 25
APE Absolute Percent Error. 38
CAN Canadian Dollar. 45, 46
CCGT Combined Cycle Gas Turbine. 55 CDF Cumulative Distribution Function. 43 CRPS Continuous Ranked Probability Score. 43 Cu Copper. 36
CVaR Conditional Value-at-Risk. 2, 48, 49
DC Direct Current. 36
EENS Expected Energy Not Served. xviii, 45, 46 EF Emissions Factor. 25
ETS Emissions Trading Scheme. 7, 26, 55 EU European Union. 5–7, 26, 30, 34, 55
GAM Generalized Additive Model. 38
GEP Generation Expansion Planning. 7, 9, 13, 17, 19, 58 GHG Greenhouse Gas. xviii, 2, 3, 55, 63, 65–67, 72 GLM Generalized Linear Model. 38
GW Gigawatts. 34
IEA International Energy Agency. xvii, xviii, 16, 62 IPCC Intergovernmental Panel on Climate Change. 5–7
IRENA International Renewable Energy Agency. xvii, xviii, 16, 62
KKT Karush-Kuhn-Tucker. 57 km kilometers. 33, 34, 39, 46 kV kilovolts. 36 kW kilowatt. 10, 14–16 kWh kilowatt-hour. 10, 15, 16, 18, 21, 24, 25 LOOCV Leave-One-Out-Cross-Validation. 38, 42 LR Learning Rate. 40
MAC Marginal Abatement Cost curve. 7 MAE Mean Absolute Error. 42, 43
MAPE Mean Absolute Percent Error. 42, 43
MARS Multivariate Adaptive Regression Splines. x, 38, 40–43, 45, 46, 48, 49 MCP Mixed Complementarity Problem. iii, 57
MILP Mixed Integer Linear Program. iii MW Megawatt. xviii, 34, 36, 64, 65 MWh Megawatt-hour. xviii, 46
NREL U.S. Department of Energy’s National Renewable Energy Laboratory. 7, 25
PTDF Power Transfer Distribution Factor matrix. 59
REC Renewable Energy Credit. xi, 1–3, 53, 54, 56–62, 64–66, 68, 72 ReEDS Renewable Energy Deployment System. 7
RET Renewable Energy Target. iii, ix, xi, xviii, 1–3, 5–10, 12–14, 16–27, 30, 53–56, 58–68, 70–72
RPS Renewable Portfolio Standard. 1, 53
TSO Transmission System Operator. xi, 59–61
USD United States Dollar. 24, 37, 45, 46
Introduction
This thesis develops computational models to aid decision making in renewable energy policy formation. The models developed in this work specifically focus on informing a policy aimed toward initiating the transition to a low-carbon electricity grid, known as a Renewable Energy Target (RET), or Renewable Portfolio Standard (RPS). An RET mandates that a certain percentage of electricity be produced from renewable generation sources. Generally, the models in this thesis address the three main alternatives to RET achievement: 1) direct investment in renewable energy power generation, 2) investment in grid interconnection to areas with greater renewable energy supply, and 3) Renewable Energy Credit (REC) markets, aimed to facilitate RET achievement when an electricity firm/region cannot directly invest in its own renewable energy.
It is recognized that the policy, legislation and formulation process is fundamentally political, with special interest groups often able to influence policy language. This thesis represents an attempt to ground the political discussion in technical facts, using structured, methodological paradigms. The models developed aim to gain insights on the effects of different RET policy formulations on society. Our analysis seeks to identify who is rendered better-off under a certain policy, and who, if anyone, is left worse-off.
1.1
Research questions
We put forth three research questions to address the issue of RET policy analysis:
1. Geographic Attribution of an RET. What are the economic, social and envi-ronmental tradeoffs associated with different geographic attributions of an RET? Does direct investment in renewable energy shift significantly from one location to another? Are carbon emissions more efficiently reduced in a certain geographic attri-bution? Does the cost of a policy fall onto one region more than another? (Chapter 2)
2. Probabilistic Cost Prediction of Submarine Power Cable Projects. It is hy-pothesized that offshore wind power could significantly aide countries in achieving renewable energy targets. Given the global projected growth in the submarine power cable industry, what statistical learning model best predicts the probability distribution of the cost of a subsea power cable project? (Chapter 3)
3. RET Achievement through REC Trading or Renewable Energy Investment. Under what renewable energy target policy formulation does an REC market facilitate RET achievement? Does the timing of target compliance significantly affect social welfare? (Chapter 4)
1.2
Thesis overview
In Chapter 2, the geographic attribution of an RET is analyzed. The economic, environ-mental and social impacts are assessed to generate insights on the associated tradeoffs. The Azores Islands off the coast of Portugal are used as a case study for the model. We find that a regional geographic attribution of the RET achieves the lowest cost, and yields the
greatest reduction in greenhouse gas (GHG) emissions, though renewable energy investment is less distributed across islands.
In Chapter 3, we develop a probabilistic cost prediction model for submarine power cables to aid decision-makers in government, academia and industry to more accurately as-sess alternatives for RET achievement. The model we developed is globally applicable, from offshore wind power to grid interconnection applications. The best performing statistical learning model has slightly more predictive power than a simpler, linear econometric model. The specific decision context will determine whether the additional precision of the statis-tical learning model is worth the extra data-gathering effort. A case study illustrates that incorporating the uncertainty associated with the cost prediction to calculate risk metrics - value-at-risk (VaR) and conditional-value-at-risk (CVaR) - provides useful information to the decision-maker about cost variability and extremes.
In Chapter 4, we adapt a complementarity model of the electricity market and power system, and include an REC market. Eight different RET policy scenarios are defined, and analyzed based on greatest renewable energy investment, lowest GHG emissions reductions and largest increase in social surplus. It was found that, in a market where players have the option to invest in renewable energy expansion and unlimited transmission capacity, an RET policy design of multi-stage targets at the firm-level, without an REC market, is optimal. This design not only achieves the highest social surplus, but also the highest renewable investment and the greatest reduction in greenhouse gas emissions.
Our three investigations provide considerable insights into RET policy analysis. Not only do we analyze RET policy formulation ex ante, but we also conduct robust assessments of alternative methods of achieving these targets. In the process, we both enhance existing models (Research Question 1 and Research Question 3) and develop new ones (Research Question 2).
Geographic Attribution of an
Electricity System Renewable Energy
Target:
Local Economic, Social and
Environmental Tradeoffs
The 2014 Intergovernmental Panel on Climate Change (IPCC) report asserts that invest-ment in low-carbon electricity production will need to rise by several hundred billion dollars annually, before 2030, in order to stabilize greenhouse gas concentrations in the atmosphere by 2100. In recognition of this urgent need to mitigate climate change, many governments have already established policies to spur renewable energy investment in the electricity sec-tor. One such policy measure is a renewable energy target (RET), which sets a target percentage of electricity production to be generated from renewable sources by a specified
date. Variations on this policy have been implemented around the world, from the EU 20-20-20 to diverse renewable portfolio standards in U.S. states and municipalities. This work analyzes economic, environmental and social aspects of a geographic attribution (i.e. Isolated, Regional or Country) of an RET to gain insights on the associated tradeoffs. In the case study of the Azores Islands, Portugal, the regional geographic attribution of an RET captures the best of all three tradeoffs.
2.1
Introduction
In its most recent report (2014), the IPCC has, for the first time, specifically stated that investment in low-carbon electricity production is a “key measure” in climate change mit-igation [16]. The IPCC stresses that investment in low-carbon electricity supply will need to support an increase from the current share of 30% production globally, to at least 80% by 2050. In order to achieve this goal, hundreds of billions of dollars annually, by 2030, will need to be invested in low-carbon electricity [16].
2.1.1
Renewable Energy Targets (RETs)
Climate change is an urgent problem, and political pressure to address it has already led to the development of numerous policy instruments to encourage investment in renewable energy. Many governments have issued renewable energy targets (RETs), which mandate that a certain percent of electricity production is generated from renewable sources by a specified date. The European Union (EU) famously enacted its EU 20-20-20 policy in 2007, which, among other targets, requires 20% of its total energy supply to come from renewable resources by the year 2020 [17]. In 2001, the Australian government implemented the world’s first nationally mandated RET of 20% by 2020 [18].
In addition to the 27 EU member states and Australia, many major global players -including China and South Africa - have instituted RETs as policy tools to encourage investment in renewable energy. Though the United States (U.S.) does not have a federal energy policy, over half the states have implemented RET regulation, encouraging renewable energy development in the electricity sector. Two of the highest targets are in the states of Hawaii and California, with a 40% RET by 2030 [19], and a 33% RET by 2020 [20], respectively. State-level renewable targets are so common [21] that the U.S. Department of Energy has established a database to track legislative targets and developments [22].
Table 2.1: List of abbreviations used throughout this article.
Abbreviation Description
ERSE Entidade Reguladora dos Serviços Energéticos
(Portuguese Energy Regulator)
EU European Union
ETS Emissions Trading Scheme GEP Generation Expansion Planning model IPCC Intergovernmental Panel on Climate Change MAC Marginal Abatement Cost curve ReEDS Renewable Energy Deployment System model RET Renewable Energy Target U.S. United States of America
2.1.2
RET Policy Analysis
Due to the worldwide prevalence of RET policies, work in several fields, including public policy [18][23][24], economics [25][26], and operations research [27], has been conducted to address the varying impacts of RET policies. To the best of the authors’ knowledge, little analysis exists on how best to set an RET. Whether RETs are better set at the local, regional, or country level remains an unexamined question.
In practice, setting a renewable energy target is fundamentally political. Once an RET is agreed upon by the government, an analysis of the policy is usually undertaken, such as through a Regulatory Impact Assessment in the U.S., to ensure the policy will not recklessly effect existing market players [28]. This type of evaluation typically involves
Marginal Abatement Cost (MAC) curves, which are usually developed for a specific region and timeframe, to assess available technology options and associated costs. A recent study from the World Bank [29], however, asserts that MAC curves have a tendency to be misinterpreted, specifically when designing an RET policy. For an RET, it is usually most effective to implement the highest cost technologies first. The study also finds that RET targets set too low (below 25%) may be adversely effecting future investment in renewable energy, and hindering achievement of higher goals [29].
2.1.3
RET Technical Analysis
Despite the prevalence of RET policy and policy analysis, little has been done on the technical side to incorporate RETs into electricity system modeling for long term planning. Bird, et al. [30] have used the U.S. National Renewable Energy Laboratory’s (NREL) model, ReEDS [31], to examine the least-cost generation and transmission expansion plans under a renewable energy target policy, a carbon cap-and-trade policy, and a combination of the two. The highest RET considered, however, is 25%. Wave generation capacity is not considered as a technology option in their model.
Furthermore, to the best of the author’s knowledge, no studies have looked at the effects of the geographic attribution of an RET. The term geographic attribution defines the area (isolated, regional, or country) that must meet the target. Many RET policies are defined as a country goal, such as in China. Liu, et al. [32] take the country RET for China and develop a model to decompose the national RET to the regional level. However, they do not determine whether the RET is best set at the isolated, regional, or country level.
Hiremath, et al. [33] stress that socio-economic and environmental impacts should be evaluated by the model at the local level. Foley, et al. [34] review numerous electricity system models and emphasize the need for electricity system models that can incorporate key policy changes, including targets to increase the share of renewable energy production.
Zhou et al. [35] have developed a complex, bilevel optimization model of the generation side of the electricity system that considers incentive policies for electricity producers - such as production tax credits, an investment tax credit, or a carbon tax - and compares these policies to a mandatory RET. They conclude that incentive policies can be as efficient as an RET, though their analysis only considers a low RET range, from 10% - 25%. They concede that incentive policies may be much less effective at higher RETs. The question of the optimal geographic attribution of an RET is not addressed.
2.1.4
RET Social Benefits
Politically, renewable energy targets are designed to increase investment in renewable energy generation and thereby decrease greenhouse gas emissions. RET policies can also have added societal benefits, including air emissions reductions and the resulting health benefits [36], energy security, fuel diversity, and job creation [37]. This work examines the social and environmental benefits of an RET in terms of emissions reductions, as well as the economic cost of implementation.
2.1.5
Aim and Objectives
The aim of this research is to analyze the local economic, social and environmental im-pacts of the geographic attribution of a renewable energy target. The authors seek to uncover the tradeoffs associated with a local, regional and country RET policy. Through analyzing these tradeoffs, we hope to inform both policymakers and stakeholders about the potential effects that the geographic attribution of an RET can have on optimal generation investment, equitable renewable investment distribution across localities and local emissions reductions. Our ultimate objective is for the conclusions of this work to help inform RET policy formation.
2.1.6
Article Structure
In Section 2.2 we describe the modeling framework with which the geographic attribution of an RET is analyzed. Section 2.3 presents the results of this analysis, the local effects of an RET attribution and the model limitations. Section 2.4 reports the main findings of this study.
2.2
Methodological Framework
In this section, we describe the methodological approaches we employ in analyzing the effects of different geographic attributions of an RET. We also present the parameters of the case study analyzed - the Azores Islands, Portugal.
2.2.1
Generation Expansion Planning
We adapt an electricity system planning technique commonly used in the literature [30] [38] [39] [40] [41] [42], known as Generation Expansion Planning (GEP)1. GEP refers to
electricity system power generation capacity [43]. Mixed integer optimization methods are used to find the optimal way to expand the generating capacity in an electricity system in order to meet predicted demand growth, given a set of expansion alternatives. We include the restriction that the capacity expansions must also enable sufficient renewable energy production to meet a given RET.
Decision Variables and Parameterization
The generation expansion planning model solves for three major decision variables: 1) how many capacity additions should be made to what technology, on what island, CEgi; 2) the
1For a more in-depth discussion on the applicability of GEP to Island/Isolated electricity systems, see
total capacity (existing plus expansions) of each technology, on each island, Cgi; 3) and
the operating level of each technology, on each island, Wgil.
To describe the electricity generation system on the islands, we include the existing ca-pacity of electricity generation as of the start of 2008 [4]. Using demand growth predictions and natural resource limitations from the Green Islands Azores Project [44] [2]2, the GEP
model solves for the least-cost expansions that will meet the renewable energy target in 2018. Table 4.1 completely details the model parameters, with data presented in Section 4.3.
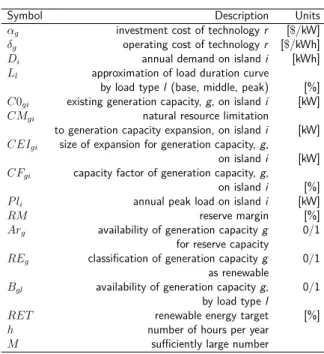
Table 2.2: Model parameters
Symbol Description Units
αg investment cost of technology r [$/kW]
δg operating cost of technology r [$/kWh]
Di annual demand on island i [kWh]
Ll approximation of load duration curve
by load type l (base, middle, peak) [%]
C0gi existing generation capacity, g, on island i [kW]
CMgi natural resource limitation
to generation capacity expansion, on island i [kW]
CEIgi size of expansion for generation capacity, g,
on island i [kW]
CFgi capacity factor of generation capacity, g,
on island i [%]
P li annual peak load on island i [kW]
RM reserve margin [%] Arg availability of generation capacity g 0/1
for reserve capacity
REg classification of generation capacity g 0/1
as renewable
Bgl availability of generation capacity g, 0/1
by load type l
RET renewable energy target [%] h number of hours per year
M sufficiently large number
2The Green Islands Azores Project Report assessed the future electricity demand on the islands based on
detailed studies predicting sector-level economy expansion (i.e. agriculture, industry, residential, etc.) on each island. The results of the analysis conducted for renewable energy expansion potential on the islands is informed by a detailed resource analysis, including land availability for both the siting of new generation and the potential expansion of the electricity grid. Thus, infeasible siting locations are not considered in our analysis.
Objective Function
The objective of the model is to minimize system cost, which we define as the annualized investment cost of new capacity, plus the operating cost of both new and existing capacity. This is mathematically defined as Equation (2.1).
minimizeX g X i (αgCEgiCEIgi+ X l δgWgil) (2.1) Capacity Constraints
Any expansion that occurs must take into consideration the existing capacity on the island, C0gi, (2.2), and the natural resource limitations, CMgi, on the island (2.3).
Cgi= C0gi+ CEgiCEIgi ∀g ∈ G, i ∈ I (2.2)
CEgiCEIgi≤ CMgi ∀g ∈ G, i ∈ I (2.3)
Additionally, there must be enough generation capacity in the system that can act as reserve capacity (2.4). As is common practice, we require a reserve margin of 20% [38][45][46].
X
g
ArgCgiCFgi ≥ P lg(1 + RM ) ∀i ∈ I (2.4)
This reserve margin is a conservative estimate of what might be needed in a system with a high penetration of intermittent renewable energy, such as wind and solar power [47].
Operating Constraints
The following contraints ensure that the system meets operational standards, such as re-quiring that supply must always meet demand (2.5).
X
g
BglWgil = DiLl ∀l ∈ L, i ∈ I (2.5)
Equation (2.6) ensures that a generation technology is assigned only to a load type to which it can reasonably respond. Illustratively, this constraint protects against solar power being assigned to meet night-time base load. In our analysis we consider that geothermal, diesel, fuel oil and biogas can meet all load types, while the other generation capacities are only available to meet middle load.
Wgil≤ BglM ∀g ∈ G, l ∈ L, i ∈ I (2.6)
Further, the operating level of each technology cannot exceed its expected availability, given by its annual average capacity factor (2.7). The capacity factors used in this study were taken from the results of the Green Islands study [2]. The annual average capacity factor ranges are presented in Table 2.3.
X
l
Wgil≤ CgiCFgih ∀g ∈ G, i ∈ I (2.7)
The final operational constraint provides that the renewable energy generation capacity in the system is sufficient to meet the renewable energy production target. Renewable gen-eration capacity investments considered for the islands are wind, offshore wind, hydropower, geothermal, solar photovoltaic, wave and biogas. The only renewable technology considered
3Where islands have differing average annual capacity factors for a certain generation capacity, a range
among the island values is presented. Where the capacity factor is the same among islands, that single annual average value is presented.
Table 2.3: Average annual capacity factors [2] Capacity factor, CFg3 [%] Wind 25.0 - 32.9 Offshore Wind 27.0 - 34.9 Hydropower 40.0 Geothermal 72.1 Solar 11.6 Wave 30.0 Diesel 79.1 Fuel Oil 79.1 Biogas 79.1
that has not yet been implemented somewhere on the Azores is offshore wind [4].
X
g
X
l
REgWgil ≥ (RET )Di ∀i ∈ I (2.8)
Total capacity and operating level decision variables are subject to non-negativity con-straints, as presented in (2.9) and (2.10).
Cgi≥ 0 ∀g ∈ G, i ∈ I (2.9)
Wgil ≥ 0 ∀g ∈ G, i ∈ I, l ∈ L (2.10)
The number of capacity expansions permitted are restricted to integer values.
CEgiin integer (2.11)
2.2.2
Maximum Renewable Energy Production Per Island
The generation expansion planning model presented in the previous section (2.2.1), solves for the least-cost expansion plans to meet an RET. We utilize an optimization methodology known as the e-constraint method [48], to also solve for the maximum renewable energy production possible on each island. To do so, we simply change the objective function of the original GEP model to maximize the production of renewable energy, z∗, on the island,
as in (2.12). z∗ = maximizeX g X l REgWgl (2.12)
This value, z∗, is used again in the original GEP model, and replaces the right hand side
of Equation 2.8, as shown below in (2.13).
X
g
X
l
REgWgil≥ z∗ ∀i ∈ I (2.13)
The solution of this revised problem gives the least-cost expansion plan, at the maximum renewable energy production. The results of this analysis are presented in Table 2.10, Section 2.3.1.
2.2.3
Case Study and Data
We apply our analysis to a geographically diverse case study: the Azores Islands, Portugal. An archipelago of nine islands off the western coast of the Iberian peninsula (see Figure 2.1), their dependence on fossil fuels has driven the Azorean government to establish an ambitious RET of 75% by 2018 [2]. How best to meet this target will depend on its geographic attribution.
Figure 2.1: The Azores Islands [1]. An autonomous region of Portugal, the Azores Islands lie 1,400 km off the western coast of the Iberian peninsula. The archipelago’s geographical isolation has led to a reliance on fossil fuel imports (diesel and fuel oil) for electricity production. The electric utility is expanding investment in renewable energy, to meet the government’s 75% RET for 2018.[2]
Table 2.4: Existing Generation Capacity in 2008. Electricity generation on the islands is dominated by diesel and fuel oil, which together account for over 81% of total generation capacity [4].
2008 Generation Capacity, C0gi[kW]
Corvo Flores Graciosa Santa Maria São Jorge Pico Faial Terceira São Miguel
Wind - 600 800 900 1,150 1,800 1,800 4,500 -Offshore Wind - - - -Hydropower - 1,484 - - - - 320 1,432 5,030 Geothermal - - - 27,800 Solar - - - -Wave - - - -Diesel 536 2,327 4,230 5,680 7,090 - - - -Fuel Oil - - - 13,388 17,010 61,116 98,064 Biogas - - -
-others. Table 2.4 shows that all islands currently rely heavily on fossil fuels in the form of diesel and fuel oil. Some have limited renewable resource production from sources such as wind, hydropower and geothermal energy.
Existing natural resource limits preclude unlimited renewable resource exploitation on the islands. Table 2.5 shows the best data available concerning the Azores Islands [2]. A major limiting factor on the islands is the dearth of exploitable geothermal resources on seven out of the nine islands. Available hydropower expansion is almost as scarce. Fuel for biogas production, using cow manure as a feedstock, is estimated based on the number of cows on each island [49]. Agriculture and dairy production is a large part of the Azorean economy, with cows outnumbering the human population on some of the smallest
Table 2.5: Natural resource limitations on generation capacity expansion. Based on the Green Islands study of the natural resource reserves of renewable energy on the islands, the table shows that possibly binding limits exist for wind, hydropower, geothermal and biogas expansion [2].
Maximum Capacity Expansion, CMgi [kW]
Corvo Flores Graciosa Santa Maria São Jorge Pico Faial Terceira São Miguel
Wind 140 160 280 600 1,700 800 800 9,100 18,300 Offshore Wind 50,000 50,000 50,000 50,000 50,000 50,000 50,000 50,000 50,000 Hydropower - 527 - - 1,670 1,230 25 293 6,754 Geothermal - - - 12,000 47,650 Solar 50,000 50,000 50,000 50,000 50,000 50,000 50,000 50,000 50,000 Wave 50,000 50,000 50,000 50,000 50,000 50,000 50,000 50,000 50,000 Diesel 50,000 50,000 50,000 50,000 50,000 50,000 50,000 50,000 50,000 Fuel Oil 50,000 50,000 50,000 50,000 50,000 50,000 50,000 50,000 50,000 Biogas 48 396 471 528 894 1,419 1,501 5,312 12,805
Table 2.6: Capacity Expansion Integral. Expansions in generation capacity are limited by the size of the turbine [4].
Turbine size of generation capacity, CEIgi[kW]
Corvo Flores Graciosa Santa Maria São Jorge Pico Faial Terceira São Miguel
Wind 300 300 200 300 164 300 300 900 3004 Offshore Wind 300 300 300 300 300 300 300 300 300 Hydropower 500 370 500 - 500 500 320 475 700 Geothermal - - - 3,000 5,000 Solar 290 290 290 290 290 290 290 290 290 Wave 400 400 400 400 400 400 400 400 400 Diesel 135 500 700 945 1,000 2,200 2,000 6,000 12,000 Fuel Oil 135 500 700 500 1,000 2,200 2,000 6,000 12,000 Biogas 48 390 470 500 890 700 1,500 5,300 12,000
islands [50]. In technologies where there is almost unlimited potential for expansion, an unattainable expansion value of 50,000 kilowatts [kW] is given.
Capacity expansions are additionally limited by the size of the generator. As shown in Table 2.6, the typical size of a wind turbine on the Azores is 300 kW, while the size of a diesel generator ranges from 135 - 12,000 kW [4]. The difference in sizing can make different technologies attractive at different RETs. A small generator is more advantageous to meet an incremental increase in an RET, whereas larger investments will be attractive for higher RETs. The diversity of the alternatives available, however, makes this decision nontrivial.
4The data presented here are from the Green Islands Report [2], published in 2010. Since then, larger
Capacity expansions will be necessary in order to meet future growth in demand on the islands. Demand projections for the Azores target year of 2018 are derived from economic growth projections completed by the Green Islands study [2]. The forecasted percentage increase in demand for each island are applied to the realized demand on the islands in 2008 [4].
Table 2.7: Demand and peak load in 2018. The annual demand per island, as well as annual peak load, using forecasted growth values from the Green Islands study [2].
Annual Demand and Peak Load
2018 Demand, Di 2018 Peak Load, P li
[kWh] [kW] Corvo 1,463,212 299 Flores 15,687,379 2,721 Graciosa 18,195,214 3,108 Santa Maria 27,188,099 4,641 São Jorge 37,968,238 6,330 Pico 63,031,316 10,847 Faial 69,715,622 11,719 Terceira 295,291,599 51,476 São Miguel 606,926,090 102,092
Total demand is apportioned into an approximated annual load duration curve using percentages from the energy regulatory utility of Portugal, Entidade Reguladora dos Serviços Energéticos (ERSE), in Table A.3 [5].
Table 2.8: Annual load duration curve approximation. The percentages in the table below divide the annual load duration curve into the amount of base, middle and peak load that must be met in 2018 [5].
Load Duration Curve Approximation
Ll [%]
Base 41.67
Middle 41.67
Peak 16.66
ERSE has also published operating costs for renewable energy production on the Azores Islands (Table 2.9). Many renewables, including wind, hydropower, geothermal, solar and wave energy, are cheaper to operate on the islands than on mainland Portugal. Data for mainland Portugal is presented in A.1.
Table 2.9: Cost data. The cost data for the Azores Islands is from ERSE [5], the International Renewable Energy Agency (IRENA) [6], and the International Energy Agency (IEA) [7]. Costs are annualized based on an 8% discount rate and a 20 year lifetime of generation investments.
Annualized Costs
Operating Cost, δg Investment Cost, αg
[$/kWh] [$/kW] Wind 0.0900 261 Offshore Wind 0.0490 562 Hydropower 0.0900 615 Geothermal 0.0220 397 Solar 0.3250 569 Wave 0.0560 629 Diesel 0.0420 130 Fuel Oil 0.0430 137 Biogas 0.0800 574
2.2.4
Scenarios
The Azores Islands case study is analyzed using a set of three scenarios, based on the geo-graphic attribution of the RET. In Scenario 1 - Isolated, each island is individually required to meet the RET, as a proportion of its own demand. This is represented mathematically in Equation 4.5.
Scenario 2 - Regional sets the geographic bound of the RET as the entire archipelago, allowing renewable energy production from any island to count toward meeting the target. In this case, the RET is applied to the combined demand of all islands in the archipelago. This modifies the right hand side of constraint 2.8, as in Equation 2.14 below.
X g X l X i REgWgil≥ (RET ) X i Di (2.14)
The largest geographic attribution of the RET is at the country level, Scenario 3 - Country, where renewable electricity production in Portugal qualifies as meeting the Azores RET. In this situation, Equation 2.8 becomes:
X l (X g X i REgWgil + X gport
REportWgportl) ≥ (RET )(
X
i
The generation capacity technologies available on mainland Portugal are different from the generation technologies used on the islands (see A.1). Therefore, a new parameter, REport
must be defined, to specify which of these technologies are renewable. The GEP model is also expanded with duplicates of Equations 2.2 - 2.7 and Equations 2.9 - 2.11, specified for the electricity system of mainland Portugal. Similarly, the objective function is updated to include investment and operating costs specific to the continent. Data for mainland Portugal can be found in Appendix A.1.
2.2.5
Limitations
The model proposed above does not consider electricity storage or energy efficiency as technology options available to meet an RET because reliable data are not available for these technologies for the Azores Islands.
2.3
Results
2.3.1
Scenario 1 - Isolated
Using the e-constraint method described in Section 2.2.2, we obtain the maximum renew-able energy production achievrenew-able on each island. Trenew-able 2.10 displays these results, with the islands ordered from lowest annual electricity demand (Corvo) to highest (São Miguel). Due to varied natural resource limitations, only two islands can reach the 75% RET on their own. These two islands, São Miguel and Terceira, are endowed with sufficient geothermal resources to produce renewable electricity beyond the 75% RET. No other islands have geothermal capacity suitable for electricity generation. A combination of wind, offshore wind, biogas and wave are the preferred investments on such islands. A.2 details the op-timal generation capacity investments for each island, at each RET, up to its maximum
achievable RET. We note that investment decisions are discretized by RET percentage point. Thus, reaching an RET of 50% does not depend on the investment decisions made to reach an RET of 49%. The decisions are separate and, as such, the graphs in A.2, as well as in the rest of the article, do not represent an evolution of investments from zero to X% RET, rather they represent discrete investment plan solutions.
In the lower RET range, generally from zero up to 25%, wind is the preferred renewable investment across the islands. After this point, a preference for biogas appears to replace fossil fuels used in baseload capacity. Offshore wind is utilized at higher RETs, as a com-plement to wind and biogas. If an island has some existing renewable capacity, such as Flores, biogas is the only renewable energy generation capacity investment made. This is due to its dispatchability for any load type.
Table 2.10: Maximum renewable energy production by island, with associated annualized cost.
Maximum Achievable Annualized Cost Annualized Cost
Renewable Energy Production [$2012] [$2012/kWh]
Corvo 64% 274,291 0.1875 Flores 58% 1,487,443 0.0948 Graciosa 59% 2,464,624 0.1355 Santa Maria 54% 3,426,387 0.1260 São Jorge 57% 5,530,256 0.1457 Pico 57% 8,751,799 0.1388 Faial 56% 9,408,336 0.1350 Terceira 79% 40,969,367 0.1387 São Miguel 100% 52,054,621 0.0858 Azores archipelago 85% 124,367,124 0.1095
The least cost investments necessary to achieve the maximum renewable energy pro-duction vary by island. The size of the islands’ electricity demand and the indivisibility of turbine/generator investments are the main drivers of this difference. This indivisibility is known as “lumpiness" in the operations management literature [51]. In the context of generation capacity investment, it is not possible to invest in half of a wind turbine. The investment must be made for a whole turbine, even if it means this will result in a slight overcapacity. The effect of lumpiness is seen clearly in the generation capacity expansion
graphs in A.2, as well as in Figure 2.8, in Section 2.3.5. Up to 22% RET on Corvo island, in Scenario 1 - Isolated (Figure 2.8), can be met with a single expansion in biogas that provides from 1% to 22% renewable energy production.
We note that it is the islands with a high proportion of existing renewable energy capacity that incur the lowest overall cost. The annualized cost per unit of production [$2012/kWh], in Table 2.10, shows São Miguel with the lowest cost, followed by Flores, which is the second smallest island in terms of demand. Flores incurs the second lowest cost, however, because it already has significant investment in hydropower and wind on the island. Likewise, São Miguel has significant existing investment in geothermal electricity production. Thus, the higher the share of renewable sources, the lower the cost of system operation. While initial achievement of an RET will have high associated capital costs, the long-term operational costs of a high renewables system will be lower than a carbon-intensive system.
2.3.2
Scenario 2 - Regional
Even with the seemingly abundant natural, renewable resources available among all islands in the archipelago, the highest RET that can be reached with a regional attribution is 85%. This is due to operating constraints on each island, and their lack of interconnection. While São Miguel has abundant geothermal capacity, it cannot overproduce to meet demand on another island because the extra power cannot be transmitted off the island. Subsea power cable transmission lines do not currently connect any of the islands in the archipelago. Our GEP does not take into account possible expansions in transmission capacity, though this could be a direction for future work, as increasing transmission capacity could improve the maximum regional RET attainable.
In setting a regional RET, we see investment in renewable energy on smaller islands only with an RET of 50% or higher. This is illustrated in the cost curves shown in Figure 2.2, which are flat until the 50% RET. Least-cost capacity expansion plans by island and
by RET are detailed in Appendix A.3.
0 20 40 60 80 100
Renewable Energy Target (%) 0 10 20 30 40 50 60
Islands - Cost [$2012 Million]
0 20 40 60 80 100 120 140
System - Cost [$2012 Million]*
Corvo
Faial FloresGraciosa PicoSanta Maria Sao MiguelSao Jorge TerceiraTotal System Cost*
Figure 2.2: Scenario 2 - Regional : Annualized system cost by island and for the entire archipelago (“System” axis), under a regional attribution of the RET.
The regional RET is met first by existing renewable energy capacity on the islands, then by investments in flexible renewable generation capacity that can meet multiple load types, such as geothermal and biogas. As seen in Table 2.11, existing renewable energy on the islands and investment in only geothermal capacity suffices up to a 50% RET. For higher RETs, a combination of wind, geothermal and biogas is necessary. It is not until the highest RET range, [76 - 85%], that investment occurs in offshore wind and additional hydropower. The higher cost of these generation technologies make them less desirable investments at lower RETs. Similarly, least desirable are solar and wave, which are never invested in, in a regional RET attribution. A combination of high investment cost and low capacity factor make solar generation unattractive on the Azores Islands. This is particularly true with the resources available regionally, including geothermal, which can contribute more efficiently to the RET. The investment cost of solar would need to fall to less than
one-Table 2.11: Average percent [%] of total capacity expansions in an RET range, by generation technology. The capacity expansions included here are the expansions that occur on the islands and do not include capacity expansions in mainland Portugal. In Scenario 1, only the first two ranges can be reported, as not all islands can meet the higher RETs. Similarly, the final RET range for Scenarios 2 and 3 go up to the maximum RET that is achieved in that scenario, 85% and 95%, respectively.
Scenario 1 Scenario 2 Scenario 3
Isolated Regional Country
RET range: [0-25%] [26-50%] [51-75%] [76-100%] [0-25%] [26-50%] [51-75%] [76-85%] [0-25%] [26-50%] [51-75%] [76-95%] Wind 0.96 6.19 - - 0 0 7.83 20.33 0 0.39 16.55 24.60 Offshore Wind 0.20 9.33 - - 0 0 0.15 17.81 0 0 0 20.19 Hydropower 0 0.72 - - 0 0 0 0.04 0 0 0 0 Geothermal 7.85 25.41 - - 4.58 54.94 60.20 37.96 19.75 64.99 53.77 46.17 Solar 0 0 - - 0 0 0 0 0 0 0 0 Wave 0 0.43 - - 0 0 0 0 0 0 0 0 Diesel 87.47 49.32 - - 94.68 44.36 17.04 8.81 75.86 28.95 14.80 10.04 Fuel Oil 0.45 0 - - 0.74 0.70 0.20 0.07 4.23 2.17 1.06 0.77 Biogas 3.07 8.62 - - 0 0 14.58 14.98 0.16 3.50 13.80 18.23
tenth of its current value, before it became an attractive investment. Even at such a low cost, investment would not be advantageous at lower RETs (≤ 50%). With a 30% higher capacity factor than solar, the investment cost for wave generation would need to fall by only 13% before it becomes an attractive investment.
2.3.3
Scenario 3 - Country
As described in Equation 2.15, the country scenario refers to an RET that includes produc-tion in both the Azores Islands and mainland Portugal. Thus, renewable energy capacity in both places counts toward achieving this common goal. Table 2.11 shows that investment in biogas on the islands occurs at lower RETs than it does under the Regional scenario. The same is true for investment in wind power, though investment in wind does not occur until at least 25% RET. Because additional renewable energy production from mainland Portugal is available to meet the RET, investment in offshore wind on the islands is not needed until RETs are set to the highest levels ([75-95%]). In this scenario, we see no investment in additional hydropower, as well as no investment in solar or wave energy. This is largely due to the higher costs associated with these technology options.
Compared to the Regional scenario shown in Figure 2.3, a country RET (Figure 2.4) results in higher levels of renewable energy production on the islands, at lower RETs.
0 20 40 60 80 100
Renewable Energy Target (%)
0 20 40 60 80 100
Renewable Energy Production [%]
Corvo
Faial FloresGraciosa PicoSanta Maria Sao MiguelSao Jorge Terceira
Figure 2.3: Scenario 2 - Regional : renewable energy production on each island, per RET. In a regional attribution of the RET, the smallest island, Corvo, never achieves higher than 22% renewable energy production. This is compared to 64% renewable production achieved in Scenario 1 - Isolated.
A country attribution of an RET must meet a higher overall demand. This requires more renewable energy investments at lower RETs, compared to Scenario 2. Even though mainland Portugal can make larger lump investments in renewable energy than the islands can, the smaller additional renewable energy capacities offered on the islands are still useful in reaching a country RET. The lower cost of some renewables on the islands, compared to mainland Portugal, is also a contributing factor to investment in renewables on the islands in a country RET attribution. These two contributing factors interact, resulting in a local investment mix that can change dramatically from one RET percentage point to the next. Even up to the highest RETs, investments and production on relatively small islands still occur. On São Jorge and Santa Maria, two middle-sized islands, investments are made at even high RETs (greater than 60%). As with Scenario 1 and Scenario 2, A.4 details the optimal capacity expansion investments by island and by RET.
0 20 40 60 80 100
Renewable Energy Target (%)
0 20 40 60 80 100
Renewable Energy Production [%]
Corvo
Faial FloresGraciosa PicoSanta Maria Sao MiguelSao Jorge TerceiraPortugal
Figure 2.4: Scenario 3 - Country : renewable energy production on each island, per RET. In a country RET, smaller islands have higher renewable energy production, at lower RETs, when compared to a regional RET. Because the demand pool is larger, relatively cheap renewable energy on the islands is attractive at lower RETs.
2.3.4
Economic Implications
Figure 2.5 shows the archipelago-wide cost of the three different scenarios. Expectedly, Scenario 1 - Isolated has the highest combined cost across RETs, as islands are required to meet the RET with the limited insular capacity available to them. Scarcity of supply means the islands must rely on generation options with higher costs.
Scenario 2 - Regional has lower archipelago-wide costs across RETs, as the pool of renewable generation capacity expands. As the pool expands even further, in Scenario 3 -Country, the resulting cost on the archipelago is generally more expensive than the regional RET attribution, but less than the isolated. Intuitively, as the generation pool widens, the cost should decrease because more and cheaper options become available. In the case of mainland Portugal and the Azores, the cheaper renewables on the islands are attractive to helping mainland Portugal meet its large demand. Thus, the country RET attribution
results in more investment in geothermal, wind and biogas on the islands at lower RETs, than in the regional scenario. This means that a country RET results in a more costly exploitation of renewable energy from the Azores Islands standpoint.
0 20 40 60 80 100
Renewable Energy Target (%)
0 20 40 60 80 100 120Cost [$2012 Million]
Scenario 1 - Isolated Scenario 2 - Regional Scenario 3 - Country
Figure 2.5: Costs per scenario Scenario 1 - Isolated has the highest archipelago-wide system cost, while the broader geographic RET attribution in Scenario 2 - Regional takes advantage of lowest cost renewables across the archipelago, resulting in a lower system cost across RETs. Scenario 3 - Country generally results in costs between Scenarios 1 and 2, though it is the least cost option for the RET range 54% - 60%, and above 72%.
The cost of reaching an 85% RET in Scenario 2 - Regional is just over $122 million, or $0.1077/kWh on the archipelago, whereas the cost of reaching a country-wide 85% RET is $95.8 million, or $0.0844/kWh on the archipelago. The distribution of investments, and thus the corresponding costs per island, vary widely. As is shown in A.5, the lowest cost scenario for each island oscillates between a regional and a country RET attribution, with the regional RET generally becoming the least cost solution in the higher RET range.
This is true for every island except São Miguel, whose lowest cost solution is always Sce-nario 1 - Isolated, shown in Figure 2.6. In Scenarios 2 and 3, investment in and production from geothermal energy is called upon earlier than is required for in the isolated scenario.
0 20 40 60 80 100
Renewable Energy Target (%)
0 10 20 30 40 50
Cost [$2012 Million]
Scenario 1 - Isolated Scenario 2 - Regional Scenario 3 - Country
Figure 2.6: Costs per scenario on São Miguel island. The least cost solution for the island of São Miguel is always Scenario
1 - Isolated. This is because, under any wider geographic attribution of an RET, the geothermal resources on São Miguel are
heavily exploited. This makes the other two scenarios more costly for São Miguel locally.
Additionally, geothermal on São Miguel is preferred to geothermal on Terceira because the turbine size on São Miguel is larger. The interactions of an increased level of demand, availability of low cost geothermal, and large size of the geothermal generation capacity prioritize investment in geothermal on São Miguel to meet regional and country RETs. Thus, both a country and regional RET result in a more expensive use of the renewable capacity on São Miguel than in the isolated case.
For the archipelago as a whole, however, a broader geographic RET attribution generally results in a net savings to the archipelago population. Figure 2.7 shows the cost savings of a regional RET, as compared to isolated and country RETs.
Compared to Scenario 1 - Isolated, a regional RET is always cheaper, with a net annual savings as high as $78 per capita, across the archipelago. The same is generally true of the comparison with Scenario 3 - Country, except after a 72% RET. This crossover point represents when investments in the regional RET maximize geothermal and biogas resources
0 20 40 60 80 100
Renewable Energy Target (%)
-150 -100 -50 0 50 100
Net Savings [$2012/capita]
Net savings from Scenario 1 - Isolated Net savings from Scenario 3 - Country
Figure 2.7: Net savings per capita of Scenario 2 - Regional RET attribution. Compared to Scenario 1 - Isolated, a regional RET is always cheaper. The same is generally true of the comparion to Scenario 2 - Country, except after a 72% RET. This crossover point represents when investments in the regional RET maximize geothermal and biogas resources on the islands.
on the islands. The same investment decisions occur in the country RET, but at 61%. After this point, investments in renewable energy in mainland Portugal are used to achieve higher RETs. While the country RET attribution represents a cost savings to the islands, it comes at a social and environmental cost, discussed in Sections 2.3.5 and 2.3.6.
2.3.5
Social Considerations
As Figures 2.3 and 2.4 illustrate, investment and production of renewable energy at high levels does not occur equally on the islands. Figure 2.8 shows the investment changes that occur on two selected islands, between the three scenarios. Diverse investments occur on the smallest island of Corvo when the RET is attributed at the geographically isolated level (Scenario 1). As the geographic attribution of the RET becomes wider, other renewable energy resources become available at lower cost. Consequently, investment on Corvo occurs
![Table 2.4: Existing Generation Capacity in 2008. Electricity generation on the islands is dominated by diesel and fuel oil, which together account for over 81% of total generation capacity [4].](https://thumb-eu.123doks.com/thumbv2/123dok_br/15240341.1022881/42.918.133.790.463.669/existing-generation-capacity-electricity-generation-dominated-generation-capacity.webp)
![Table 2.6: Capacity Expansion Integral. Expansions in generation capacity are limited by the size of the turbine [4].](https://thumb-eu.123doks.com/thumbv2/123dok_br/15240341.1022881/43.918.137.789.445.651/capacity-expansion-integral-expansions-generation-capacity-limited-turbine.webp)


![Table 2.11: Average percent [%] of total capacity expansions in an RET range, by generation technology](https://thumb-eu.123doks.com/thumbv2/123dok_br/15240341.1022881/50.918.137.787.214.380/table-average-percent-total-capacity-expansions-generation-technology.webp)


