Faculdade de Engenharia da Universidade do Porto
Eclipse based Environment for
Multi-Architecture Cross
Developments
Flávio Emanuel Santos Dias
Mestrado Integrado em Engenharia Electrotécnica e de Computadores
Supervisor: João Paulo de Sousa
c
Abstract
As the pressure to meet stricter deadlines increases in order to deliver a project in time, hardware and software developers have been struggling to cut the time wasted on activities not directly related to the project. One of tools used to improve the productivity is the Integrated Development Environment (IDE), generally provided by the vendors of embedded system(s).
This dissertation looks into the current state of the art of compilers, IDEs, programmers and debuggers on the attempt of unifying the development environments of some embedded systems architectures, under an Eclipse based IDE, thus providing an open-source and operating system agnostic platform that can be improved without the need to directly engage with the embedded systems vendors. A special focus is given to the current status of the debugging tools, since detecting defects is one of the main contributors to the increasing difficulties in estimating the delivery time of an hardware/software project.
An additional study is performed on non-critical tools, such as version control systems and tools that generate documentation from annotated source files. When correctly used, they can provide a huge boost on the productivity of a developer or a team of developers. A proof of concept IDE is proposed, proving that the idea of integrating tools for different hardware architectures is feasible and showing that, unfortunately, the weakest part in that integration is the debug component.
Acknowledgments
I would like to acknowledge the support of professor João Paulo de Sousa for his availability to supervise this project and the help of the technical assistants Vítor Pinto and Pedro Galvão.
I also want to express my gratitude to my family, due to their constant support and patience for the last few months.
And to the countless developers that dedicate their free time and knowledge on de-veloping open-source tools without ever asking for money or recognition and are always available to help those in need.
Flávio Emanuel Santos Dias
Contents
Abstract i
1 Introduction 1
1.1 Context . . . 1
1.2 Motivation and goals . . . 2
1.3 Reading Guide . . . 4
2 State of the Art 5 2.1 Development tools for AVR micro controllers . . . 6
2.1.1 Atmel Studio . . . 6
2.1.2 AVR Eclipse Plug-in . . . 7
2.2 Development tools for PIC micro controllers . . . 8
2.2.1 MPLAB X . . . 8
2.2.2 PikLab . . . 8
2.2.3 Discontinued Eclipse Plug-ins . . . 9
2.3 Development tools for TI MSP430 micro controllers . . . 10
2.3.1 Code Composer Studio . . . 10
2.3.2 MSP430 Eclipse . . . 11
2.4 Development tools for ARM based micro controllers . . . 12
2.4.1 ARM DS-5 Development Studio . . . 12
2.4.2 GNU ARM Eclipse . . . 12
2.4.3 MDK Micro Controller Development Kit 5 . . . 13
2.5 Preliminary Conclusions . . . 14 3 Related Work 15 3.1 PlatformIO . . . 15 4 Eclipse IDE 17 4.1 Architecture . . . 17 4.1.1 Workspace . . . 18 4.1.2 Workbench . . . 18
4.2 Plug-ins and Development Environment . . . 19
4.3 Selected plug-ins and productivity tools . . . 20
4.3.1 Doxygen . . . 20
4.3.2 Version Control Systems: Git and SVN . . . 21
4.3.3 Serial Console . . . 22
4.4 Transition to Code Composer Studio . . . 22
4.4.1 Configuration of the MISRA-C compliance checker . . . 22
vi CONTENTS
5 Embedded System Debugger 25
5.1 Source Level Debugging . . . 25
5.2 Debugging using GDB . . . 26
5.2.1 Technical Overview . . . 26
5.2.2 Interfaces for GDB . . . 28
5.2.3 Standalone debugging of embedded systems . . . 28
5.2.4 Integration into Eclipse . . . 30
5.3 Approaches for Embedded Systems Debugging . . . 31
5.3.1 In-Circuit Emulator . . . 31
5.3.2 On-Chip Debugger . . . 32
5.4 Debugging through JTAG . . . 33
5.4.1 OpenOCD . . . 33
5.4.2 AVaRICE . . . 34
6 Project Development 35 6.1 Hardware acquisitions . . . 35
6.2 Test Code Algorithms . . . 36
6.2.1 Software Delay . . . 37
6.2.2 Timer Interrupt . . . 37
6.2.3 External Interrupt . . . 38
6.2.4 Internal Peripheral . . . 38
6.3 Evaluation of the tool-chains . . . 39
6.3.1 AVR Eclipse Plug-in . . . 39
6.3.2 MPLAB X . . . 40
6.3.3 Code Composer Studio . . . 41
6.3.4 ARM DS-5 Development Studio and GNU ARM Eclipse . . . 41
7 Conclusions 43 7.1 Contributions . . . 43
7.2 Future Work . . . 44
7.2.1 AVaRICE . . . 44
7.2.2 Microchip PIC tool-chain integration . . . 44
7.2.3 Detailed test of ARM tool-chains . . . 44
A Listings of test cases 45 A.1 Software Delay . . . 45
A.1.1 For Atmel AVR micro controllers . . . 45
A.1.2 For Microchip PIC line of 8-bit micro controllers . . . 46
A.1.3 For Microchip PIC line of 32-bit micro controllers . . . 47
A.1.4 For Texas Instruments MSP430 micro controllers . . . 48
A.2 Timer Interrupt . . . 48
A.2.1 For Atmel AVR micro controllers . . . 48
A.2.2 For Microchip PIC line of 8-bit micro controllers . . . 49
A.2.3 For Microchip PIC line of 32-bit micro controllers . . . 50
A.2.4 For Texas Instruments MSP430 micro controllers . . . 51
A.3 External Interrupt . . . 52
A.3.1 For Atmel AVR micro controllers . . . 52
A.3.2 For Microchip PIC line of 8-bit micro controllers . . . 53
CONTENTS vii
A.3.4 For Texas Instruments MSP430 micro controllers . . . 55
A.4 Internal Peripheral . . . 56
A.4.1 For Atmel AVR micro controllers . . . 56
A.4.2 For Microchip PIC line of 8-bit micro controllers . . . 58
A.4.3 For Microchip PIC line of 32-bit micro controllers . . . 60
A.4.4 For Texas Instruments MSP430 micro controllers . . . 61
List of Figures
1.1 Project completion ratios . . . 1
2.1 Atmel Studio 7 Integrated Development Platform Composition . . . 6
2.2 Optimization Levels of different versions of the compiler . . . 8
2.3 Code Composer Studio accessing the Eclipse Marketplace . . . 10
2.4 Fundamental Components of the MDK core . . . 13
4.1 Simplified view of Eclipse subsystems . . . 18
4.2 Relationship between Eclox and Doxygen . . . 21
5.1 Overall Structure of GDB . . . 27
5.2 Text User Interface of a simple adder . . . 28
5.3 GDB connected to remote target on port 55000 . . . 29
5.4 A debug session on Eclipse . . . 31
6.1 Loading from the target hardware . . . 40
List of Tables
1.1 Main Differences between Eclipse and Visual Studio . . . 2
2.1 List of tools to be further investigated . . . 5
2.2 Summary of each development environment feature . . . 14
6.1 Acquired hardware . . . 36
List of source codes
3.1 Platformio.ini file . . . 16
4.1 Masking libraries with pragma directives . . . 23
A.1 A simple loop for Atmel AVR micro controllers . . . 45
A.2 A simple loop for Microchip PIC line of 8-bit micro controllers . . . 46
A.3 A simple loop for Microchip PIC line of 32-bit micro controllers . . . 47
A.4 A simple loop for Texas Instruments MSP430 micro controllers . . . 48
A.5 A timer interrupt for Atmel AVR micro controllers . . . 48
A.6 A timer interrupt for Microchip PIC line of 8-bit micro controllers . . . 49
A.7 A timer interrupt for Microchip PIC line of 32-bit micro controllers . . . 50
A.8 A timer interrupt for Texas Instruments MSP430 micro controllers . . . 51
A.9 An external interrupt for Atmel AVR micro controllers . . . 52
A.10 An external interrupt for Microchip PIC line of 8-bit micro controllers . . . 53
A.11 An external interrupt for Microchip PIC line of 32-bit micro controllers . . . 54
A.12 An external interrupt for Texas Instruments MSP430 micro controllers . . . 55
A.13 Peripheral (ADC) for Atmel AVR micro controllers . . . 57
A.14 Peripheral (ADC) for Microchip PIC line of 8-bit micro controllers . . . 58
A.15 Peripheral (ADC) for Microchip PIC line of 32-bit micro controllers . . . 60
A.16 Peripheral (ADC) for Texas Instruments MSP430 micro controllers . . . 62
Chapter 1
Introduction
1.1
Context
As in many other consumer oriented industries, the embedded systems industry is suffering an increasing pressure to reduce the time to market the products. However, recent market studies [1, 2] confirm an unfortunate trend - more than half of the projects end up being late and a small number is even canceled. In fact, while in 2012 44% of all the projects were completed on schedule or ahead of schedule and 56% were late or canceled [1], from 2013 to 2015 these ratios became 43/57, 41/59 and 38/62 respectively (figure 1.1).
Figure 1.1: Project completion ratios [2, p.23]
Consequently there is an urgent need to correct this situation, by optimizing the more resource-intensive tasks. Currently, on average, 61% of a project’s resources are devoted
2 Introduction
to software development [1, p.14], making this task the more resource intensive one, and a natural target for optimization.
One of the possible paths to optimization is the use of Integrated Development Envi-ronments (IDEs), which consist of a set of software applications, integrated under a unified graphical user interface and incorporating a comprehensive list of functionalities designed to maximize the productivity of the embedded developer.
In its simplest form, an IDE consists of a source editor bundled with a compiler specific to a processor family and programming language, a linker and in some cases a debugger, where everything is abstracted under one interface. As such, the details of each tool are hidden from the user and handled directly by the IDE, considerably reducing the learning curve and the apparent complexity of the development process.
In addition, an IDE can include other functionalities such as intelligent code completion and code analysis software such as standard compliance checkers, introducing a very light concept of Correctness by Construction, which is based on two fundamental principles: to make it difficult to introduce errors in the first place, and to detect and remove any errors that do occur as early as possible after introduction [3], instead of waiting to observe the operational behavior of the developed code.
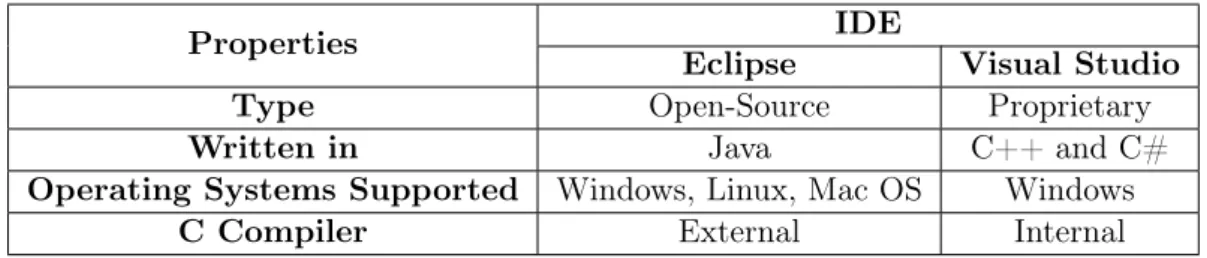
From all the existing IDEs, the software industry in general is gravitating towards either the open source Eclipse framework, or the proprietary Visual Studio, whose main differences are high-lighted on table 1.1, and the reason why only these two will most probably survive in the future is the leverage effect of increasing returns: an IDE that offers already a lot of integration between component tools has an easier job attracting more users, and more users attract more development opportunities. Although this effect works irrespective of whether or not the tool is open source, the embedded systems industry has made to a large extent the choice for Eclipse.
Table 1.1: Main Differences between Eclipse and Visual Studio
Properties IDE
Eclipse Visual Studio
Type Open-Source Proprietary
Written in Java C++ and C#
Operating Systems Supported Windows, Linux, Mac OS Windows
C Compiler External Internal
1.2
Motivation and goals
Besides the pressure to be more productive, developers often face the need to choose the processor(s) that will be used, in order to maximize performance and to minimize power consumption, while keeping the costs down. In many cases the choice goes to use different
1.2 Motivation and goals 3
processor chips, from different vendors [2, p.39] on the same project, or to frequently change processors between projects [2, p.61].
And even though there are already multiple solutions aimed to satisfy the typical developers’ needs, most of them only support a small set of existing processor architectures and are based on proprietary code, meant to be commercialized. Open-source solutions, on the other hand, usually focus only on one architecture at a time. This situation ends up reducing the productivity of developers of multi-architecture projects by increasing the setup time of the project, including the time required to adapt to new tools.
This is precisely the problem addressed by this work - there is space for a unified IDE, which integrates different tool-chains, as much as possible independent of the operating system and capable of providing developers with the flexibility to tackle the most adequate platform to the task at hand. This will fill a gap not only in industry, where multidisci-plinary teams would benefit from a unified programming user interface and environment, regardless of the target hardware platform and underlying operating system, but also in academic environments where students often have to learn different tools for accomplishing similar programming tasks, depending on the chosen hardware architecture.
This IDE is meant to support cross developments for embedded systems in C, the most used programming language in the embedded systems industry [1, p.18], to support dif-ferent micro controller architectures (Atmel AVR, Microchip PIC, TI MSP430 and ARM) and to be as much as possible independent of the underlying operating system. The three major aspects that were pursued on this work are the following:
1. OS independence: many available tools are OS specific. In this work the objective is to integrate tool-chains capable of running on top of different operating systems. This way the resulting development environment can be used regardless of the under-lying OS. The goal is to have applications running on Windows and Linux. MacOS is left aside just because it is not possible to guarantee a computer for an adequate testing environment.
2. Multi-architecture: most available tools are specific to a certain target archi-tecture. In this work the objective is to integrate, under the same graphical user interface, a set of different tool-chains in order to support cross development for dif-ferent families of embedded processors. The initial goal is to assess the feasibility of including AVR, PIC, MSP430 and ARM hardware platforms.
3. Tool integration: in this respect the goal is to use Eclipse itself, or an IDE based on Eclipse, as a tool wrapper for different open source components, with a special emphasis on the integration of a debugger component for each hardware platform, if possible, since testing and debugging can take up to 20% of the development time [2, p.20].
Additional tools are also considered to be included in the final build of the proof of concept IDE:
4 Introduction
1. Documentation generator directly from annotated source files, since the first aspect to suffer when a project is late is usually the proper documentation of the code. Needless to say that the few minutes saved by not properly documenting every day of work will only make the crunch harder as the deadline comes closer [4].
2. A compliance checker for MISRA-C [5] given the recent trend to meet safety & development process standards.
3. Version control capabilities, since it facilitates sharing source code among team mem-bers.
4. Last, but not least important, a serial console directly embedded on the IDE, allowing communication with applications without a Graphical User Interface.
1.3
Reading Guide
Following this introductory chapter, the present document reports the review of the current state of the art on free or open-source tool-chains and IDEs in chapter 2. In chapter 3 a related work is described and the differences to this work are explained. Following that, the structure of the Eclipse IDE and why it fits the task at hand is explained in chapter 4. On chapter 5 the focus shifts towards the debugger and its internal components, since it will lead to the functional validation of some of the test algorithms used on chapter 6. Finally, chapter 7 summarizes what has been accomplished and discusses a few still open issues.
Chapter 2
State of the Art
Taking into account the objectives listed in chapter 1, and in order to better understand the functionalities required to implement a set of tool-chains robust enough to attract developers, it was decided to take input from different alternatives in the market. Not only they demonstrate which type of features current developers levitate to, but they also help to better steer the project.
In order to compile an appropriate number of existing alternatives, two key features were used to make an initial selection of candidates. The first one was the possibility of running both in Windows and Linux. Mac OS was not considered for this work since there wasn’t a Mac OS computer available to use.
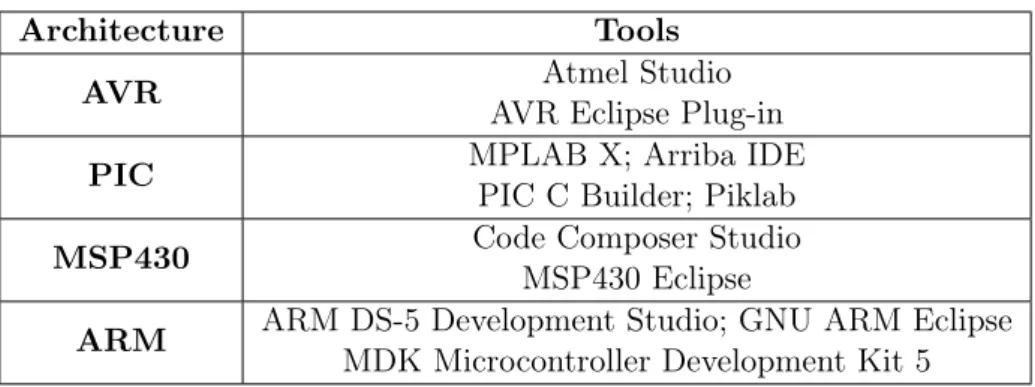
The second key feature was the possibility of incorporating in the IDE a real-time debugger. Based on this criteria a few tools were selected to be further investigated. They are listed in table 2.1 and the findings on each one of these tools are documented in the following sections.
Table 2.1: List of tools to be further investigated
Architecture Tools
AVR Atmel Studio
AVR Eclipse Plug-in
PIC MPLAB X; Arriba IDE
PIC C Builder; Piklab MSP430 Code Composer Studio
MSP430 Eclipse
ARM ARM DS-5 Development Studio; GNU ARM Eclipse MDK Microcontroller Development Kit 5
6 State of the Art
2.1
Development tools for AVR micro controllers
2.1.1 Atmel Studio
Atmel Studio (currently at version 7) is without doubt the most complete IDE for AVR micro controllers. Built by Atmel on top of Microsoft’s Visual Studio, it inherits the characteristic of only running on Windows Operating Systems. As shown in figure 2.1 the Atmel Studio can be decomposed in several components, with two of them of major interest to this work.
Figure 2.1: Atmel Studio 7 Integrated Development Platform Composition [6]
The first component is the Atmel Dev Tools, which is nothing more than a stand-alone tool-chain based on the free and open source GCC compiler [7] that is used to build AVR dedicated projects. Unlike the IDE, this tool-chain can also run on Linux operating systems.
The other component of interest is the Atmel Software Framework, which is a collection of embedded software for Atmel flash micro controllers, designed to help develop and glue together the different modules of a software project [8]. Although it doesn’t exactly fit the proposed objective of this work, it is still an interesting proposal that could be integrated in the final build of the IDE.
Other features include the Atmel Spaces, a cloud-based collaboration work space for hosting software and hardware projects targeting Atmel micro controllers which can be added as an extension to Atmel Studio through the Atmel Gallery [6, p.3]. Likewise, other extensions such as SVN and/or GIT support can also be added. Similarly, serial monitors are also implemented through this chain of suppliers and generating documentation from source files is possible thanks to the integration of the Doxygen Tool (further described on subsection 4.3.1), either as an external tool, or as a plug-in obtained through the Atmel Gallery.
But most important, it offers complete debugging support complemented with simula-tors of the AVR micro controllers, enabling it to set watchpoints and to inspect registers and I/Os in real-time. Additionally, it is fully compatible with all of Atmel debuggers and programmers, such as the AVR Dragon and JTAGICE [9].
2.1 Development tools for AVR micro controllers 7
2.1.2 AVR Eclipse Plug-in
Like its name indicates, the AVR Eclipse Plug-in is a plug-in designed to provide Eclipse with tools and settings for developing C programs for AVR micro controllers. Thus, this plug-in is an obvious subject to be further explored as it overlaps most of the requirements of this work.
Since it is simply an add-on to the Eclipse platform, this plug-in guarantees compati-bility to every major operating system, as long as the underlying tool chain is compatible with it. This is the case of the AVR GCC Toolchain. Which within the context of the AVR Eclipse plugin the word AVR-GCC tool chain is used quite liberally for all tools and files required to develop and deploy applications for AVR processors with this Plugin [10]. Other characteristics like version control, serial console management and standard compliance checking can be provided by the IDE itself through adequate plug-ins.
In terms of debugging capabilities, the AVR Eclipse Plug-in works with GDB, the GNU project debugger, that implements a client-server interface with the client being the user interface and the server either a simulator or a JTAG interface [11], and with a custom program, the AVaRICE, acting as a bridge for both.
Unfortunately, this side of the tool-chain is currently underdeveloped, due to changes on the communication protocol used by the Atmel in the newer ICE platforms. Further investigation of this plug-in can be found on chapter 6.
8 State of the Art
2.2
Development tools for PIC micro controllers
2.2.1 MPLAB X
MPLAB X is the proprietary IDE from Microchip that runs on Linux, Windows and Mac OS X [12] and it is the reference program to develop for PIC micro controllers and one of the few IDE for embedded systems based on Oracle’s Netbeans IDE.
Like Eclipse, multiple productivity oriented plug-ins can be obtained through the IDE plug-in manager or bought using the MPLAB X store. Unfortunately the software offer is reduced, and plug-ins that integrate tools like Doxygen and a serial console still need to be more polished.
In order to enable the debugging of the target embedded systems, the MPLAB X supports both the use of PIC simulators as well as the use of an in-circuit debugger/pro-grammer, such as the PICkit 3. The debugger provides breakpoints, single stepping, Watch windows and all the features of a modern debugger [13]. Supporting all these functions are the MPLAB XC compilers, which can also be downloaded apart from the IDE, offering different optimization levels accordingly to the edition selected, as shown on figure 2.2.
Figure 2.2: Optimization Levels of different versions of the compiler [14]
2.2.2 PikLab
PikLab is an open-source IDE for programs designed to work with Microchip PIC series of micro controllers. It supports Windows and Linux Operating Systems and provides access to a wide array of tool-chains, which unfortunately most are currently discontinued or badly supported.
Additionally, a considerable amount of programmers are supported, although the ability to debug the behavior of the micro controllers is rather small, with only support to the PIC18F series and a few PIC16F series. On the other hand, software simulator support ranging from the PIC10F to the PIC18F family of micro controllers is included [15].
As it stands, this IDE has no utility for this work or for the community built around Microchip products. Moreover, it fails to integrate software to document the source code and version control software, forcing the developer to use those tools outside of the IDE.
2.2 Development tools for PIC micro controllers 9
2.2.3 Discontinued Eclipse Plug-ins
The Eclipse platform has seen it’s fair share of microchip PIC oriented plug-ins in the last years, however none has a defined road map for the next years.
One of them was the Arriba IDE. It was a general IDE that also could be obtained as an plug-in developed by VioSoft Corporation that supported Microchip PIC32 micro controller units due to its MIPS based architecture. That way, it provided support for all three major Operating Systems and replicated most of the functionalities found on MPLAB X through the integration of Microchip’s MPLAB XC C compilers, hardware debug tools and simulator [16]. Additional features could be obtained through the use of general Eclipse plug-ins, such as the support for automatic documentation and version control.
However, this IDE hasn’t seen any development on the last couples of years, being even incompatible with newer versions of Eclipse.
On the other side there was the PIC C Builder, which was a very small open-source project to implement a tool-chain on Eclipse capable of building projects for Microchip PIC micro controllers [17]. Like the other Eclipse plug-ins here presented, it supported Linux, Windows and Mac OS and could be expanded through the use of third-party software.
However, the existing documentation about its debugging capabilities is scarce and incompatible with newer versions of Eclipse. For this reason further exploration of this tool was abandoned.
10 State of the Art
2.3
Development tools for TI MSP430 micro controllers
2.3.1 Code Composer Studio
The Code Composer Studio (currently at version 6) is the leading IDE from Texas Instru-ments to develop solutions to the MSP430 family of micro controllers. It can be obtained through free or paid licenses, with the free version imposing restrictions to the maximum size of a project and type of debug probe [18].
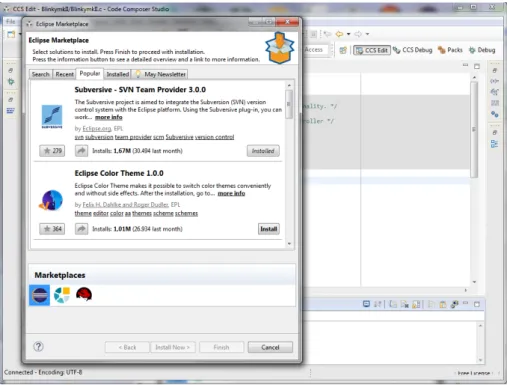
Based on the Eclipse IDE, this software inherits from its base platform the ability to run on Linux and Windows operating systems. Besides this, it also inherits the access to the Eclipse marketplace, as shown on figure 2.3, but with the capability to also access their own App Center. This also guarantees support for other tools like a serial console and version control.
Figure 2.3: Code Composer Studio accessing the Eclipse Marketplace
Under the hood of this IDE is the Texas Instruments proprietary compiler, which brings some extras that differentiates from other alternatives. One of those extras is the EnergyTrace Technology which is an energy-based code analysis tool that measures and displays the application’s energy profile and helps to optimize it for ultra-low power consumption [19, p.20]. Other tools like an Optimizer Assistant and an Ultra-Low Power Advisor are also included.
It includes a MISRA-C 2004 standard compliance checker within the compiler, allowing the developer to adapt his personal coding style in order to be compliant with the MISRA C rules, if necessary [20, p.87].
2.3 Development tools for TI MSP430 micro controllers 11
In addition, it can also use MSP430 GCC which is a open source compiler resulting from a partnership between Texas Instruments and Somnium Technologies (formerly maintained by Red Hat until the first quarter of 2016) to bring a new and fully supported open source compiler as the successor to the community driven MSPGCC [21, p.7]. Note that syntax for the Code Composer Studio C compiler and syntax for the Somnnium GCC for MSP430 compiler are not fully compatible so some code needs to be ported between compilers [19, p.61].
It also provides the expected debugging capabilities, such as allowing access to registers and memory of the micro controller, the setup of breakpoints, watchpoints and statistic counters, independently of the compiler used.
2.3.2 MSP430 Eclipse
MSP430 is a plug-in that adds to the Eclipse IDE the capabilities to compile and debug code for Texas Instruments embedded systems [22]. It combines the GNU Project Debugger (GDB) with the MSPDebug tool used as a proxy for GDB, allowing Eclipse to program and disassemble MSP430 projects.
Like Code Composer Studio, it supports breakpoints and memory inspection, without the memory’s size restriction imposed by the free version of Code Composer. As any other Eclipse plug-in presented, code version control and automatic documentation are implemented thanks to third party plug-ins.
However, the accepted compiler is still the community driven MSPGCC, not the up-dated MSP430 GCC created by Texas Instruments and Somnium Technologies/Red Hat, which this plug-in does not support yet.
12 State of the Art
2.4
Development tools for ARM based micro controllers
2.4.1 ARM DS-5 Development Studio
ARM DS-5 Development Studio is the leading IDE for building and designing applications targeting ARM micro controllers. Based around the Eclipse IDE, this development tool is provided on three different packages, ranging from a free community edition to two paid versions geared towards the business environment with differences ranging between supported compilers, and debugging capabilities.
And although based on the Eclipse IDE, it only provides full support for windows and Linux distributions [23, p.22].
At the heart of this software application are their proprietary compilers, ARM C Com-piler 5 and 6, with 6 being exclusively used with the ARMv8 architecture [24]. Unfor-tunately those compilers are only available on the paid versions. For the users of the community edition there are the Linaro GNU GCC Compilers [25] or the GNU Tools for ARM Embedded Processors [26].
The DS-5 Development Studio also includes their proprietary debugger, with a graph-ical interface. It supports the software development on ARM processor-based targets and Fixed Virtual Platform (FVP) targets [23, p.14], which enables development of software using a simulator. The simulator, however, does not have absolute timing accuracy, barring the developer from relying on the accuracy of cycle counts, low-level component interac-tions, or other hardware-specific behavior [23, p.15]. The debugger has all the character-istics presented by a modern debugger, with some extra functionalities reserved for the paid versions like the ability to rewind the program execution and to perform Trace-based function profiling.
2.4.2 GNU ARM Eclipse
GNU ARM Eclipse is a well-rounded and open source family of plug-ins for Eclipse IDE, based on GNU tool-chains. And as many Eclipse plug-ins, it supports Windows, Linux and Mac OS X environments, and third-party plug-ins can be added to integrate source control and other tools mentioned on section 1.2.
There are two approaches to debug projects. The first is to use a JTAG probe with a GDB server running on the computer. This server can be implemented using either the J-link plug-in, specific to the SEGGER J-link probe [27] or the GNU ARM Eclipse OpenOCD, a customized version of OpenOCD [28]. The second can use source machine emulator, named GNU ARM Eclipse QEMU which provides the support for the emulation of Cortex-M series micro controllers [28].
These functionalities are complemented with the integration of the CMSIS Pack tech-nology, a vendor-independent hardware abstraction layer for the Cortex-M processor [29]
2.4 Development tools for ARM based micro controllers 13
which is used to assist the debugger in examining and modifying the micro controller mem-ory and provides access to various documents such as data sheets, reference manuals, and schematics [27].
2.4.3 MDK Micro Controller Development Kit 5
MDK Micro controller Development Kit 5 is a solution from Keil for ARM devices, split between four editions; three paid and a free, but more limited, solution [30, p.7]. Unlike the other development tools for ARM micro controllers, this IDE is based on the µVision IDE and only supports the Windows Operating System.
However, every edition can be characterized by what is called the MDK Core which includes all the components that are needed to create, build, and debug an embedded application (figure 2.4).
Figure 2.4: Fundamental Components of the MDK core [30, p.7]
Software packs contain information about each micro controller and code examples that are available to be included on a application as building blocks. The previously mentioned CMSIS packs are included in this component but software packs also contain middleware and low-level device drivers [30, p.18]. It uses the ARM C compiler exclusively, even the free version.
As shown in figure 2.4, the IDE also has a debugger with trace, allowing features like sampling, data trace, exceptions including program counter (PC) interrupts, and instru-mentation trace as long as they’re available in the device under inspection [30, p.64]. Usual features such as stepping, breakpoints and memory inspection are also available.
Unfortunately, this isn’t as flexible as other options since it doesn’t allow the possibility to add compliance checkers, serial terminals and documentation generators.
14 State of the Art
2.5
Preliminary Conclusions
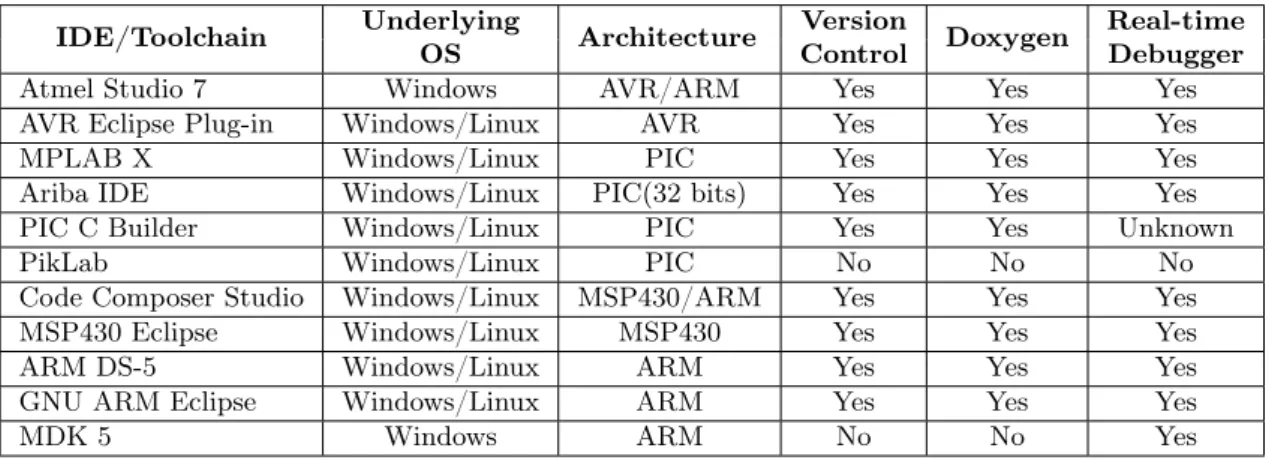
Taking into account the information gathered during this survey, it can be concluded that, as already mentioned in section 1.2, the existing open-source projects that implement dedicated tool-chains for embedded systems, usually focus on a single architecture and most of the times lack functionalities found on proprietary integrated development environments. Fortunately, almost every single option excels on providing support for all the three major Operating Systems on the market. Atmel Studio and Keil MDK 5 are the exceptions. As such, they end up failing one important objective of this work and even though they are well-rounded IDEs, they will be excluded from further investigation, even though Atmel’s documentation will play a great part on the development of this project.
Table 2.2 summarizes the conclusions of this survey. In each case we restricted the evaluation to the main platform that is supported, since Code Composer Studio and Atmel Studio also support some ARM micro controllers.
Table 2.2: Summary of each development environment feature
IDE/Toolchain Underlying OS Architecture Version Control Doxygen Real-time Debugger
Atmel Studio 7 Windows AVR/ARM Yes Yes Yes
AVR Eclipse Plug-in Windows/Linux AVR Yes Yes Yes
MPLAB X Windows/Linux PIC Yes Yes Yes
Ariba IDE Windows/Linux PIC(32 bits) Yes Yes Yes
PIC C Builder Windows/Linux PIC Yes Yes Unknown
PikLab Windows/Linux PIC No No No
Code Composer Studio Windows/Linux MSP430/ARM Yes Yes Yes
MSP430 Eclipse Windows/Linux MSP430 Yes Yes Yes
ARM DS-5 Windows/Linux ARM Yes Yes Yes
GNU ARM Eclipse Windows/Linux ARM Yes Yes Yes
Chapter 3
Related Work
This chapter describes a software development environment that has some similarities with this work. It was discovered during the survey of the state of the art.
In spite of the similarities it remains sufficiently different in its goals and approaches but is reported here for the sake of transparency.
3.1
PlatformIO
PlatformIO is a cross platform builder and library manager for a high variety of embedded systems. Initially designed to work with a command line interface, allowing it to be inte-grated on other IDEs, such as Eclipse, it recently developed their IDE based on GitHub’s Atom Text Editor [31, p.09].
The IDE itself, was designed as a special variant of Chromium, an open-source web browser, modified to act as a text editor rather than a web browser since it restricts access to the local system for security reasons. Every Atom window is essentially a locally-rendered web page [32, ch.1].
It supports all three major operating systems, and requires a Python Interpreter to be installed. Likewise, Eclipse requires a java virtual machine to achieve it interoperability between the operating systems.
The core of PlatformIO is a .ini configuration file, an informal standard for configu-ration files for some platforms or software, named platformio.ini. This file is divided in sections, denoted by a [header] and key / value pairs within the sections.
In each of these sections the necessary parameters are defined to successfully build the application. For instance, one of the sections stores the directory paths to the source and libraries while other stores the embedded system to be used, its clock frequency and the amount of flash memory. Other section may list source code examples available for that system. A part of this configuration can be seen on listing 3.1, which shows one of the sections for an Arduino Uno development board.
16 Related Work
Code 3.1Platformio.ini file
# [env:mybaseenv]
# platform = %INSTALLED_PLATFORM_NAME_HERE%
# framework =
# board =
#
# Automatic targets - enable auto-uploading
# targets = upload
[env:uno]
platform = atmelavr framework = arduino board = uno
As the inclusion of the Arduino Uno board indicates, PlatformIO supports Atmel AVR 8- and 32-bit micro controllers. The rest of the families of embedded systems are also supported with the exception of Microchip PIC line of 8-bit micro controllers. Other families of embedded system are also supported, but are beyond the scope of this work, unlike the 8-bit Microchip PIC products [31, ch.4.8].
Other interesting approach taken by PlatformIO is that its main targets are develop-ment boards, not bare metal micro controllers. However, the PlatformIO tool chain is flexible enough and designed to support added custom development platforms.
For example, it creates a target to the Arduino Uno board, but not necessarily to the Atmel Atmega328p that the board uses. That may be because hobbyists and some academic courses which require a light introduction to embedded systems are the main focus of the developers of the tool. Fact supported with the additional support for high-level languages, like Wiring, used to program Arduino boards.
Using development boards to quickly prototype something on the embedded systems industry and some advanced courses is quite beneficial, but our work is ultimately more directed to a more deeper approach, using standard C.
PlatformIO also includes a Built-in Terminal with PlatformIO CLI tool and support for a Serial Port Monitor [33]. Since the designer of the the base IDE is Github, it uses Git as it’s primary tool of version control. SVN compatibility is also attainable through a package (Atom IDE version of Eclipse plug-ins).
No known MISRA-C compliance checker was been included on the IDE. And due to its small market share, this scenario will not likely change in the foreseen future due to expected low return of investment.
Chapter 4
Eclipse IDE
As stated earlier, the Embedded Systems Industry has been using the Eclipse IDE to a great extent. It is not a surprise that many of the vendors researched are using Eclipse as their preferred development environment. However, a detailed answer on why Eclipse is so popular was not given yet. This chapter tries to give an answer to this question by providing an overview of the Eclipse Platform and the aspects that are required to integrate custom tools and make the IDE so popular.
It then proceeds to explain which productivity tools were selected to be bundled with the proof of concept build and when one was not available, the corrective actions taken, leading to the explanation of the replacement of the basic Eclipse IDE by the Texas In-struments Code Composer Studio as the underlying platform for the rest of this work.
4.1
Architecture
The Eclipse IDE is structured as a set of subsystems which are implemented in the form of one or more plug-ins, running on top of a small runtime engine, as shown in figure 4.1, that represents the runtime platform and the generic plug-ins, Workbench, Workspace, Help and Team. The functionalities of this runtime engine are generic by nature, with the plug-ins being the ones to bring specific functionalities. Even more specific plug-ins can be added, one of those being the C/C++ Development Tools (CDT Project) that grants the capabilities of a full-featured C IDE to Eclipse.
This concept is implemented using extension points defined on xml files. This method is used in order to achieve loose coupling between the modules since if components are tightly integrated, late modifications can cause a ripple of changes across the whole system to the point of turning it not viable to work with anymore. So when a plug-in wants to allow other plug-ins to extend its features, it will declare an extension point. The extension point defines a set of rules that other plug-ins must conform to.
When activated, the Platform Runtime discovers the set of plug-ins that are ready to be deployed, reads their manifests, and builds an in-memory plug-in registry, instead of
18 Eclipse IDE
instantly trying to load them [34]. So a plug-in is only activated when its code actually needs to be run, using the plug-in registry to discover and access their settings. This concept is known as lazy loading.
However once activated, a plug-in remains active until it is explicitly deactivated or the IDE is terminated.
4.1.1 Workspace
Returning to figure 4.1, the two aspects that normal users will have most contact with will be the workbench and the workspace. The workspace is the file path were the user is typically working in and where the source files, image files and other artifacts are stored. It can also contain preference settings, meta data and logs. Multiple workspaces can coexist within the same computer.
Too reduce the risk of someone or something accidentally deleting files, a workspace history mechanism keeps locally a track of previous content of the files. The user has some control over this mechanism, managing it via space and date based preference settings.
Figure 4.1: Simplified view of Eclipse subsystems [35]
4.1.2 Workbench
The term Workbench refers to the desktop development environment that provides the Eclipse UI personality and the required structures for the interaction of the user with the plug-ins. Its API and implementation are built from two toolkits [34]:
4.2 Plug-ins and Development Environment 19
• SWT : a widget set and graphics library integrated with the native window system but with an OS-independent API.
• JFace: a UI toolkit implemented using SWT that simplifies common UI programming tasks.
SWT is the foundation on which the entire Eclipse UI is built upon. It uses native widgets whenever possible on a platform and supplements them with emulated widgets on platforms where they don’t exist; a good example of this is the tree widget that exists in native form under Windows, but is emulated under Linux [36, p.137]. This method allows SWT to keep the same programming style consistent between different systems and homogenizes the look and feel of the Eclipse platform.
JFace is the other toolkit and it is designed to work with SWT without masking it from the developers. It includes the usual UI toolkit components of image and font reg-istries, dialog, preference, and wizard frameworks, and progress reporting for long running operations [34].
It then takes the Workbench API to use those two general purpose toolkits to imple-ment the UI. The interface is based on editors, views and perspectives, although for the user point-of-view it only consists of editors and views since perspectives deal with the ar-rangement and visibility of these components. Multiple perspectives can exist within the same workbench, but with only one active at any given moment. For example compiling and debugging are two different perspectives of the same project.
As their name states, editors allow the user to open, edit and save objects while views provide information about the objects that are being edited.
4.2
Plug-ins and Development Environment
The popularity of the Eclipse platform with third-party vendors is due to the fact that its modular structure is fully available to them, so that each vendor can concentrate on developing the plug-in fit to their needs, without having to worry about all the details of the platform.
In addition, the plug-in development process itself is very well defined: the Plug-in Development Environment (PDE) is the tool-chain responsible for providing the required tools to create, develop, debug, build and deploy Eclipse plug-ins [37]. This environment can be broken onto three main components, its UI, the API tools and PDE Build.
The PDE UI provides the editors and views that create the full featured environment to develop the plug-ins. The Form-Based Manifest Editors, are one of the most interesting parts of this UI since they are multi-page editors that centralize the management of all manifest files of a plug-in.
The API Tools aids in the documentation and maintenance of the APIs implemented by plug-ins by producing binary compatibility analysis relative to previous versions of a
20 Eclipse IDE
plug-in and providing specific Javadoc tags that explicitly define restrictions associated with plug-in’s methods.
Lastly, PDE Build facilitates the automation of plug-in build processes using Apache Ant scripts, a Java library used to build applications [38]. Those scripts can retrieve the relevant projects from Control Version Systems repositories, jar files and Javadoc files in order to put it in a format apt to be shipped.
4.3
Selected plug-ins and productivity tools
For each hardware platform there must be a plug-in that manages compilation, build and debugging functionalities. In addition to these basic features, the major hurdles that can compromise the productivity of developers must be addressed by a set of specific plug-ins common to all the hardware platforms:
• A tool for generating documentation from annotated C source code tackles the neg-ative effect that poor documentation causes when trying to maintain legacy code or when introducing new elements in a team. A common misstep when any company is working extra hours for extended periods of time in order to finish a project or meet a deadline.
• A version control system, such as git or SVN to improve the ability to securely share source code with other team members and provide a reliable way of restoring projects from failed modifications.
• A tool for style compliance checking, very important in large projects and in case the application requires strict compliance with a given style. In this work, the MISRA-C [5] guide is chosen given its increasing importance and popularity.
• Finally, a serial console is an indispensable way of communication with the embed-ded hardware platform to retrieve the data it produces or when a debugger is not available, to act as a primitive method of application debugging.
The following plug-ins were selected to implement these functionalities.
4.3.1 Doxygen
Doxygen is the de facto standard tool for generating documentation from annotated C source files [39]. Since the documents are extracted directly from the source code, it is easier to maintain consistency between code and document and besides simple text, Doxygen is also capable of drawing dependency graphs automatically. This function can be expanded by using other programs to design state machines, trees, lists and message sequence charts.
4.3 Selected plug-ins and productivity tools 21
The tool can run externally or using its own user interface, but this method can become cumbersome to some developers. The Eclox plug-in solves this issue, acting as a Doxygen front end and providing a high-level graphical user interface over Doxygen. Figure 4.2 shows the relationship between the two applications.
Figure 4.2: Relationship between Eclox and Doxygen [40]
4.3.2 Version Control Systems: Git and SVN
Version Control Systems (VCS) are the recommended tools to deal with the development and maintenance of source code over time by a team of developers. By correctly using a VCS, developers gain access to a complete long-term change history of every file, enabling them to know when a file was created, deleted or edited and by whom.
If by accident or bad directory management the files are deleted or corrupted, turning the whole project too unstable to work, version control systems enable its users to recover these lost files and revert the project to previous saved versions.
Additionally, it allows a team to work concurrently and when a conflict is detected it allows the problem to be discovered and solved without blocking the work of those who were not related to the incident.
As of 2014, the two major version control systems used in the embedded systems industry are the Apache Subversion (SVN) and Git [1, p.82]. Interestingly enough, both tools use different protocols to save and distribute the files between the collaborators. SVN is a Centralized Version Control System (CVCS), where a single server contains the repository, while Git is a Distributed Version Control System (DVCS), where every client mirrors the repository [41, p.31].
Git is an open-source project originally developed in 2005 by the Linux Development community to develop their own VCS in order to maintain the Linux kernel. Eclipse comes already with the Egit plug-in pre-installed, which provides a fairly-complete interface to Git Operations, enabling the user to create repositories and commit changes without using the command-line.
SVN was designed with the objective of correcting the flaws of the Concurrent Version System (CVS), an earlier tool for CVCS type of systems [42, p.XIII]. SVN integration is achieved using the Subversive plug-in for Eclipse, enabling the developers to use it
22 Eclipse IDE
directly from the workbench. An additional download must be done to get the SVN connectors, SVN libraries used by Subversive to communicate with SVN repositories, which are distributed externally and by different providers due to differences in their software licenses.
4.3.3 Serial Console
To implement a fully working serial console inside the IDE, the TM terminal plug-in was selected. When setting up the application, the developer can quickly select the baud rate, the number of bits per frame and other parameters associated with the communication protocol.
Besides acting as a serial console connected to the hardware platform, it can also work as a virtual console accepting commands from the underlying Operating System. Other additional features include support for SSH and Telnet protocols [43].
4.4
Transition to Code Composer Studio
Unfortunately, no open-source or at least free plug-in that could verify the compliance with the MISRA-C standard is available. The solution found to this problem was to use the Texas Instruments (TI) Code Composer Studio proprietary compiler, which has a MISRA-C compliance checker built in.
This led to the decision of using the Code Composer Studio (an Eclipse based environ-ment) instead of a native Eclipse environment as the base IDE to which the rest of the plug-ins would be installed. Decision which did not changed in any order the objectives that were proposed on section 1.2.
From this decision also came the added benefit of inheriting the functionalities added by the TI tool chain described on section 2.3.1, a boon to the developers that were interest in maximizing the performance of their applications or alternatively, minimizing the power consumption on their MSP430 applications. Access to the Code Composer App Center is also possible with this move.
4.4.1 Configuration of the MISRA-C compliance checker
In order to use the compliance checker with projects not concerned with the MSP430 family of micro controllers, two conditions had to be met. To be able to mask the non-compliant standard libraries of some compilers and to be able to call the compiler just to take advantage of the compliance checker and not to compile the source code.
The first condition is all about hiding the standard libraries provided with the micro controller compiler from being verified, since if those libraries are non-compliant, they will only clutter the output with warnings about code the developer is not not capable of modifying. This is achieved using pragma directives, a method specified by the C standard
4.4 Transition to Code Composer Studio 23
for providing additional information to the compiler. A generic example is shown on listing 4.1.
Code 4.1Masking libraries with pragma directives
#if __GNUC__ /* Replace with your compiler identifier here */
#include <headerfiles.h>
#include "yourheaderfiles.h"
#else
/* This setup was designed to use the TICL430 MISRA-C functionality. */
#pragma CHECK_MISRA("none")
#define __PREPROCESSOR_VARIABLES__
#include <headerfiles.h>
#pragma RESET_MISRA("all")
#include "yourheaderfiles.h"
#endif
The second condition is achieved by calling the compiler as an External Tool on Eclipse, or implementing a plug-in with that functionality, indicating the directory of the standard libraries and files to be verified.
Unfortunately, even with this procedure, the interrupt declarations are still prone to appear as errors mixed with the compliance analysis. Methods to improve this situation, if possible, are yet to be found and constitute an obvious area for further research.
Chapter 5
Embedded System Debugger
With the increasing complexity of modern embedded systems and the consequent deeper integration of hardware and software, the ability to debug applications on embedded sys-tems is a very critical stage of the development cycle. As previously mentioned, testing and debugging can take up to 20% of development time [2, p.20], so it is in the developer best interest to accomplish this task as efficiently as possible.
This entire chapter is dedicated to develop the concepts associated with the act of debugging.
First a general overview of what is Source Level Debugging is given, before proceeding to explain some concepts related to the GNU Project Debugger (GDB).
The next sections are dedicated to the characteristics that are unique to the world of embedded systems. It starts by discussing the two approaches for Embedded Systems debugging used currently and then the focus is shifted towards the hardware interfaces to enable the communication between the debugger (typically a standard pc) and the debugee (the embedded system): the JTAG interface and the Atmel’s proprietary interface, Debugwire, used with low pin-count devices
5.1
Source Level Debugging
One of the most important things a developer needs during a debugging session is the context about the program being debugged. When a bug happens, the user wants the debugger to show the line in the source code where the fault happened as clearly as possible. But the code that is actually being run by the micro controller is the source code translated to machine code. So the debugger needs to give the illusion that the source code is being directly executed by the underlying embedded system [44, p.12]. That is the concept of source level debugging.
To achieve this, the compiler is instructed to produce extra information about how the source code is mapped into the machine code.
26 Embedded System Debugger
This way of working creates a problem due to compiler optimization, since the compiler will modify the source code to maximize the performance of the resulting machine code, which is specially helpful on systems with limited resources such as small embedded sys-tems. As such, inconsistencies between the original source code and what was translated to machine code may arise.
One possible approach is to simply turn off any optimization during debugging and then deliver the final product optimized, with the belief that if the unoptimized version of the program executes correctly then the optimized will also execute correctly.
However, differences in behavior between unoptimized and optimized program version can be caused by either the application of an unsafe optimization, an error in the optimizer, or an error in the source code that is exposed by the optimization [45, p.1]. So this approach is not always ideal, like when dealing with safety-critical systems.
Other approaches are also possible but are out of the scope of this work [45, ch.02]. Whichever approach is used and in spite of how much can be gained with source level debugging, which is the most effective and frequently used technique for debugging, it is also important that this type of debugger provide an optional access to low-level information, for instance, disassembly views, direct access to hardware registers and memory contents.
5.2
Debugging using GDB
GDB is a portable source level debugger initially written in 1986 that runs on Unix-like native or emulated systems. Microsoft Windows and Linux Operating System fall under this case. It provides a text-based interface to which the user can directly interact, but there are also graphical front ends. The Eclipse IDE C/C++ Development Tooling (CDT) plug-in is one of those cases [46, p.9], invoking GDB unbeknownst to the developer.
5.2.1 Technical Overview
The GDB structure can be divided in two independent parts as shown on figure 5.1, the “symbol” side and the “target” side. They are independent because it is possible to verify the content of the program without running it - the “symbol” side - or debugging it using anything but pure machine code - the “target” side. Nonetheless, the ideal use case is when both are used together.
The “symbol” side is essentially concerned with extracting and displaying the symbolic information of the program. This information includes variable names and types, line numbers and registers used. This is the part of the debugger that is tasked to create the illusion to the user that the source code is actually being run on the embedded processor. The extraction starts with the Binary File Descriptor (BFD) library, which is used to handle binary and object files. It can handle about fifty different formats, such as those shown on figure 5.1: a.out, COFF and elf, where the last one is commonly used by most embedded systems.
5.2 Debugging using GDB 27
Figure 5.1: Overall Structure of GDB [47, ch.04]
So, porting the BFD is the first key step on tackling a new target architecture, a very important feature for the developers of embedded systems.
The information extracted is then grouped in symbol tables, that sometimes grow up to occupy multiple gigabytes of RAM. Indeed, each local variable, each named type, each value of an enumeration, is a separate symbol. Even though this case won’t happen frequently with small systems, GDB also employs partial symbol tables, allowing it to start up in only a few seconds, even for large programs. This is achieved by selecting which symbols to load, looking for just the globally visible symbols to record them in the symbol table. Complete symbolic info for a function is only filled if the user stops inside the function. Bit fields and structures can also be used to reduce the size of the symbolic table.
The “target” side is concerned with the control of the target system. It starts and stops the program, catches signals and manages registers. The method that it chooses to apply this control depends on the system. For Unix-like systems, it uses a special call named ptrace to read and write the state of the process.
But for cross-debugging an embedded system the target side constructs message packets to send over the physical connection between both, and waits for response packets in return. To handle the intrinsic structure of every target system, there is a need to endue the debugger with enough flexibility to handle each one of them. This is accomplished with target vectors where each target vector is implemented as a structure of several dozen function pointers, whose purposes range from the reading/writing of memory and registers, to resuming program execution, to setting parameters for the handling of shared libraries.
28 Embedded System Debugger
The potential of this method can be enlarged by mixing methods from several target vectors. So before a program starts to run, GDB uses the target vector for executables and reads from the binary file. But while the program is running, the bytes should instead come from the process’s address space, using the target vector for live processes, named Target Stack.
But in order to reach this flexibility the debugger needs to have an in-dept knowledge of the system, defined as gdbarch objects, which details each target architecture.
5.2.2 Interfaces for GDB
GDB, when used as a standalone environment, offers two text-based user interfaces: the traditional command-line interface (CLI) or a more expanded text user interface (TUI), with separate zones to display the source code, register values, and so on [48, p.3], as seen on figure 5.2
Figure 5.2: Text User Interface of a simple adder
An alternative "user" interface, known as the Machine Interface or MI for short, is also provided. It still is fundamentally a command-line interface, but both commands and results have additional syntax to format them to recognizable data. This is the way that the GDB is integrated into Eclipse, for example [47, ch.02].
Other alternative is possible, with GDB implementing a structure similar to a backend of a graphical interface program, translating mouse clicks into commands and formatting print results into windows.
5.2.3 Standalone debugging of embedded systems
As mentioned on section 5.1, the first step that needs to be taken is to inform the compiler to map the source code to machine code. This is done by passing some arguments when
5.2 Debugging using GDB 29
the compiler is executed.
On a native computer application, the next step would be to invoke the debugger. However with embedded systems applications, a remote server is first used to connect the system with the debugger. GDB offers a remote mode designed to debug programs running on a machine that cannot run GDB on the usual way [49, p.203]. This is the case with the embedded systems studied here with the exception of Microchip PIC family of micro controllers.
Using as an example a MSP430 micro controller as the debuggee, a remote server over IP will be initiated, listening to port 55000. The debugger can then connect itself and load the program to be debugged, or attach itself to the program being currently run by the micro controller. The first case is demonstrated in figure 5.3.
Figure 5.3: GDB connected to remote target on port 55000
After this, the user can issue several commands to control and inspect the state of the application. The usual first step is to set breakpoints around the zone where the user suspects the fault will happen. To do so, the user issues the break command whose argument specifies a location, which can be a function name, a source line number, or even a machine address. GDB assigns a small positive integer to the breakpoint object, which the user subsequently uses to operate on the breakpoint.
However the number of breakpoints that can be set is finite, specially on flash based embedded systems. This issue is exacerbated by the fact that breakpoints share the same structure with other similar functions, such as watchpoints [47, ch.02], which breaks when data is accessed rather than when some instruction is executed.
Typically, the following step is to run the application until some event is triggered. The command run or in certain cases continue are used in these cases.
If the event is triggered, the user can then use the debugger to print the variables values, evaluate complex expressions or even analyze the stack. If necessary, the user can utilize this break to have a more granular control of the program execution, with the step into or step over commands. Both make the program run a statement at a time, with the difference being that the step over command skips over functions calls.
When the task to debug the application is completed, the user can quit to end the session. While other commands and functionalities are also available, they are only used on
30 Embedded System Debugger
more complex situations. In fact, more advanced uses of the debugger will depend of not only the interface used to communicate with the embedded system but also the embedded system itself.
5.2.4 Integration into Eclipse
A command-line interface is a serviceable tool for debugging, but for some developers and in the context of this work, integration with the IDE is a desirable feature.
As mentioned before, an interface between Eclipse and GDB can be created thanks to the Machine Interface (MI). Although this interface is to complicated to a normal user, it’s ideal for communication between software processes, which the Eclipse CDT enables by creating a pseudo-terminal (pty) that sends and receives data. It then starts GDB and creates two session objects to manage debug data [50].
So when the user clicks the Debug button, an instance is called to provide the debugger with the launch object containing configuration parameters, the name of the executable to be debugged, and a progress monitor.
It then creates two session objects to manage the rest of the process. MISession and Session. The first manages communication with the GDB while the second one connects the GDB session to the CDT debugging framework.
All of this work is essentially transparent to the user, since he will only have contact with the Eclipse’s debug perspective. Many of the views — Breakpoints, Modules, and Expressions — are provided by Eclipse, but CDT adds three views to the perspective: Executables View, Disassembly View, and Signals [50].
If the debugger isn’t already integrated on the IDE, it still can be called using Eclipse Debug Configurations... tool. If the target to be debugged is an embedded system, the GDB Hardware Debugging launch configuration is the one used, since it enables the user to connect to the target remotely. Similarly, the GDB server can be configured and launched as an external tool, if necessary.
When the debug session is launched the IDE will swap it’s current perspective by the debug perspective, if necessary. This perspective can be seen on figure 5.4. There, the user can use various functionalities that reduce the complexity and time of the debugging session described on the following paragraphs.
A more detailed view over the source code is available, with the statement where the debugger stopped highlighted. Hovering the mouse over a variable will show their current value, as long the variable as been previously initiated.
Since viewing the source isn’t enough in some more complex cases, a disassembly view can also be used in parallel with the source code to inspect the execution in more de-tail. This situation is is exemplified on figure 5.4, with the next step on the code being highlighted.
Generic breakpoints can be placed on the left side of the source code view, seen on figure 5.4 as blue circles on lines 8 and 10, marking the location where the user wishes
5.3 Approaches for Embedded Systems Debugging 31
Figure 5.4: A debug session on Eclipse
the program to stop. Right-clicking enables/disables them and sets conditions that must be fulfilled before the breakpoint can fire. Alternatively, a specific view to set breakpoints and edit them is also available.
Commands to stop, start and resume are easily available on a toolbar and can be even more quickly accessed with key shortcuts. If that is not enough, the user can also control the debugger with the Eclipse built-in console, having access to all of its commands through there.
5.3
Approaches for Embedded Systems Debugging
Due to the inherent difficulty in debugging embedded systems, various types of probes were engineered to increase the amount of information a debugger can collect without interfering on the system’s behavior.
Two implementations rose over the others, and are the most frequently used today: In-circuit Emulators and On-chip Debuggers.
5.3.1 In-Circuit Emulator
An In-circuit Emulator (ICE) is a tool that allows the replacement of the embedded pro-cessor by emulating it inside the probe. This emulator can monitor everything that goes
32 Embedded System Debugger
on in the on-board CPU, giving complete visibility into the target code’s operation [51]. The first models were were quite cumbersome, requiring the developers to replace the processor temporarily with a hardware emulator - a more powerful although more expensive version. Nowadays, modern emulators use the target system’s processor directly, accessed through a JTAG connection [52].
This grants the developer the ability to examine and change the contents of registers, memory, and I/O. Placing breakpoints in the source code is also possible. These break-points can be of two different types: Software Breakbreak-points or Hardware Breakbreak-points.
While Software Breakpoints work by replacing the destination instruction by a software interrupt, or trap, or instruction, Hardware Breakpoints act as comparators, comparing the program counter with the specified address that is stored on some special debugging registers. This utility is highly dependent on the micro controller since it requires physical components, they are extremely limited in number.
Whenever possible, its preferable to set Hardware Breakpoints, since they can be set on both volatile and non volatile memory. Software Breakpoints, on the other hand, can only be easily set in RAM memory.
Real-time trace is another functionality that the ICE provides. It captures a snapshot of the executing code to a buffer, at full speed, saving thousands of machine cycles, displaying the addresses, the instructions, and transferred data, which can be translated to assist the developer [51].
And since this tools doesn’t use any resource from the embedded system under test, it becomes a critical tool when a real-time application needs to be tested.
5.3.2 On-Chip Debugger
While the previously mentioned In-Circuit Emulator services a wide range of debugging opportunities, it can be in some cases too expensive to develop and more difficult to use. So in order to find a different method to debug embedded systems, many semiconductor vendors started to integrate dedicated debug circuitry into their chips [53]. Most of the times, it consist of adding software debug capabilities to the existing JTAG ports.
This way, it is possible to monitor and control the execution of the program inside the embedded system. Like the ICE, the On-Chip Debugger (OCD) is capable of using Software Breakpoints as well as Hardware Breakpoints to modulate the run time of the program. Again, Hardware Breakpoints are limited.
Likewise, real-time trace is technically possible to implement using the OCD, since on-chip debug agents may reside inside cache and memory management units, granting them the capability to see addresses and data values just like the CPU sees them.
![Figure 1.1: Project completion ratios [2, p.23]](https://thumb-eu.123doks.com/thumbv2/123dok_br/15860398.1086771/17.892.149.594.642.1034/figure-project-completion-ratios-p.webp)
![Figure 2.1: Atmel Studio 7 Integrated Development Platform Composition [6]](https://thumb-eu.123doks.com/thumbv2/123dok_br/15860398.1086771/22.892.284.574.387.529/figure-atmel-studio-integrated-development-platform-composition.webp)
![Figure 2.2: Optimization Levels of different versions of the compiler [14]](https://thumb-eu.123doks.com/thumbv2/123dok_br/15860398.1086771/24.892.270.580.559.750/figure-optimization-levels-different-versions-compiler.webp)
![Figure 2.4: Fundamental Components of the MDK core [30, p.7]](https://thumb-eu.123doks.com/thumbv2/123dok_br/15860398.1086771/29.892.254.675.466.544/figure-fundamental-components-mdk-core-p.webp)
![Figure 4.1: Simplified view of Eclipse subsystems [35]](https://thumb-eu.123doks.com/thumbv2/123dok_br/15860398.1086771/34.892.233.649.561.929/figure-simplified-view-of-eclipse-subsystems.webp)
![Figure 4.2: Relationship between Eclox and Doxygen [40]](https://thumb-eu.123doks.com/thumbv2/123dok_br/15860398.1086771/37.892.261.678.261.430/figure-relationship-between-eclox-and-doxygen.webp)
