TÍTULO
Nome completo do Candidato
Subtítulo
Dissertação / Trabalho de Projeto / Relatório de
Estágio apresentada(o) como requisito parcial para
obtenção do grau de Mestre em Estatística e Gestão
de Informação
Differences in ERP use and value across Iberian
Manufacturing and Services SMEs
Dissertação apresentada como requisito parcial para
obtenção do grau de Mestre em Gestão de Informação
Instituto Superior de Estatística e Gestão de Informação Universidade Nova de Lisboa
DIFFERENCES IN ERP USE AND VALUE ACROSS IBERIAN
MANUFACTURING AND SERVICES SMES
por
Jorge Miguel da Silveira Rebelo
Dissertação apresentada como requisito parcial para a obtenção do grau de Mestre em Gestão de Informação, Especialização em Gestão de Sistemas e Tecnologias de Informações
Dissertação Orientada por, Mestre Pedro Miguel Fernandes Ruivo
Professor Doutor Tiago André Gonçalves Félix de Oliveira
ACKNOWLEDGEMENTS
I would like to acknowledge the precious guidance from Dr. Pedro Ruivo and Dr. Tiago Oliveira, for their tremendous teaching skills that were always a source of motivation. Both have shown an un-ending availability and an experience, providing a crucial guidance and an excellency standard that motivated me throughout this dissertation.
I would like to thank ISEGI and all my Master course professors for giving me the tools to turn information into knowledge.
I would like to thank my family and friends who somehow helped me during the thesis-writing period.
I would like to thank my better half Vera, the most incredible woman, who allowed me to accomplish my goal, with an endless patient and support.
RESUMO
A literatura sobre os Sistemas Integrados de Gestão Empresarial (ERP) reporta muito poucos estudos sobre os estádios de pós-adoção, ou seja, o uso efetivo e o valor. Ainda menos estudos se focam nas especificidades de uma análise por sector de atividade. Com base no Contexto de Inovação Tecnológica (TOE framework) e na teoria da Visão Baseada em Recursos (RBV theory), desenvolvemos um modelo de investigação para medir e examinar os determinantes do uso e valor dos ERP e o seu impacto na região Ibérica (Portugal e Espanha), em empresas de Serviços e Indústria de Pequena e Média dimensão (SMEs). O teste empírico foi conduzido através da modelação de equações estruturais, com recurso a dados de 261 empresas na Península dos sectores de Serviços e Indústria. Os resultados mostram que entre os determinantes do uso de ERP, o Treino é o mais importante para os Serviços, enquanto a Compatibilidade é mais importante para a Indústria. O Tamanho da Empresa, as Capacidades Analíticas e a Colaboração contribuem para o valor dos sistemas ERP em ambos os sectores, com a Capacidade Analítica a ser mais importante para os Serviços. Este estudo permite conhecer quais os determinantes mais importantes para o uso e valor dos sistemas ERP nas Pequenas e Médias Empresas Ibéricas de Serviços e Indústria, oferecendo implicações académicas e de gestão.
PALAVRAS-CHAVE
Sistemas Integrados de Gestão Empresarial, uso do ERP, valor do ERP, Indústria,
Serviços, Pequenas e Médias Empresas, Contexto de Inovação Tecnológica, Visão Baseada em
ABSTRACT
Enterprise Resource Planning (ERP) system literature reports very little research on post-adoption stages, that is, actual usage and value. Even fewer studies focus on the specificities of an industry analysis. Based on the Technology-Organizational-Environment (TOE) framework and the Resource-Based View (RBV) theory, we develop a research model to measure and examine determinants of ERP use and value and their impact in the Iberian region (Portugal and Spain) across Manufacturing and Services industries in Small and Medium Enterprises (SMEs). The empirical test was conducted through structural equation modelling, using data from 261 firms in the peninsula in the Manufacturing and Service industries. Results show that amongst ERP use determinants, Training is the most important determinant for Service firms and Compatibility for Manufacturing firms. Firm size, Analytics, and Collaboration contribute to ERP Value in both industries, with Analytics being more important for the Service industry. The paper provides insight into which determinants contribute to ERP use and ERP value in Iberian Manufacturing and Services SMEs, offering managerial and academic implications.
KEYWORDS
Enterprise Resource Planning (ERP), ERP use, ERP value, Manufacturing, Services, SMEs,
PUBLICATIONS
Publications resulting from this dissertation:
ISI proceedings:
Rebelo, J., Ruivo, P., & Oliveira, T. (2013). ERP use in the Manufacturing Sector. The case of Iberian SME. Proceeding of the8th Iberian Conference on Information Systems and
Technologies (CISTI), Lisboa, Portugal, 1, 126-131. (Appendix B)
Paper:
INDEX
1. INtroDUCTION ... 1
2. THEORETICAL PERSPECTIVES ... 3
2.1.ERP adoption in Manufacturing and Services firms ... 3
2.2.ERP use and the TOE framework ... 4
2.3.ERP value and RBV theory ... 4
3. RESEARCH MODEL AND HYPOTHESES ... 6
3.1.The research model ... 6
3.2.Hypotheses to explain ERP use ... 7
3.3.Hypotheses to explain ERP value ... 9
4. MetHOD ... 11
4.1.Measurement ... 11
4.2.Participants and Data Collection ... 12
5. Results ... 13
5.1.Measurement Model ... 13
5.2.Structural model ... 15
6. Discussion ... 19
7. Conclusion ... 24
8. Limitations and future work ... 25
9. BibliograPHY ... 26
APPENDIX A - MEASUREMENT ITEMS ... 31
LIST OF FIGURES
Figure 1 – The research model ... 6 Figure 2 - Conceptual model testing (Manufacturing subsample N=158; Services
LIST OF TABLES
Table 1 -Sample Characteristics ... 12 Table 2 - Correlation Matrix, Composite Reliability (CR), and square root of AVE ... 13 Table 3 - Loadings and cross-loadings for the measurement model ... 15 Table 4 - Results of manufacturing and services subsamples and t-tests for the
ABBREVIATIONS
ERP Enterprise Resource Planning
TOE Technological-Organizational-Environmental framework
RBV Resource-Based View theory
SME Small and Medium Sized Enterprise
IS Information Systems
IT Information Technology
CEO Chief Executive Officer
CFO Chief Financial Officer
SEM Structured Equation Modeling
PLS Partial Least Square
AVE Average Variance Expected
1.
INTRODUCTION
Enterprise Resource Planning (ERP) systems have been applied by many firms around the world as a key part of the organizational infrastructure. ERP encompasses a wide range of software products supporting day-to-day business operations and decision-making (Singla, 2008). ERP systems are expected to provide seamless integration of processes across functional areas with improved workflow, standardization of various business practices, improved order management, accurate accounting of inventory, and better supply chain management (Aier, Bucher, & Winter, 2011; Mabert, Soni, & Venkataramanan, 2003). The ERPs are particularly important for manufacturing and services in Small and Medium Enterprises (SMEs) (Botta-Genoulaz & Millet, 2006; Raymond & Uwizeyemungu, 2007).
The current process of structural change in Europe is one in which the share of manufacturing in the economy is declining while services are accounting for increasing shares of employment and value added (Castaldi, 2009). The manufacturing and service industries are still the two main economic activities in the European Union (Johansson, 2008; Schmiemann, 2008). Several authors (Ramdani, Kawalek, & Lorenzo, 2009; Ruivo, Oliveira, & Neto, 2012; Taylor & Murphy, 2004) state that SMEs are the
backbone of Europe’s economy, important for increasing productivity and gaining
competitive advantage in the global economy, as well important drivers of innovation and transformation. Literature reveals that little attention has been given to research on ERP in SMEs, and even less on specific industries such as manufacturing and services (Haddara & Zach, 2011). To fill the gap, this paper addresses the following research question in the SME context: What are the drivers and differences in ERP use and value between manufacturing and services industries?
2.
THEORETICAL PERSPECTIVES
2.1.ERP ADOPTION IN MANUFACTURING AND SERVICES FIRMS
While ERP systems have traditionally been used by capital-intensive industries such as manufacturing, they have recently been implemented in the service industry (Botta-Genoulaz & Millet, 2006). As far as ERP is concerned, service organizations were not initially targeted by many ERP vendors, which instead developed products for manufacturing companies (Botta-Genoulaz & Millet, 2006). However, ERP systems are increasingly being implemented in the service industry (Empson, 2001).
It has been argued that the industry in which the firm operates influences the adoption of Information System (IS) innovations (Levenburg, Magal, & Kosalge, 2006). Recent findings reveal that in the European context the most important feature to characterize Information Technology (IT) adoption is the industry and its specific characteristics rather than the country the firms belong to (Oliveira & Martins, 2010a).
2.2. ERP USE AND THE TOE FRAMEWORK
One of the most important adoption models at the firm level is the TOE framework (Oliveira & Martins, 2011; Tornatzky & Fleischer, 1990). This framework will be used to explain ERP use, since it is a well-established one that encompasses various contexts with which IT adoption can be assessed, and it has been examined in a number of studies on various IS domains (Raymond, Uwizeyemungu, Bergeron, & Gauvin, 2012; Zhu & Kraemer, 2005). The TOE framework identifies three aspects of a
firm’s context that influence the process by which it adopts, implement, and uses technological innovation: (a) Technological context – which describes both the internal and external technologies relevant to the firm; (b) Organizational context – which refers to descriptive measures about the firm; and (c) Environmental context – which refers to the arena in which a firm conducts its business (Tornatzky & Fleischer, 1990).
2.3. ERP VALUE AND RBV THEORY
The RBV theory remains the dominant theoretical explanation of IT business value, as IS researchers have employed the resource perspective to expand and deepen our understanding of IT business value (Bharadwaj, 2000; Clemons & Row, 1991; Schmidt, Erek, Kolbe, & Zarnekow, 2009). The RBV theory sustains that a firm creates value by combining heterogeneous resources that are economically valuable, difficult to imitate, or imperfectly mobile across firms (Barney, 1991; M. Peteraf, 1993). In the IS literature the RBV has been used to analyse how IT business value can be explained by IT capability as a resource (Ross, Beath, & Goodhue, 1996; Zhu & Kraemer, 2005). Thus, an ERP system business value depends on the extent to which ERP systems are
3.
RESEARCH MODEL AND HYPOTHESES
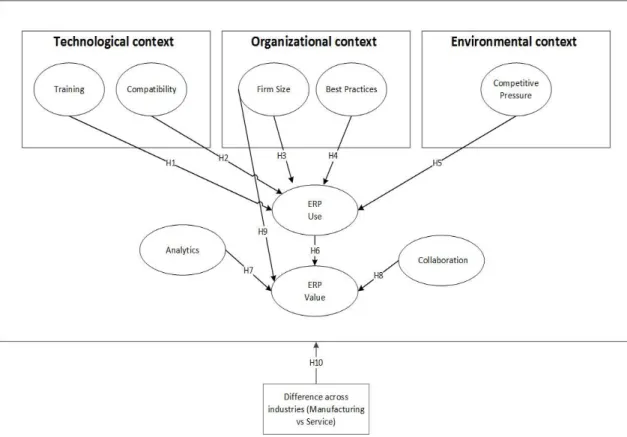
3.1.THE RESEARCH MODEL
The extent of ERP use by an organization will be influenced by its technological, organizational, and environmental contexts within the TOE framework (Zhu & Kraemer, 2005). The determinants of ERP use are: Training, Compatibility, Firm Size, Best Practices, and Competitive Pressure. The RBV theory is used to understand ERP value. RBV suggests that the greater the extent of IT use, the greater the likelihood that organizations will create IT capabilities that are rare, inimitable, valuable, and sustainable. Also, ERP helps companies to develop appropriate functionalities to leverage business performance, thereby contributing to value creation. It is hypothesized that an ERP value is explained by four determinants: ERP use, Collaboration, Analytics, and Firm Size. A conceptual model was developed to assess the use and value of ERP systems (Figure 1).
3.2.HYPOTHESES TO EXPLAIN ERP USE
Technology Context
According to Tornatzky and Fleischer (1990) a firm with higher quality human resources, such as better education or training, will have greater ability in technological innovation. Literature shows that training is an important factor for IT implementation success (Gupta, 2000), and furthermore for successfully adopting, using, and benefiting from ERP systems (Bradford & Florin, 2003; Maguire, Ojiako, & Said, 2010; O'Leary, 2000). We therefore postulate that training increases the ability to use an information system application.
H1. The level of a firm’s training programme will have a positive relationship with
ERP use.
On the technical side of IT, one of the primary reasons for the inability of many firms to realize the full potential offered by IT is the incompatibility amongst the various computer hardware and software systems (Rajagopal, 2002). Compatibility has been shown to be an important factor in explaining innovation use by organizations, and high compatibility has been identified as a facilitator for innovation utilization (Cooper & Zmud, 1990; Zhu et al., 2004). The findings of Bradford and Florin (2003), and Elbertsen and Benders (2006) indicate that the degree of compatibility of ERP systems with existing IT infrastructure has a positive relationship with successful adoption and use.
H2. Firms having ERP systems with greater compatibility are more likely to use ERP.
adoption (Thiesse, Staake, Schmitt, & Fleisch, 2011). Since our study focuses on SMEs, we postulate that smaller firms are characterized by a resource poverty resulting from various severe constraints, which is a barrier for ERP use.
H3. Larger firms tend to achieve a greater extent of ERP use.
From the business process reengineering perspective, there are two ERP
implementation options: modify (customize) the ERP package to suit the firm’s
requirements (with high costs), or implement an ERP package with minimum deviation from the standard settings (with lower costs) (Davenport, 1998; Ruivo et al., 2012). Standard packages can increase development speed, reduce development staff requirements, and offer a constant state-of-the-art IT capability through upgrades (Light, Holland, & Wills, 2001). Thus, the business processes implied in the ERP system are understood to represent “best practices” and a more competitive business model (Light et al., 2001). Literature shows that firms that implement industry best-practices dramatically reduce risk and time-consuming project tasks such as configuration, documentation, and testing (Maguire et al., 2010; Ruivo et al., 2012).
H4. Firms with a greater degree of business process fit to standard ERP “best
-practices” are more likely to use ERP.
Environment Context
Competitive pressure refers to the degree of pressure from competitors, which is an external power pressing a firm to adopt new technology in order to avoid competitive decline (Zhu et al., 2004). It has long been recognized as a driving force for new technology use, as it tends to press companies to seek competitive edge by adopting new practices (Gatignon & Robertson, 1989). Several studies have determined Competitive Pressure to be an IT adoption and use driver (Oliveira & Martins, 2011; Zhu & Kraemer, 2005; Zhu, Xu, & Dedrick, 2003).
3.3.HYPOTHESES TO EXPLAIN ERP VALUE
Based on the strategic management literature, the RBV of the firm posits that firms create value by combining heterogeneous resources that are economically valuable (Barney, 1991; Schoemaker & Amit, 1994), difficult to imitate (Barney, 1991; Peteraf, 2006), rare (Barney, 1991), and non-substitutable (Barney, 1991). IT business
value depends on the extent to which IT is used in the key activities in the firm’s value
chain. The greater the use, the more likely the firm is to develop unique capabilities from its core IT infrastructure (Zhu et al., 2004). System use is essential for ERP to generate any impact on firm performance, and a strong link can therefore be established between system use and system impact (DeLone & McLean, 1992; Devaraj & Kohli, 2003; Zhu & Kraemer, 2005).
H6. Firms with greater ERP use are more likely to generate higher ERP value
A number of case studies describe business analytics applications and discuss how they might contribute to firm performance (Davenport & Harris, 2007; Piccoli & Watson, 2008). Business analytics systems can potentially contribute to firm performance and create competitive advantage (Davenport & Harris, 2007). According to Bendoly (2003), the adoption of ERP systems has been accompanied by a veritable explosion of readily available transactional data. Those firms that have embedded analytics capabilities into ERP database can easily and quickly use data for managerial decision-making and consequently acquire an advantage in attaining sustainable business performance (Lucas, Babaian, & Topi, 2008; Ruivo & Neto, 2011).
H7. Firms with greater levels of analytical information extracted from ERP are positively associated with higher ERP value.
lines is important for ERP implementation’s success, in the same way that ERP implementation changes the organizational culture promoting the free-flow of information and sharing of knowledge amongst employees and across department lines. ERP systems help users to collaborate, increasing efficiency and effectiveness (Gattiker & Goodhue, 2005; Leimeister, 2010). Thus, it is plausible that firms with greater collaboration are positively associated with higher ERP value
H8. Firms’ greater collaboration in ERP systems is positively associated with
higher ERP value.
The literature reveals no consensus on the role of firm size in the process of innovation implementation. Larger firms often possess more resources that can facilitate innovation implementation (Thiesse et al., 2011). Smaller firms, although more versatile, are characterized by severe resource constraints and do not readily adopt new technologies (Lippert & Govindarajulu, 2006). Therefore, we postulate that the available resources and the financial capital which larger firms may possess will have a positive impact on the adoption and use of ERP, and as a result, on value creation.
H9. Firm size is positively associated with ERP value.
Sohal et al. (2001) report that manufacturing and service firms are achieving few benefits from their IT investments. The major benefits achieved across both industries have been limited to improvement in productivity and cost reductions. The structure of services are inherently different from manufacturing, and given the distinct nature of the offerings of manufacturing and services firms, different drivers for ERP use and value across the two industries are very plausible.
4.
METHOD
4.1. MEASUREMENT
The constructs were operationalized on the basis of a literature review (Appendix A). Constructs were measured using a survey instrument. Whereas the ERP use construct was measured by items calling for responses in percentages, all other constructs were measured using a five-point Likert scale, with the anchors being “low”
and “high”. A survey methodology is proposed for data collection to validate the
4.2. PARTICIPANTS AND DATA COLLECTION
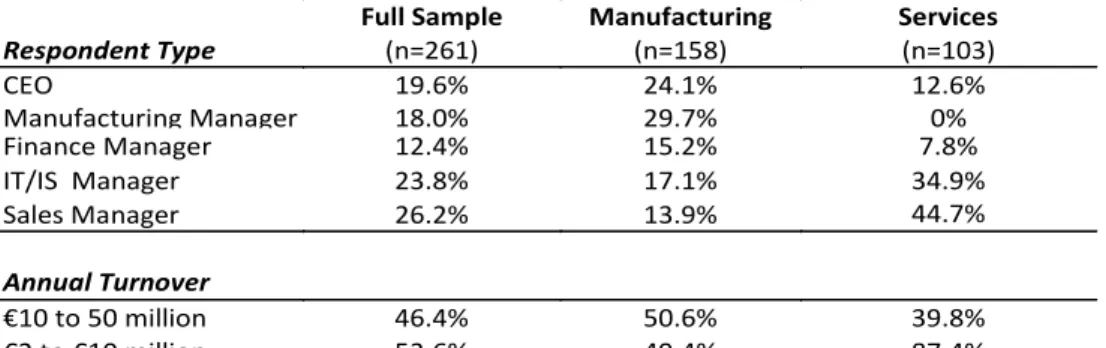
With the assistance of International Data Corporation, data were collected using an online survey over a two-month period (September and October, 2011), resulting in a final sample of 261 companies (158 Manufacturing and 103 Services). The response rate was 39.8%. The respondents were individuals (e.g., Chief Executive Officer (CEO), Chief Financial Officer (CFO), and business managers) who were qualified to speak about the company’s ERP system, which suggests a good quality of the data. The profiles of the respondent and sample are shown in Table 1. The sample covered
varying types of businesses and represented small (€2 to €10 million) and medium
companies (€10 to €50 million), conforming to the European Commission standard for
enterprise classification (Commission, 2005).
Table 1 -Sample Characteristics
Full Sample Manufacturing Services
Respondent Type (n=261) (n=158) (n=103)
CEO 19.6% 24.1% 12.6%
Manufacturing Manager 18.0% 29.7% 0%
Finance Manager 12.4% 15.2% 7.8%
IT/IS Manager 23.8% 17.1% 34.9%
Sales Manager 26.2% 13.9% 44.7%
Annual Turnover
€10 to 50 million 46.4% 50.6% 39.8%
€2 to €10 million 53.6% 49.4% 87.4%
5.
RESULTS
Structured Equation Modeling (SEM) was used to empirically assess the research model (Figure 1). The Kolmogorov-Smirnov test was performed, confirming that none of the items measured are distributed normally (p<0.001). This allows for safe use of Partial Least Square (PLS) for the analysis, at this does not require a normal distribution (Chin, Marcolin, & Newsted, 2003). PLS estimation requires, for reflective constructs, ten times the largest number of structural paths directed at a particular construct in the model (Chin, 1998). The sample in our study met the necessary conditions for using PLS. The specific tool used was SmartPLS 2.0 (Ringle, Wende, & Will, 2005). First, we examined the measurement model to assess reliability and validity before testing the structural model.
5.1.MEASUREMENT MODEL
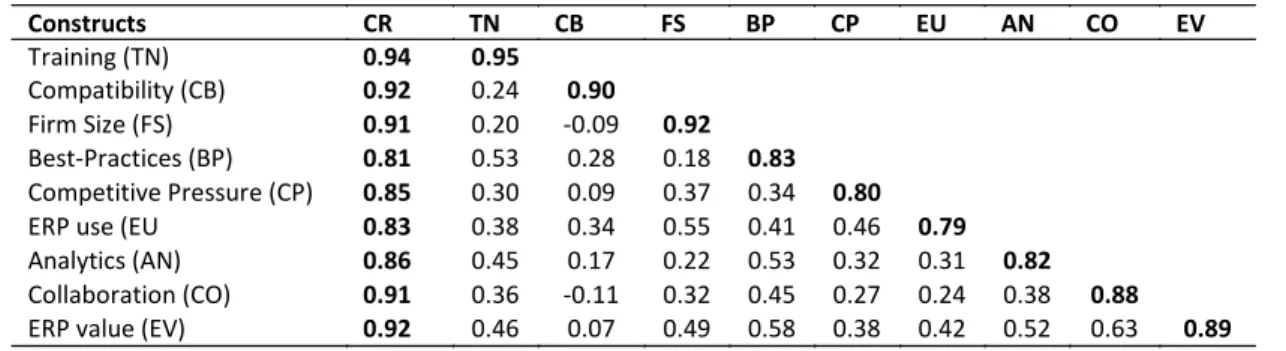
The results of the measurement model (construct reliability, indicator reliability, convergent validity, and discriminant validity) for full sample are reported in Tables 2 and 3. We also compute these tables for each industry (available from author on request) and the results are similar. The construct reliability was tested using the composite reliability coefficient. PLS prioritizes indicators according to their individual reliability. As shown in Table 2, all the constructs have a composite reliability greater than 0.7, which suggests that the constructs are reliable (Straub, 1989).
Table 2 - Correlation Matrix, Composite Reliability (CR), and square root of AVE
Constructs CR TN CB FS BP CP EU AN CO EV
Training (TN) 0.94 0.95
Compatibility (CB) 0.92 0.24 0.90
Firm Size (FS) 0.91 0.20 -0.09 0.92
Best-Practices (BP) 0.81 0.53 0.28 0.18 0.83 Competitive Pressure (CP) 0.85 0.30 0.09 0.37 0.34 0.80
ERP use (EU 0.83 0.38 0.34 0.55 0.41 0.46 0.79
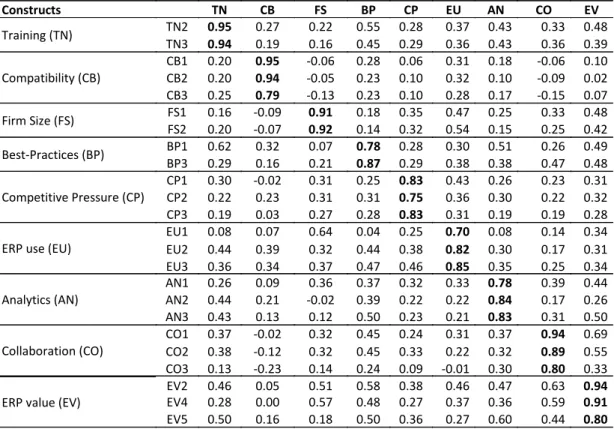
The indicator reliability was evaluated based on the criteria that the loadings should be greater than 0.70, and that every loading less than 0.4 should be eliminated (Churchill, 1979; Henseler, Ringle, & Sinkovics, 2009). As shown in Table 3, the loadings (in bold) are greater than 0.7. Hence,only four items in the table were eliminated (TN1, BP2, EV1, and EV3). All the items are statistically significant at 0.001. Overall, the instrument presents good indicator reliability.
Average Variance Extracted (AVE) was used as the criterion to test convergent validity. The AVE should be higher than 0.5 in order that the latent variable explains more than half of the variance of its indicators (Fornell & Larcker, 1981; Hair, Sarstedt, Ringle, & Mena, 2012; Henseler et al., 2009). As shown in Table 2, all constructs have an AVE higher than 0.5, fulfilling this criterion.
Table 3 - Loadings and cross-loadings for the measurement model
Constructs TN CB FS BP CP EU AN CO EV
Training (TN) TN2 0.95 0.27 0.22 0.55 0.28 0.37 0.43 0.33 0.48 TN3 0.94 0.19 0.16 0.45 0.29 0.36 0.43 0.36 0.39
Compatibility (CB)
CB1 0.20 0.95 -0.06 0.28 0.06 0.31 0.18 -0.06 0.10 CB2 0.20 0.94 -0.05 0.23 0.10 0.32 0.10 -0.09 0.02 CB3 0.25 0.79 -0.13 0.23 0.10 0.28 0.17 -0.15 0.07
Firm Size (FS) FS1 0.16 -0.09 0.91 0.18 0.35 0.47 0.25 0.33 0.48 FS2 0.20 -0.07 0.92 0.14 0.32 0.54 0.15 0.25 0.42
Best-Practices (BP) BP1 0.62 0.32 0.07 0.78 0.28 0.30 0.51 0.26 0.49 BP3 0.29 0.16 0.21 0.87 0.29 0.38 0.38 0.47 0.48
Competitive Pressure (CP)
CP1 0.30 -0.02 0.31 0.25 0.83 0.43 0.26 0.23 0.31 CP2 0.22 0.23 0.31 0.31 0.75 0.36 0.30 0.22 0.32 CP3 0.19 0.03 0.27 0.28 0.83 0.31 0.19 0.19 0.28
ERP use (EU)
EU1 0.08 0.07 0.64 0.04 0.25 0.70 0.08 0.14 0.34 EU2 0.44 0.39 0.32 0.44 0.38 0.82 0.30 0.17 0.31 EU3 0.36 0.34 0.37 0.47 0.46 0.85 0.35 0.25 0.34
Analytics (AN)
AN1 0.26 0.09 0.36 0.37 0.32 0.33 0.78 0.39 0.44 AN2 0.44 0.21 -0.02 0.39 0.22 0.22 0.84 0.17 0.26 AN3 0.43 0.13 0.12 0.50 0.23 0.21 0.83 0.31 0.50
Collaboration (CO)
CO1 0.37 -0.02 0.32 0.45 0.24 0.31 0.37 0.94 0.69 CO2 0.38 -0.12 0.32 0.45 0.33 0.22 0.32 0.89 0.55 CO3 0.13 -0.23 0.14 0.24 0.09 -0.01 0.30 0.80 0.33
ERP value (EV)
EV2 0.46 0.05 0.51 0.58 0.38 0.46 0.47 0.63 0.94 EV4 0.28 0.00 0.57 0.48 0.27 0.37 0.36 0.59 0.91 EV5 0.50 0.16 0.18 0.50 0.36 0.27 0.60 0.44 0.80
The assessment of construct reliability, indicator reliability, convergent validity, and discriminant validity of the constructs are satisfactory, indicating that the constructs can be used to test the conceptual model.
5.2. STRUCTURAL MODEL
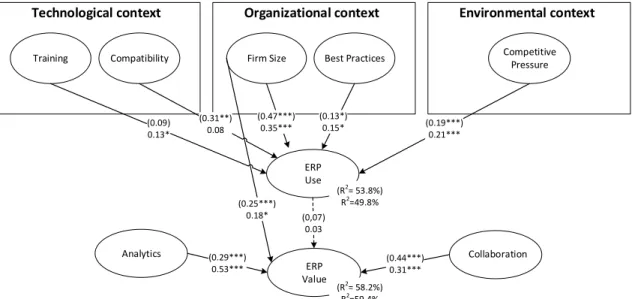
The analysis of hypotheses was based on the examination of the standardized paths. The significance of the path coefficients was assessed by bootstrapping procedure with 500 times resampling (Chin, 1998; Hair, Ringle, & Sarstedt, 2011; Henseler et al., 2009). Figure 2 shows the standardized path coefficients and statistical significance, as well as the R2 values for dependent constructs, for both manufacturing
Technological context Organizational context Environmental context
Training Compatibility Firm Size Best Practices Competitive Pressure
ERP Use
ERP Value
Collaboration Analytics
(0.09) 0.13*
(0.31**) 0.08
(0.13*) 0.15* (0.47***)
0.35*** (0.19***)
0.21***
(0.44***) 0.31*** (0.29***)
0.53***
(0,07) 0.03 (0.25***)
0.18*
(R2= 53.8%)
R2=49.8%
(R2= 58.2%)
R2=59.4%
Notes:Control variables are Country and Industry; Significance at: *p<0.10. **p<0.05. ***p<0.01
Figure 2 - Conceptual model testing (Manufacturing subsample N=158; Services subsample N=103)
The results for the manufacturing industry, in parentheses, are summarized as follows. An examination of R2 as a descriptive measure shows that the research model
The results for the service industry, without parentheses, are summarized as follows. An examination of R2 as a descriptive measure shows that the research model
explains 49.8% of ERP use and 59.4% of ERP value. Within the Technological context, Training (H1) ( p<0.10) has a significant and positive path to ERP use, while Compatibility ( p>0.10) is not statistically significant. Thus, H1 is confirmed, while H2 is not. Within the Organizational context, Firm Size (H3) ( p<0.01) and Best-Practices (H4) ( p<0.10) are both statistically significant in explaining ERP use, and therefore H3 and H4 are confirmed. Within the Environmental context Competitive Pressure (H5) ( p<0.01) is statistically significant and has a positive path to explain ERP use. Thus, H5 is confirmed. Within the RBV theory, the model shows that there is not a statistically significant link from ERP use to ERP value (H6) ( p>0.10), and thus H6 is not confirmed. In turn, Analytics (H7) ( p<0.01), Collaboration (H8) ( p<0.01) ,and Firm Size (H9) ( p<0.10) have positive and statistically significant paths to ERP value. Therefore, H7, H8, and H9 are confirmed.
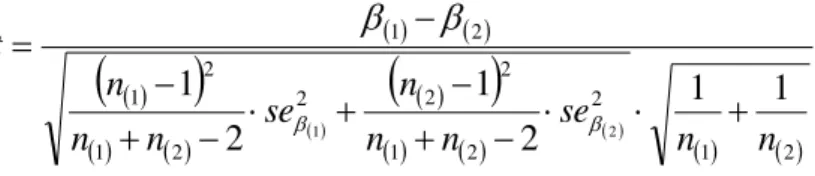
In a deeper analysis, the differences between the statistically significant path coefficients across Manufacturing and Services subsamples were tested, based on Keil
et al.’s (2000) formula:
1 2
2 2 1 2 2 2 2 1 2 1 2 1 1 1 2 1 2 1 2
1 n n se n n
n se n n n t
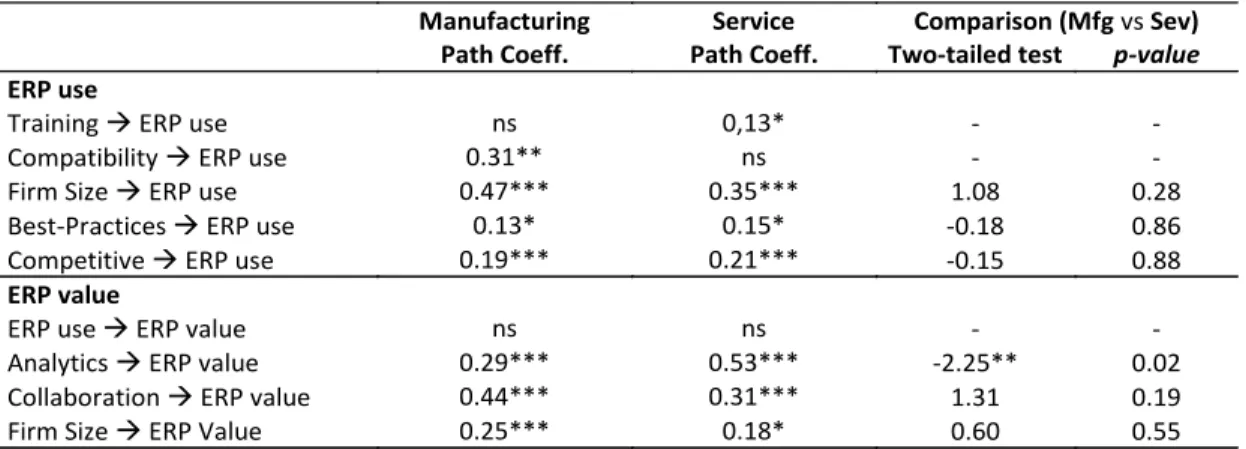
Table 4 - Results of manufacturing and services subsamples and t-tests for the difference in paths between subsamples
Manufacturing Service Comparison (Mfg vs Sev) Path Coeff. Path Coeff. Two-tailed test p-value
ERP use
Training ERP use ns 0,13* - -
Compatibility ERP use 0.31** ns - -
Firm Size ERP use 0.47*** 0.35*** 1.08 0.28
Best-Practices ERP use 0.13* 0.15* -0.18 0.86
Competitive ERP use 0.19*** 0.21*** -0.15 0.88
ERP value
ERP use ERP value ns ns - -
Analytics ERP value 0.29*** 0.53*** -2.25** 0.02
Collaboration ERP value 0.44*** 0.31*** 1.31 0.19
Firm Size ERP Value 0.25*** 0.18* 0.60 0.55
Note:*p<0.10, **p<0.05, ***p<0.01; ns – non-statistically significant results.
6.
DISCUSSION
The results show that Training (H1) is not as important in manufacturing as it is in the services industry. This does not necessarily mean that the manufacturing industry
disregards user training. SMEs’ training is essentially informal and a reactive response
to short-term issues (Jayawarna, Macpherson, & Wilson, 2007) and manufacturing firms are significantly influenced by this preference (Matlay & Hyland, 1997). Thus, the lack of a formal and consistent training programme is a barrier to correctly assessing the contribution of user training to the effective utilization of ERP. Also, the manufacturing industry has been using systems such ERP for a longer period, and usually in more capital and human intensive ways, and also with a pool of experience that is more widely available (Tan, Chong, Lin, & Eze, 2010). As a result, the greater number of expert users and trainers reduces the importance of training. While training might be a commodity for the manufacturing industry, the services SMEs have greater difficulty in hiring qualified IT experts, probably because of their scarcer financial resources. IT skills are thus likely to be rarer in Service firms and to become a source of competitive advantage amongst competing SMEs (Uwizeyemungu & Raymond, 2011). Furthermore, the intangible nature of the output of services gives to both information technologies and to human resources a central role in a firm’s activities. In the service industry, knowledge itself is the product and human capital is the dominant form of capital (Johnson, Baldwin, & Diverty, 1996). Therefore, the important role played by the human factor in the firm and delivery of services is associated with substantial investment in training (Botta-Genoulaz & Millet, 2006).
reliability and effectiveness (Wang, Wang, & Yang, 2010; Zhu et al., 2004). Furthermore, these systems tend to have a long life cycle in organizational use, and their processes have been extended into external organizations across the industry value chain (Shang & Wu, 2004). Because services are simultaneously produced and consumed, there is not the same need for inventories, storage, transportation, and supplying as for manufacturing firms (Frohlich & Westbrook, 2002). So, manufacturing firms not only have to consider their own ERP system, they must face more challenges in terms of IT compatibility and integration alongside a wider network throughout the supply chain.
Firm Size (H3) is a facilitator of ERP use in both industries. Although literature reports Firm Size as a controversial predictor of IT adoption (Oliveira & Martins, 2010b), our study confirms that larger firms have more resources and greater capacity for risking investment in adopting, implanting, and therefore, using ERP (Thiesse et al., 2011), while the smaller firms seem less likely to adopt an IT innovation, as they lack the resources needed for construction of knowledge, implementation, and testing (Thiesse et al., 2011).
Consistent with some studies (Maguire et al., 2010; Ruivo et al., 2012), Best Practices (H4) is a facilitator for ERP use amongst SMEs in both industries. Firms that implement industry best-practices dramatically reduce risk and time-consuming project tasks such as configuration, documentation, testing, and training. ERP best-practices seem to maximize the benefits from the implementation, contributing to ERP use.
Surprisingly, the findings suggest that ERP use is not important to understand ERP value (H6) in either industry. Manufacturing and services firms have been the major targets of ERP vendors, by which it is plausible to assume that through ERP utilization, both sectors have gained a specific resource that guides both internal and external collaboration and provides a data repository to perform business analyses. Therefore, with further utilization, the perception of ERP success use drops, while increasing the necessity of collaboration, to serve new possibilities for using information to improve business processes, and to use operational data to generate reports that support decision-making and resource planning. This finding enhances earlier studies (DeLone & McLean, 1992; Zhu & Kraemer, 2005) to suggest that system utilization should not be studied in isolation. More precisely, our study shows that when system use is positioned together with other organizational system factors, it does not influence the IT value.
that helps companies to cut costs and improve efficiency by integrating business processes and sharing common resources across an organization (Jones, Cline, & Ryan, 2006), it becomes a fundamental resource to optimize processes at every network node of the manufacturing and service industries’ value chain.
Firm size (H9) is an important determinant for the value creation of ERP in both industries. ERP implementation is a complex, expensive, and time consuming project (Davenport, 1998). Considering that larger companies have more resources and greater capacity for risking such an investment, they are more likely to adopt and use
ERP, understand its capabilities, and can apply the benefits to the firm’s business,
thereby extracting value in an effective way.
Managerial implications
The principal role of manufacturing is to turn physical raw materials into tangible products. Service, on the other hand, generally implies an act and may also provide a
“product”, but one that is often intangible and cannot be described in the same
dimensional terms as manufactured goods (Botta-Genoulaz & Millet, 2006). Thus, the major differences rely in the relative weight of information and customer service (for the service industry) and goods (for the manufacturing industry) in the value creation of operational processes. This makes it especially important for vendors and managers to understand that each industry has different needs that will require different implementation methodologies and systems functionalities based on standard best-practices.
Academic implications
7.
CONCLUSION
8.
LIMITATIONS AND FUTURE WORK
9.
BIBLIOGRAPHY
Aier, S., Bucher, T., & Winter, R. (2011). Critical Success Factors of Service Orientation in Information Systems Engineering. Business & Information Systems
Engineering, 3(2), 77-88.
Barney, J. (1991). Firm resources and sustained competitive advantage. Journal of Management, 17(1), 99-120.
Bendoly, E. (2003). Theory and support for process frameworks of knowledge discovery and data mining from ERP systems. Information & Management, 40(7), 639-647.
Bharadwaj, A. S. (2000). A resource-based perspective on information technology capability and firm performance: an empirical investigation. MIS Quarterly, 169-196.
Botta-Genoulaz, V., & Millet, P. A. (2006). An investigation into the use of ERP systems in the service sector. International Journal of Production Economics, 99(1), 202-221.
Bradford, M., & Florin, J. (2003). Examining the role of innovation diffusion factors on the implementation success of enterprise resource planning systems.
International Journal of Accounting Information Systems, 4(3), 205-225. Castaldi, C. (2009). The relative weight of manufacturing and services in Europe: An
innovation perspective. Technological Forecasting and Social Change, 76(6), 709-722.
Chin, W. W. (1998). Commentary: Issues and opinion on structural equation modeling.
MIS Quarterly, 22(1), 7-16.
Chin, W. W., Marcolin, B. L., & Newsted, P. R. (2003). A partial least squares latent variable modeling approach for measuring interaction effects: Results from a Monte Carlo simulation study and an electronic-mail emotion/adoption study.
Information Systems Research, 14(2), 189-217.
Churchill, G., A,. (1979). A paradigm for developing better measures of marketing constructs. Journal of Marketing Research, 64-73.
Clemons, E. K., & Row, M. C. (1991). Sustaining IT advantage: The role of structural differences. MIS Quarterly, 275-292.
Commission, E. (2005). The New SME Definition: User Guide and Model Declaration. Enterprise and Industry Publications.
Commission, E. (2009). Challenges for EU Support to innovation in services: Fostering new markets and jobs through innovation. PRO INNO Europe Paper.
Conner, K. R., & Prahalad, C. K. (1996). A resource-based theory of the firm: Knowledge versus opportunism. Organization Science, 7(5), 477-501.
Cooper, R. B., & Zmud, R. W. (1990). Information technology implementation research: a technological diffusion approach. Management Science, 36(2), 123-139. Damanpour, F. (1992). Organizational size and innovation. Organization Studies, 13(3),
375-402.
Davenport, T. H. (1998). Putting the enterprise into the enterprise system. Harvard Business Review, 76(4), 121-131.
Davenport, T. H., & Harris, J. G. (2007). Competing on analytics: the new science of winning: Harvard Business Press.
DeLone, W. H., & McLean, E. R. (1992). Information systems success: The quest for the dependent variable. Information Systems Research, 3(1), 60-95.
Devaraj, S., & Kohli, R. (2003). Performance impacts of information technology: Is actual usage the missing link? Management Science, 49(3), 273-289. Elbertsen, L., & Benders, J. (2006). ERP use: exclusive or complemented? Industrial
Management & Data Systems, 106(6), 811-824.
Empson, L. (2001). Introduction: Knowledge management in professional service firms.
Human Relations, 54(7), 811-817.
Fornell, C., & Larcker, D. F. (1981). Evaluating structural equation models with
unobservable variables and measurement error. Journal of Marketing Research, 39-50.
Fosser, E., Leister, O. H., Moe, C. E., & Newman, M. (2008). Organisations and vanilla software: What do we know about ERP systems and competitive advantage.
Proceedings of the 16th European Conference on Information Systems, Galway,
Ireland, 2460-2471.
Frohlich, M. T., & Westbrook, R. (2002). Demand chain management in manufacturing and services: web-based integration, drivers and performance. Journal of Operations Management, 20(6), 729-745.
Gatignon, H., & Robertson, T. S. (1989). Technology diffusion: an empirical test of competitive effects. The Journal of Marketing, 35-49.
Gattiker, T. F., & Goodhue, D. L. (2005). What happens after ERP implementation: understanding the impact of interdependence and differentiation on plant-level outcomes. MIS Quarterly, 559-585.
Gupta, A. (2000). Enterprise resource planning: the emerging organizational value systems. Industrial Management & Data Systems, 100(3), 114-118.
Götz, O., Liehr-Gobbers, K., & Krafft, M. (2010). Evaluation of structural equation models using the partial least squares (PLS) approach. Handbook of Partial Least Squares, 691-711.
Haddara, M., & Zach, O. (2011). ERP systems in SMEs: A literature review. In
Proceedings of the 44th Hawaii International Conference on System Sciences
(HICSS), Hawaii, United States of America, 1-10.
Hair, J. F., Ringle, C. M., & Sarstedt, M. (2011). PLS-SEM: Indeed a silver bullet. The Journal of Marketing Theory and Practice, 19(2), 139-152.
Hair, J. F., Sarstedt, M., Ringle, C. M., & Mena, J. A. (2012). An assessment of the use of partial least squares structural equation modeling in marketing research.
Journal of the Academy of Marketing Science, 40(3), 414-433. Hedman, J., & Kalling, T. (2003). The business model concept: theoretical
underpinnings and empirical illustrations. European Journal of Information Systems, 12(1), 49-59.
Jain, V. (2010). What makes ERP systems to deliver? Impact of post-implementation capabilities on ERP value. In Procceding of the 18th European Conference of
Information Systems, Pretoria, South Africa, paper 99.
Jayawarna, D., Macpherson, A., & Wilson, A. (2007). Training commitment and performance in manufacturing SMEs: incidence, intensity and approaches.
Journal of Small Business and Enterprise Development, 14(2), 321-338. Johansson, U. (2008). The main features of the EU manufacturing industry. Eurostat–
Statistics in focus, 37.
Johnson, J., Baldwin, J. R., & Diverty, B. (1996). The implications of innovation for human resource strategies. Futures, 28(2), 103-119.
Jones, M. C., Cline, M., & Ryan, S. (2006). Exploring knowledge sharing in ERP implementation: an organizational culture framework. Decision Support Systems, 41(2), 411-434.
Kathawala, Y., & Abdou, K. (2003). Supply chain evaluation in the service industry: a framework development compared to manufacturing. Managerial Auditing Journal, 18(2), 140-149.
Keil, M., Tan, B. C., Wei, K.-K., Saarinen, T., Tuunainen, V., & Wassenaar, A. (2000). A cross-cultural study on escalation of commitment behavior in software projects. MIS Quarterly, 24(2), 299-326.
Leimeister, J. M. (2010). Collective intelligence. Business & Information Systems Engineering, 2(4), 245-248.
Levenburg, N., Magal, S. R., & Kosalge, P. (2006). An Exploratory Investigation of Organizational Factors and e‐Business Motivations Among SMFOEs in the US.
Electronic Markets, 16(1), 70-84.
Light, B., Holland, C. P., & Wills, K. (2001). ERP and best of breed: a comparative analysis. Business Process Management Journal, 7(3), 216-224.
Lippert, S. K., & Govindarajulu, C. (2006). Technological, organizational, and
environmental antecedents to web services adoption. Communications of the IIMA, 6(1), 146-158.
Lucas, W., Babaian, T., & Topi, H. (2008). Improving ERP usability through user-system collaboration. International Journal of Enterprise Information Systems, 2(3), 10-23.
Mabert, V. A., Soni, A., & Venkataramanan, M. (2003). The impact of organization size on enterprise resource planning (ERP) implementations in the US
manufacturing sector. Omega, 31(3), 235-246.
Maguire, S., Ojiako, U., & Said, A. (2010). ERP implementation in Omantel: a case study. Industrial Management & Data Systems, 110(1), 78-92.
Matlay, H., & Hyland, T. (1997). NVQs in the small business sector: a critical overview.
Education+Training, 39(9), 325-332.
O'Leary, D. E. (2000). Enterprise resource planning systems: systems, life cycle, electronic commerce, and risk: Cambridge University Press.
Oliveira, T., & Martins, M. F. (2010a). Firms patterns of e-business adoption: evidence for the European Union-27. The Electronic Journal Information Systems
Evaluation, 13(1), 47-56.
Oliveira, T., & Martins, M. F. (2011). Literature Review of Information Technology Adoption Models at Firm Level. The Electronic Journal Information Systems Evaluation, 14(1), 110-121.
Oliveira, T., & Martins, M. F. O. (2011). Understanding the determinant factors of Internet business solutions adoption: the case of Portuguese firms. Applied Economics Letters, 18(18), 1769-1775.
Peteraf, M. (1993). The cornerstones of competitive advantage: A resource-based view. Strategic Management Journal, 14(3), 179-191.
Peteraf, M. A. (2006). The cornerstones of competitive advantage: A resource‐based view. Strategic management journal, 14(3), 179-191.
Piccoli, G., & Watson, R. T. (2008). Profit From Customer Data By Identifying Strategic Opportunities And Adopting The" Born Digital" Approach. MIS Quarterly Executive, 7(3), 113-122.
Rajagopal, P. (2002). An innovation—diffusion view of implementation of enterprise resource planning (ERP) systems and development of a research model.
Information & Management, 40(2), 87-114.
Ramdani, B., Kawalek, P., & Lorenzo, O. (2009). Predicting SMEs' adoption of enterprise systems. Journal of Enterprise Information Management, 22(1/2), 10-24. Raymond, L., & Uwizeyemungu, S. (2007). A profile of ERP adoption in manufacturing
SMEs. Journal of Enterprise Information Management, 20(4), 487-502. Raymond, L., Uwizeyemungu, S., Bergeron, F., & Gauvin, S. (2012). A framework for
research on e-learning assimilation in SMEs: a strategic perspective. European Journal of Training and Development, 36(6), 592-613.
Ringle, C. M., Wende, S., & Will, A. (2005). SmartPLS 2.0. Hamburg: University of Hamburg.
Ross, J. W., Beath, C. M., & Goodhue, D. L. (1996). Develop long-term competitiveness through IT assets. Sloan Management Review, 38(1), 31-42.
Ruivo, P., & Neto, M. (2011). Sustainable enterprise KPIs and ERP post adoption. In Proceeding of the 6th Iberian Conference on Information Systems and Technologies (CISTI), Chaves, Portugal, 1008-1025.
Ruivo, P., Oliveira, T., & Neto, M. (2012). ERP use and value: Portuguese and Spanish SMEs. Industrial Management & Data Systems, 112(7), 1008-1025.
Schmidt, N.-H., Erek, K., Kolbe, L. M., & Zarnekow, R. (2009). Sustainable information systems management. Business & Information Systems Engineering, 1(5), 400-402.
Schmiemann, M. (2008). Enterprises by size class-overview of SMEs in the EU. Statistics in focus, 31, 1-8.
Schoemaker, P., & Amit, R. (1994). Investment in Strategic Assets: Industry and Firm
Level Perspectives,“. Advances in Strategic Management A, 10, 3-33.
Schäfermeyer, D.-K. M., Rosenkranz, C., & Holten, R. (2012). The Impact of Business Process Complexity on Business Process Standardization. Business &
Information Systems Engineering, 4(5), 261-270.
Singla, A. R. (2008). Impact of ERP systems on small and mid sized public sector enterprises. Journal of Theoretical and Applied Information Technology, 4(2), 119-131.
Sohal, A. S., Moss, S., & Ng, L. (2001). Comparing IT success in manufacturing and service industries. International Journal of Operations & Production Management, 21(1/2), 30-45.
Straub, D. W. (1989). Validating instruments in MIS research. MIS Quarterly, 147-169. Tan, K. S., Chong, S. C., Lin, B., & Eze, U. C. (2010). Internet-based ICT adoption among SMEs: Demographic versus benefits, barriers, and adoption intention. Journal of Enterprise Information Management, 23(1), 27-55.
Taylor, M., & Murphy, A. (2004). SMEs and e-business. Journal of Small Business and Enterprise Development, 11(3), 280-289.
Thiesse, F., Staake, T., Schmitt, P., & Fleisch, E. (2011). The rise of the “next-generation
bar code”: an international RFID adoption study. Supply Chain Management: An International Journal, 16(5), 328-345.
Tornatzky, L. G., & Fleischer, M. (1990). The process of technology innovation.
Lexington, MA: Lexington Books.
Uwizeyemungu, S., & Raymond, L. (2011). Information technology adoption and assimilation: Towards a research framework for service sector SMEs. Journal of Service Science and Management, 4(2), 141-157.
Wang, Y. M., Wang, Y. S., & Yang, Y. F. (2010). Understanding the determinants of RFID adoption in the manufacturing industry. Technological Forecasting and Social Change, 77(5), 803-815.
Zhu, K., & Kraemer, K. L. (2005). Post-adoption variations in usage and value of e-business by organizations: Cross-country evidence from the retail industry.
Information Systems Research, 16(1), 61-84.
Zhu, K., Kraemer, K. L., & Dedrick, J. (2004). Information technology payoff in business environments: An international perspective on value creation of e-business in the financial services industry. Journal of Management Information Systems, 21(1), 17-54.
APPENDIX A - MEASUREMENT ITEMS
Constructs Items Literature support
Using a five-point scale, where 1 means “low” and 5 “high”, respondents were asked to rate their perception
Training Please rate the degree to which . . .
TN1 . . . are being trained on the system
TN2 . . . understand the content training material
TN3 . . . navigate through the topic formats applied to daily tasks
(O'Leary, 2000, Bradford and
Florin, 2003, Maguire et al.,
2010, Ruivo et al., 2012)
Compatibility Please rate the degree to which . . .
CB1 . . . your ERP system is compatible with others’ software CB2 . . . your ERP system is compatible with others’ hardware
CB3 . . . your ERP system is compatible with others’ Networks
(Bradford and Florin, 2003,
Elbertsen and Benders, 2006,
Ruivo et al., 2012)
Firm Size S1 – The number of company employees (#)
S2 –Annual Business Volume (€)
(Chwelos et al., 2001, Zhu et
al., 2006)
Best practice Please rate the degree to which training programme make sure users . . .
BP1 . . . to which users set up the application
BP2 . . . to which one can map workflows based on local requirements
BP3 . . . of system adaptability to business needs
(Chou and Chang, 2008,
Wenrich and Ahmad, 2009,
Maguire et al., 2010, Ruivo et
al., 2012)
Competitive
Pressure
According to ERP usage how . . .
CP1 . . . your firm has experienced competitive pressure to use ERP
CP2 . . . your firm would have experienced competitive disadvantage if not
adopted ERP
CP3 . . . the ERP usage in your firm’s competitors affects your landscape market
(Bradford and Florin, 2003, Zhu
and Kraemer, 2005, Oliveira
and Martins, 2010b, Ruivo et
al., 2012)
ERP Use According to users, please rate the degree of how easy it is for them . . .
ERPU1 . . . many employees use the system daily? (#)
ERPU2 . . . much time per day do employees work with the system? (%)
ERPU3 . . . many reports are generated per day? (%)
(Bradford and Florin, 2003, Zhu
and Kraemer, 2005, Ruivo et
al., 2012)
Analytics Please rate the degree of ERP impact on . . .
AN1 . . . comprehensive reporting (KPIs, Dashboards, etc.)
AN2 . . . real-time access to information
AN3 . . . data visibility across departments
(Davenport and Harris, 2007,
Chiang, 2009, Ruivo and Neto,
2011, Ruivo et al., 2012)
Collaboration According to ERP system, please rate the degree of . . .
CO1 . . . collaborate with colleagues
CO2 . . . collaborate with the system
CO3 . . . communicate with suppliers, partners, and customers
(Gattiker and Goodhue, 2005,
Ruivo and Neto, 2011, Ruivo et
al., 2012)
ERP Value Please rate the degree of ERP impact on…
ERPV1 . . . user satisfaction
ERPV2 . . . individual productivity
ERPV3 . . . sales growth
(Bradford and Florin, 2003,
Devaraj and Kohli, 2003, Zhu
and Kraemer, 2005, Ruivo et
APPENDIX B - PAPER PRESENTED AT CISTI 2013 CONFERENCE
ERP Use in the Manufacturing Sector
The case of Iberian SME
Jorge Rebelo Pedro Ruivo Tiago Oliveira
ISEGI, Universidade Nova de Lisboa ISEGI, Universidade Nova de Lisboa ISEGI, Universidade Nova de Lisboa
Lisbon, Portugal Lisbon, Portugal Lisbon, Portugal
[email protected] [email protected] [email protected]
Abstract - Enterprise Resource Planning (ERP) system literature lacks research on post-adoption stages, that is, actual usage. even less studies focus on the specificities of an industry analysis. Based on the Technology-Organizational-Environment (TOE) framework, the present study develops a research model to measure and examine determinants of ERP Use in regards to the impact on Iberian Manufacturing Small Medium Enterprises (SME). Hypotheses are postulated based on five determinants (Training, Compatibility, Firm size, Best-practices and Competitive pressure). Testing was conducted through structural equation modeling, utilizing data from 158 web-surveyed firms in Portugal and Spain of the Manufacturing sector. Results showed that all determinants
contribute to explain “ERP Use” except Training. The paper
provides insight on which determinants contribute for ERP use in Manufacturing Iberian SME, offering managerial and academic implications.
Keywords: ERP; SME Use; Manufacturing; Technology-Organization-Environment Framework.
I. INTRODUCTION
Enterprise Resource Planning (ERP) systems have been applied by many firms around the world as a key part of the organizational infrastructure. ERP encompass a wide range of software products supporting day-to-day business operations and decision-making [1]. These systems tend to have a long life cycle in organizational use, and their processes have been extended into external organizations across the industry value chain [2]. ERP systems are expected to provide, seamless integration of processes across functional areas with improved workflow, standardization of various business practices, improved order management, accurate accounting of inventory, and better supply chain management [3]. The ERP are particular important for manufacturing SME [4]
The manufacturing sector is one of the main economic activities in European Union [5]. Several authors [6-8] state that Small Medium Enterprises (SME) are the support of Europe’s economy, important for increasing
productivity and gaining competitive advantage in the global economy, as well important drivers of innovation and transformation.
Literature reveals that little attention has been given to research on ERP in SME, and even less on specific industries such as manufacturing [9]. To fill this gap we develop a conceptual model based on Technology– Organization-Environment (TOE) framework to explain “ERP use”. To test the conceptual model we collected data from Portugal and Spain manufacturing SME (158 firms). The methodology is presented in Section IV, followed by results, discussion and a summary conclusion.
II. RESEARCH BACKGROUND
A. ERP System Adoption in Manufacturing Firms
ERP systems have traditionally been used by capital-intensive industries, such as manufacturing [10]. Manufacturing firms are facing new challenges and in order to stay competitive, and therefore Information Technology (IT) is now indispensable to many manufacturing operations [11]. Recent findings reveal that in the European context the most important aspect to characterize IT adoption is the industry and its specific characteristics rather than the country the firms belong to [12]. Different industries have different operating characteristics and environments, and the factors related to ERP use may differ accordingly [13, 14]. Given the specificity and complexity of manufacturing firms, we explore which aspects of a firm’s context influence the use of technological innovations.
B. Adoption Models
domains [16-19]. The TOE framework identifies three aspects of a firm’s context that influence the process by which it adopts and implements technological innovation: (a) Technological context – which describes both the internal and external technologies relevant to the firm; (b) Organizational context – which refers to descriptive measures about the firm; and (c) Environmental context – that refers to the arena in which a firm conducts its business [20].
III. RESEARCH MODEL AND HYPOTHESES
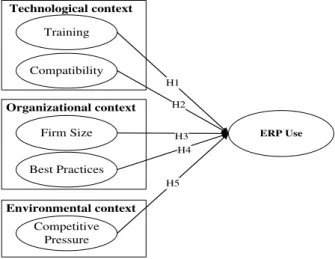
A. Research Model
Grounded on the TOE framework, it was developed a conceptual model to assess the use of ERP systems (Figure 1). The extent of “ERP use” is defined by determinants within the three contexts of the TOE: Technology context (Training and Compatibility), the Organizational Context (Firm Size and Best Practices), and the Environmental context (Competitive Pressure).
Technological context Organizational context Environmental context Training Compatibility Best Practices Firm Size Competitive Pressure ERP Use H1 H2 H4 H3 H5
Figure 1. Research Model
B. Hypotheses
Technology Context
According to Tornatzky and Fleischer [20] a firm with higher quality of human resources, such as better education or training, will have higher ability in technological innovation. Thus, literature shows that training is an important factor for IT implementation success and furthermore for successfully adopting, using, and benefiting from ERP systems [21-23].
H1. The level of firms training program will have a positive relationship with ERP use.
Compatibility has been shown to be an important factor to explain innovation use by organizations, thus high compatibility has been identified as a facilitator for innovation adoption [24, 25]. Bradford and Florin [22]
systems with existing IT infrastructure will have a positive relation with successful adoption and use.
H2. Firms having ERP systems with greater
compatibility are more likely to use ERP.
Organizational Context
Larger firms have an advantage over smaller ones, as they have more resources and can take greater risks associated with innovation adoption [26]. Smaller firms although more versatile, do not readily adopt newer technologies [27].
H3. Firm Size will positively influence ERP Use.
The business processes implicit with the ERP system are purported to represent “best practice” and a more competitive business model [28]. According to [8, 23] firms that implement industry best-practices dramatically reduce risk and time-consuming project tasks such as configuration, documentation, testing, and training.
H4. Firms with a greater degree of business process fit to
standard ERP “best-practices” are more likely to use ERP.
Environment Context
Competitive pressure refers to the degree of pressure from competitors, which is an external power pressing a firm to adopt new technology in order to avoid competitive decline [24]. Several studies determined Competitive Pressure is an IT adoption and use driver [24, 29].
H5. Firms facing higher competitive pressure are more likely to achieve a greater extent of ERP use.
IV. METHOD
A. Measurement
B. Participants and Data Collection
Data was collected using an online survey over a two-month period (September-October 2011). 1400 Iberian companies were contacted and 558 completed responses were received. The sampling was stratified by country (Portugal and Spain), by firm size (fewer than 250 employees), and by industry, resulting in a final sample of 158 Manufacturing. The respondents were qualified individuals (e.g., Chief Executive Officer (CEO), Chief Financial Officer (CFO), and functional managers) to speak about the company’s ERP, which suggests a good quality of the data. The profile of the sample is shown in Table I.
TABLEI.SAMPLE CHARACTERISTICS
Respondent Type Manufacturing (N=158)
Frequency (%) Cumulative (%)
CEO 24% 24%
Manufacturing Manager 30% 54%
Finance Manager 15% 69%
IT/IS Manager 17% 86%
Sales Manager 14% 100%
V. RESULTS
Structured Equation Modeling (SEM) was used to empirically assess the research model (Figure 1). It was performed the Kolmogorov-Smirnov test and confirmed that none of the items measured are distributed normally (p<0.001). For this reason we use Partial Least Square (PLS) since it does not require a normal distribution [30]. PLS estimation requires ten times the largest number of structural paths directed at a particular construct in the model [31]. The sample in our study met the necessary conditions for using PLS.. The specific tool used was SmartPLS 2.0[32] . Using the SmartPLS software, it was first examined the measurement model to assess reliability and validity before testing the structural model.
A. Measurement Model
The results of the measurement model (reliability, validity, correlations and factor loading) are reported in Tables II and IV. We assessed construct reliability, indicator reliability, convergent validity, and discriminant validity. The construct reliability was tested using the composite reliability coefficient. PLS prioritizes indicators according to their individual reliability. As shown on Table II, all the constructs have a composite reliability above 0.7 which suggests that the constructs are reliable [33].
TABLEII.CORRELATION MATRIX,CR AND SQUARE
ROOT OF AVE
Constructs CR 1 2 3 4 5 6
Training (1) 0.94 0.95
Compatibility (2) 0.92 0.24 0.90
Firm Size (3) 0.91 0.20 -0.09 0.92
Best Practices (4) 0.81 0.53 0.28 0.18 0.83
Competitive Pressure (5) 0.85 0.30 0.09 0.37 0.34 0.80
ERP Use (6) 0.83 0.38 0.34 0.55 0.41 0.46 0.79
Notes:(1) First column (CR) is Composite Reliability;(2) Diagonal elements are square root of Average Variance Extracted;(3) off-diagonal elements are correlations
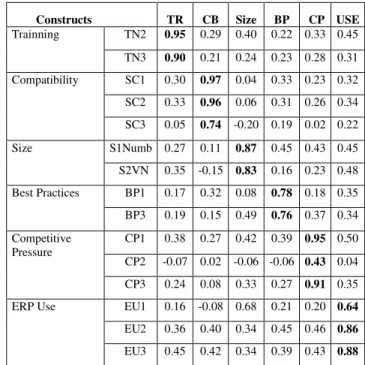
TABLEIII.LOADINGS AND CROSS-LOADING
Constructs TR CB Size BP CP USE
Trainning TN2 0.95 0.29 0.40 0.22 0.33 0.45
TN3 0.90 0.21 0.24 0.23 0.28 0.31
Compatibility SC1 0.30 0.97 0.04 0.33 0.23 0.32
SC2 0.33 0.96 0.06 0.31 0.26 0.34
SC3 0.05 0.74 -0.20 0.19 0.02 0.22
Size S1Numb 0.27 0.11 0.87 0.45 0.43 0.45
S2VN 0.35 -0.15 0.83 0.16 0.23 0.48
Best Practices BP1 0.17 0.32 0.08 0.78 0.18 0.35
BP3 0.19 0.15 0.49 0.76 0.37 0.34
Competitive Pressure
CP1 0.38 0.27 0.42 0.39 0.95 0.50
CP2 -0.07 0.02 -0.06 -0.06 0.43 0.04
CP3 0.24 0.08 0.33 0.27 0.91 0.35
ERP Use EU1 0.16 -0.08 0.68 0.21 0.20 0.64
EU2 0.36 0.40 0.34 0.45 0.46 0.86
EU3 0.45 0.42 0.34 0.39 0.43 0.88
The indicator reliability was evaluated based on the criteria that the loadings should be greater than 0.70, and that every loading less than 0.4 should be eliminated [34]. As shown in Table IV, the loadings (in bold) are greater than 0.7. All the items are statistically significant at 0.001. Overall, the instrument presents good indicator reliability.
Average Variance Extracted (AVE) was used as the criterion to test convergent validity. The AVE should be higher than 0.5 so that latent variable explains more than half of the variance of it indicators [34-36].