Stephany Ferreira
Microcrystalline Cellulose and Sisal Fibre
Reinforced Cementitious Composites
Stephany Ferreira
Micr
ocr
ys
talline Cellulose and Sisal F
ibr
e
R
einfor
ced Cementitious Com
Dissertação de Mestrado
Ciclo de Estudos Integrados Conducentes ao
Grau de Mestre em Engenharia Civil
Trabalho efetuado sob a orientação do
Professor Doutor Raul Fangueiro
Stephany Ferreira
Microcrystalline Cellulose and Sisal Fibre
Reinforced Cementitious Composites
A
CKNOWLEDGEMENTS
This thesis is the culmination of very important chapter in my life that could not have been achieved without the contributions of many people that are a part of my life.
To my thesis advisor Professor Raul Fangueiro who was always available when needed with both time and guidance. Your advice on my thesis was priceless.
I would like to thank Shama Parveen, a doctoral student. Without your assistance and dedicated involvement throughout all this process, this thesis would not have been accomplished.
To the people at the civil engineering’s construction materials laboratory at University of Minho, in particular to Carlos, for always being available to help throughout the development of this thesis.
Most importantly, none of this would be possible without my family. To my parents who have always loved, encouraged and supported me. To my sister, to whom I have always tried to be a good example and made me try harder to show that anything you set your mind to you can achieve.
A special thank you to my friends, Sandra, Diana, Célia, Daniela and Ana, for always being there through the good and bad times, for all the late nights, for our friendship that I hope never ends. Without the Babes my university experience would not have been the same.
R
ESUMO
Nas últimas décadas tem existido um crescente interesse em métodos alternativos de reforçar compósitos cimentícios. A utilização de fibras naturais como elemento de reforço tem sido bastante explorada ao longo dos anos, sendo que origina compósitos cimentícios com uma resistência ao impacto e à fissuração superior quando comparados com compósitos cimentícios comuns. Por outro lado, o uso de celulose microcristalina (CMC) também tem sido estudado, principalmente na última década, verificando-se que origina um aumento na resistência à compressão, assim como uma diminuição da fissuração causada por esforços provenientes de contração térmica e de resistência estrutural.
O principal objetivo deste trabalho foi estudar o comportamento de compósitos cimentícios reforçados à multiescala, através de CMC e de fibras de sisal. Para tal, procedeu-se à preparação de compósitos cimentícios com várias combinações de percentagens de CMC (0.2%, 0.5% e 0.75% em relação a cimento) e sisal (0.25% e 0.5% em relação a cimento) diferentes. Aos 28 dias, estes compósitos cimentícios reforçados com CMC e/ou sisal foram sujeitos a testes de resistência à flexão e à compressão. A incorporação de 0.5% CMC na matriz cimentícia resultou num aumento da resistência à flexão, assim como a adição de 0.5% sisal. Obteve-se um aumento da capacidade de carga pós-pico na matriz cimentícia quando fibras de sisal são adicionadas. Não se verificaram alterações significantes na resistência à compressão após incorporação de CMC e sisal.
A inclusão de CMC e fibras de sisal apresenta resultados promissores quando incorporados individualmente na matriz cimentícia. Em conjunto, CMC e sisal, não apresentam melhoria da resistência à flexão devido à natureza higroscópica de ambos. Portanto, um estudo mais aprofundado no efeito da hidratação destes elementos na matriz cimentícia deve ser efetuada.
A
BSTRACT
In the past few decades, there has been a growing interest in alternative methods of reinforcing cementitious composites. The use of natural fibres as a reinforcing element has been significantly explored over the years as it originates cementitious composites with superior impact and crack strength when compared with plain cementitious composites. On the other hand, the use of microcrystalline cellulose (MCC) has also been studied, particularly in the last decade, displaying an increase in compressive strength as well as a decrease in cracking caused by stresses due to thermal contraction and structural restraint.
The main objective of this research work was to study the behaviour of cementitious composites reinforced at multiscale with MCC and sisal fibres. In order to do so, cementitious composites were prepared with several different percentage combinations of MCC (0.2%, 0.5% and 0.75% w.r.t. cement) and sisal fibres (0.25% and 0.5% w.r.t. cement). At 28 days, these MCC and/or sisal reinforced cementitious composites were subjected to flexural and compressive strength testing. The incorporation of 0.5% MCC in the cementitious matrix resulted in an increase in flexural strength. Furthermore, the incorporation of 0.5% sisal in the cementitious matrix also showed an increase in flexural strength. An increase in the post peak load capacity was obtained with the addition of sisal fibres in cementitious matrix. There is no significant change in compressive strength after incorporation of sisal fibres and mcc together in cementitious matrix
The findings show that the inclusion of MCC and sisal fibres show promising results when incorporated individually in the cementitious matrix. Together, MCC and sisal do not show any improvement in flexural strength due to the hygroscopic nature of both, therefore, a more detailed study should be conducted in the hydration effect of these elements in the cementitious matrix.
I
NDEX
Acknowledgements ... iii Resumo ... v Abstract ... vii Chapter 1 - Introduction ... 1 1.1. Scope ... 1 1.2. Motivation ... 1 1.3. Objective ... 2 1.4. Thesis Structure ... 2Chapter 2 - Literature Survey ... 5
2.1. Microcrystalline Cellulose ... 5
2.2. Fibres ... 5
2.2.1. Plant Fibres ... 6
2.3. Composites ... 8
2.3.1. Multiscale Composite ... 8
2.3.2. Cementitious Composite Matrix ... 9
Chapter 3 - Materials and Methods ... 11
3.1. Materials ... 11 3.1.1. Bonding Agent ... 11 3.1.2. Aggregates ... 11 3.1.3. Water ... 12 3.1.4. Microcrystalline Cellulose ... 12 3.1.5. Sisal ... 12 3.1.6. Other materials ... 12 3.2. Methods ... 13 3.2.1. Optical Analysis ... 13 3.2.2. UV Analysis of MCC ... 17
3.2.3. Tensile Behaviour of Sisal Fibres ... 18
3.2.5. Flow Table Test ... 26
3.2.6. Flexural Strength Testing ... 28
3.2.7. Compressive Strength Testing ... 29
Chapter 4 - Results and Behaviour Analysis ... 31
4.1. Optical Analysis ... 31 4.1.1. MCC without Surfactant ... 31 4.1.2. MCC with Pluronic F-127 ... 32 4.1.3. MCC with CTAB ... 33 4.1.4. Sisal Fibres ... 35 4.2. UV Analysis ... 37 4.2.1. MCC without Surfactant ... 37 4.2.2. MCC with Pluronic F-127 ... 37 4.2.3. MCC with CTAB ... 38
4.3. Tensile Behaviour of Sisal Fibres ... 40
4.4. Flow Table Test ... 40
4.4.1. Cementitious Composites without Surfactant ... 40
4.4.2. Cementitious Composites with Pluronic F-127 ... 41
4.4.3. Cementitious Composites with CTAB ... 41
4.5. Flexural Strength Testing ... 42
4.5.1. Cementitious Composites Reinforced without Surfactant ... 42
4.5.2. Cementitious Composites Reinforced with Pluronic F-127 ... 43
4.5.3. Cementitious Composites Reinforced with 100% CTAB ... 45
4.5.4. Cementitious Composites Reinforced with 40% CTAB ... 46
4.5.5. Fracture Energy ... 47
4.6. Compressive Strength Testing ... 49
Chapter 5 - Conclusion ... 53
5.1. Future Work ... 54
Bibliography ... 57
ATTACHMENT 1-CHARACTERISTICS OF THE CEMENT ... 60
ATTACHMENT 2-CHARACTERISTICS OF THE STANDARD SAND ... 61
ATTACHMENT 4–TENSILE BEHAVIOUR OF SISAL FIBRES RESULTS ... 63
ATTACHMENT 5–FLEXURAL STRENGTH TESTING RESULTS ... 65
ATTACHMENT 6–COMPRESSIVE STRENGTH TESTING RESULTS ... 66
F
IGURE
I
NDEX
Figure 1 - Agave Sisalana plant ... 7
Figure 2 - Structural Formula of MCC [Avicel] ... 12
Figure 3 - Chemical Structure of Pluronic F-127 (SIGMA) ... 13
Figure 4 - Chemical Structure of CTAB (Ana Maria Carmona-Ribeiro et al., 2013) ... 13
Figure 5 - Print from UV-2401PC ... 17
Figure 6 - Cells and cell holder ... 17
Figure 7 - Samples 1 to 7 ... 18
Figure 8 - Samples 9 to 13 ... 18
Figure 9 – Equipment used to measure in tension ... 19
Figure 10 - Tensile strength testing machine... 19
Figure 11 - Sample in use ... 19
Figure 12 - Sample before testing... 19
Figure 13 - Hobart mixer ... 22
Figure 14 – Sample 1 on magnetic stirrer [0,4% MCC w.r.t. water] ... 25
Figure 15 – Sample 2 on magnetic stirrer [1,0% MCC w.r.t. water] ... 25
Figure 16 - Fluidity test ... 26
Figure 17 - Fluidity test ... 26
Figure 18 – Measuring fluidity ... 26
Figure 19 – Measuring fluidity ... 26
Figure 20 - Compacting machine ... 27
Figure 21 - Sample_04 ... 27
Figure 22 - Sample_05 ... 27
Figure 23 - Sample ... 28
Figure 24 - Flexural testing ... 28
Figure 25 - Compressive machine ... 29
Figure 26 - Compressive machine (close-up) ... 29
Figure 27 - Sample 2.2 after flexural testing ... 29
Figure 28 – Sample in the compressive machine ... 30
Figure 29 - Sample post break ... 30
Figure 31 – 1.0% MCC ... 31 Figure 32 – 1.5% MCC ... 31 Figure 33 - 0.4% MCC + Pluronic F127 ... 32 Figure 34 - 1.0% MCC + Pluronic F127 ... 32 Figure 35 - 1.5% MCC + Pluronic F127 ... 32 Figure 36 – 0.4% MCC + CTAB ... 33 Figure 37 – 1.0% MCC + CTAB ... 33 Figure 38 – 1.5% MCC + CTAB ... 33 Figure 39 – 1.0% MCC + 40% CTAB ... 34 Figure 40 – 1.0% MCC + 60% CTAB ... 34 Figure 41 – 1.0% MCC + 80% CTAB ... 34 Figure 42 – 1.0% MCC + 100% CTAB ... 34 Figure 43 - 0.4% MCC +CTAB ... 35 Figure 44 - 1.5% MCC + CTAB ... 35 Figure 45 – Sisal_1 ... 35 Figure 46 – Sisal_2 ... 35 Figure 47 – Sisal_3 ... 35 Figure 48 – Sisal_4 ... 36 Figure 49 – Sisal_5 ... 36 Figure 50 – Sisal_6 ... 36 Figure 51 – Sisal_7 ... 36
Figure 52 - Spectrum obtained for Varying Percentages of MCC ... 37
Figure 53 - Spectrum obtained for Varying Percentages of MCC + 20% Pluronic F127 ... 38
Figure 54 - Spectrum obtained for 1.0% MCC + Varying Percentages of CTAB ... 39
Figure 55 - - Spectrum obtained for Varying Percentages of MCC + 40% CTAB ... 39
Figure 56 - Flexural strength of reinforced mortar without surfactant ... 42
Figure 57 - Flexural strength of reinforced mortar with Pluronic F127 ... 44
Figure 58 - Flexural strength of reinforced mortar with 100% CTAB ... 45
Figure 59 - Flexural strength of reinforced mortar with 40% CTAB ... 46
T
ABLE
I
NDEX
Table 1 – Mechanical properties of sisal fibres (P.V. Joseph et al., 1999) ... 7
Table 2 - Sisal fibre composition (Klerk M., 2015) ... 7
Table 3 - Amount of MCC ... 14
Table 4 - Amount of MCC and Pluronic F127 ... 14
Table 5 - Three phases analysed ... 15
Table 6 - Amount of MCC and CTAB ... 15
Table 7 - Amount of CTAB ... 16
Table 8 - Amount of MCC and CTAB ... 16
Table 9 - Samples studied without surfactant ... 20
Table 10 - Samples studied with 20% Pluronic F-127 ... 21
Table 11 - Samples studied with 100% CTAB... 21
Table 12 - Samples studied with 40% CTAB... 21
Table 13 - Quantities of each material for sample preparation ... 22
Table 14 - Quantities of each material for sample preparation ... 23
Table 15 - Quantities of each material for sample preparation ... 24
Table 16 - Results from fluidity test (without surfactant) ... 40
Table 17 - Results from fluidity test (with Pluronic F-127) ... 41
Table 18 - Results from fluidity test (with 40% CTAB) ... 41
Table 19 - Results from fluidity test (with 100% CTAB) ... 42
Table 20 - Flexural strength of reinforced mortar without surfactant ... 43
Table 21 - Flexural strength of reinforced mortar with Pluronic F127 ... 44
Table 22 - Flexural strength of reinforced mortar with 100% CTAB ... 45
Table 23 - Flexural strength of reinforced mortar with 40% CTAB ... 46
Table 24 – Fracture energy results (without surfactant) ... 47
Table 25 – Fracture energy results (with Pluronic F-127)... 48
Table 26 – Fracture energy results (with 40% CTAB) ... 48
Table 27 – Fracture energy results (with 100% CTAB) ... 48
A
BBREVIATIONS
,
S
YMBOLS AND
A
CRONYMS
L
IST
CEN European Committee for Standardization cm centimetre
CNT Carbon Nanotube
CTAB Cetyltrimethylammonium Bromide CV Coefficient of Variation
EN European Norm
g Grams
g/cm3 Gram per cubic centimetre GF Fracture Energy Improv. Improvement km Kilometre kN Kilo Newton LM Linear Mass MCC Microcrystalline Cellulose ml Millilitre mm Millimetre mm3 Cubic millimetre MPa Mega Pascal
N Newton
N/mm Newton per millimetre
nm nanometre NP Portuguese norm SP Superplasticizer TBP Tributyl phosphate UV Ultraviolet w.r.t. With regards to µm micrometre % Percentage
Chapter 1 -
I
NTRODUCTION1.1. Scope
The construction industry is greatly responsible for the depletion of non-renewable resources. Therefore, research regarding the use of natural and renewable materials, such as natural fibres and cellulose which can be found in plants, is needed (S. Thomas et al., 2008).
Concrete, one of the most used materials on the planet, is known for its high compressive strength and low tensile strength. The combined use of concrete and steel reinforced bars has resolved the low tensile strength problem, as well as added to the compressive strength. Unfortunately, reinforced concrete is highly permeable which can lead to steel corrosion and therefore destruction of the concrete. Furthermore, steel is an expensive material, has high energy consumption and comes from a non-renewable resource (Torgal F. et al., 2011).
1.2. Motivation
For the reasons stated above, the idea of using natural fibres (NF) as a reinforcing element, either substituting or complementing steel, has been significantly explored over the years. Natural fibres in addition to being renewable also have good mechanical properties, low cost and are recyclable (Ramakrishna G. et al., 2005).
Natural fibres are constituted by several cellulose microfibrils, where cellulose chains are arranged in distinct conformations. One of them, cellulose microcrystalline (MCC), is a crystalline conformation in which the cellulose chains are disposed in organized and repetitive arrays to form crystals. This material will also be object of study in this dissertation (Hoyos C. et al., 2013).
The use of NF as a reinforcing material for concrete has already been explored. Consequently, it is known that, by using this type of reinforcement both impact and crack strength are superior to common concrete (G. Ramakrishna et al., 2005).
The use of MCC as a reinforcing material for concrete has also been explored and has shown to lead to an increase in compressive strength (M.S. Mohammed et al., 2014) and a decrease in cracking caused by stresses due to thermal contraction and structural restraint (Hoyos C. et al., 2013).
1.3. Objective
The purpose of this dissertation is to expand the knowledge on the use of these materials, exploring the effect of adding different percentages of the combination MCC/NF in cementitious matrixes, producing a multiscale reinforced material.
It is expected that, in the event o cracking, the NF will act on a macro scale while the MCC acts on a micro scale attributing a better mechanical behaviour to the cementitious composite. Ultimately, the expected result is a better behaviour with the combination NF/MCC than would be expected when used individually.
1.4. Thesis Structure
This thesis is divided into five chapters and seven attachments.
Chapter 1, the present chapter, is the Introduction. It contains the scope, motivation and objectives of this thesis.
Chapter 2 contains the theoretical concepts involving the subject of this work, in order to establish a background on which this work could be based. Cementitious composites, microcrystalline cellulose and natural fibres (in particular sisal fibres) were characterized by both physical and mechanical properties.
In Chapter 3 the materials and methods used throughout this work are presented. The methods used were optical and UV analysis, tensile testing of sisal fibres, development of cementitious composites, workability testing and, flexural and compressive strength testing.
Chapter 4 contains the results obtained from the testing described in the previous chapter. This chapter also contains the analysis of the obtained results.
Chapter 5 is the conclusion of this research work, along with suggested future work possibilities.
Chapter 2 -
L
ITERATURES
URVEY2.1. Microcrystalline Cellulose
Cellulose is the stiffest and the strongest organic constituent in the fibre. Microcrystalline cellulose (MCC) is a purified partially depolymerised non-fibrous form of cellulose that occurs as a white, odourless and tasteless crystalline powder composed of porous particles. MCC can be made from any material that contains high levels of cellulose ranging from pure cellulose, commercial grade cellulose to lignocellulosic materials. MCC has well-known binding properties and has proven to be stable, safe and physiologically inert (Adel A. et al., 2011).
Properties, such as crystallinity, moisture content, surface area and porous structure, molecular weight and many others, differ when cellulose is obtained from different sources. Therefore, properties of MCC obtained from different sources can also be expected to differ. Hydrolysis can also affect the properties of the obtained MCC.
To obtain MCC, cellulose hydrolysis is needed. Cellulose hydrolysis can be accomplished using mineral acid, enzymes or microorganisms. The conventional method of manufacturing MCC is acid hydrolysis. Enzymatic methods are desirable because glucose, a useful by-product, is created but these methods are more expensive and create MCC products with lower crystallinity.
MCC is used in various fields such as pharmacy, cosmetics, food industry and plastic processing industry (Adel A. et al., 2011).
2.2. Fibres
Fibres can be classified by its nature (natural or synthetic), by distribution (randomly dispersed or grouped accumulations), or by the shape of the groups (isolated, in several geometric nets or tangled forming a fabric).
Natural fibres derive from natural sources such as plants (sisal, flax, jute and more), animals (silk, wool) and minerals (mineral wool, for example), while synthetic fibres, such as glass, steel, carbon and polypropylene fibres, are man-made fibres, made with the purpose of improving on the properties of natural fibres (Gonzalez J., 2007).
All the fibres mentioned have distinct properties and characteristics and possess many advantages and disadvantages over the different fibres.
2.2.1. Plant Fibres
Reinforcement using plant-based fibres, such as cotton, hemp, jute, flax, ramie, sisal, bagasse and many others, has shown significant improvement in the properties of cementitious composites. As these fibres are obtained from renewable sources and readily available, at relatively low cost, they have an advantage over synthetic fibres. The benefits from large scale utilization of plant-based natural fibres as raw materials for cementitious composites are immense in terms of environmental, energy and resource conservation (Onuaguluchi O. et al., 2016).
Natural fibres have a high tensile strength and low modulus of elasticity. Even so, their tensile performance can stand in a favourable manner with synthetic ones. One of the disadvantages of using natural fibres is that they have a high variation on their properties which could lead to unpredictable concrete properties (Mohammed M. et al., 2014; Swamy R., 1990). For example, the tensile strength decreases with an increase in fibre length. This can happen because the longer the fibre, the higher the probability of it containing a defect (e.g. kink bands) which could lead to premature failure when compared with shorter fibres. Pre-treatment of natural fibres was found to increase concrete performance. Pulping is one of the fibre treatments that improve fibre adhesion to the cement matrix and also resistance to alkaline attack (Li Z. et al., 2006).
Even though fibres are discontinuous and are most commonly randomly distributed throughout the cementitious matrix, because they tend to be more closely spaced than conventional reinforcing bars, they are better at controlling cracking.
2.2.1.1. Sisal Fibres
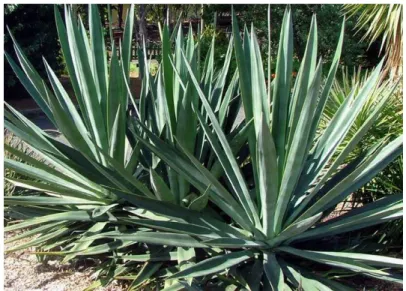
Sisal, also known as Agave Sisalana, is a leaf fibre. Leaf fibres are coarse and hard fibres obtained from leaf tissues either by hand scraping after a beating/retting process or mechanical extraction. Owing to the relatively high strength, leaf fibres are typically used for the production of ropes, fabrics, carpets and mats (Onuaguluchi O. et al., 2016).
Table 1 and Table 2 shows the mechanical properties and constitution of sisal fibres, respectively.
Table 1 – Mechanical properties of sisal fibres (P.V. Joseph et al., 1999) Tensile Strength (MPa) Young Modulus (GPa) Elongation at break (%) Density (g/cm 3) Sisal 511 - 635 9.4 - 22 2 – 2.5 1.5
Table 2 - Sisal fibre composition (Klerk M., 2015)
Cellulose (%) Lignin (%) Hemicellulose (%) Extractives (%) Ash (%)
Sisal 73.11 11.0 13.33 1.33 0.33
Figure 1 shows a photograph of a sisal plant.
According to Silva and Rodrigues, the addition of sisal fibres into concrete reduced its compressive strength which they claimed due to its low workability making its microstructure not as dense as that without fibre reinforcement (Silva J. et al. 2007).
An experimental programme carried out on sisal fibre-reinforced cement confirmed the theoretical prediction of an increase in flexural strength – by a factor of more than three percent. These results were achieved with suitable choices of mix parameters and fibre incorporation techniques (Swift D. et al., 1979).
2.3. Composites
The term composite is fundamentally broad, it means any system of two or more material phases combined and working together whose mechanical performance and properties are designed to be superior than those of the constituent materials (Arboleda D. et al., 2014).
Composites have many advantages such as lightweight, high strength, corrosion resistance, high impact strength, dimensional stability, design flexibility, nonconductive, nonmagnetic, low thermal conductivity, durable (Premix, 2016).
2.3.1. Multiscale Composite
Multiscale composites contain reinforcements at varying scales. This allows different elements to work on different phases of the composites lifespan.
In recent years, the use of multiscale composites has drawn significant attention in the field of advance, high-performance materials. Most of the efforts in multiscale composites research have been focused on improving the matrix-dominated properties by dispersing CNTs in the bulk of the matrix (Kim M. et al., 2009).
Cementitious composites reinforced with microcrystalline cellulose, at a microscale, and sisal fibres, at a macroscale, were studied in this research work.
2.3.2. Cementitious Composite Matrix
Plain cementitious composites are characterized by high compressive strength but low tensile strengths and low tensile strain capacities (they are brittle materials) (Pakravan H. et al., 2011; Bentur A. et al., 2007). The cementitious matrix can be divided into two types depending on the aggregate it contains: mortar (cement, sand and water mix) and concrete (cement, sand, coarse aggregate and water mix) (Bentur A. et al., 2007).
The cementitious matrix type used throughout this research work is the mortar. As mentioned, sisal (a natural fibre) and MCC were introduced in cementitious matrixes with varying percentages.
2.3.2.1. Cementitious Composite Reinforced with Natural Fibres
The purpose of reinforcing cementitious composites with fibres is to improve the mechanical properties, in particular the behaviour after cracking has started. The post cracking toughness that the fibres produce in the material may allow more intensive use of such composites in building. The performance of fibre reinforced composites depends on the volume and the physical and mechanical properties of the fibre as well as the binding properties between matrix and fibre (Gonzalez J., 2007).
The main drawback to the use of natural fibres is the durability of these fibres in a cementitious matrix and also the compatibility between both phases (Agopyan V. et al., 2005).
The durability of natural fibre reinforced cementitious composites hinges on its ability to resist both external (temperature and humidity variations, sulphate or chloride attack, amongst others) and internal damage (compatibility between fibres and cement matrix, volumetric changes, and others). The degradation of natural fibres immersed in Portland cement is due to the high alkaline environment which dissolves the lignin and hemicellulose phases, thus weakening the fibre structure.
Durability of fibre reinforced cementitious composites can be improved if matrix modification and/or fibre modification is used. Matrix modification consists in using low alkaline concrete by adding pozzolanic by-products to Portland cement such as rice husk ash or fly ashes. Results
show that the use of ternary blends containing slag/metakaolin and silica fume are effective in preventing fibre degradation. Fibre modification consists in coating natural fibres to avoid water absorption and free alkalis. Recent findings report that a silane coating of fibres is a good way to improve the durability of natural fibre reinforced concrete.
Some authors have mentioned that the use of pulped fibres can improve durability performance while others have reported that the fibre extraction process can prevent durability reductions. The use of compression and temperature (120, 160 and 200 ºC) can lead to an increase of fibre stiffness and a decrease of fibre moisture absorption (Torgal F. et al., 2011).
2.3.2.2. Cementitious Composite Reinforced with MCC
The effect of MCC particles on the properties of cement based composites have already been analysed. The mechanical properties and hydration process of cementitious composites were studied using flexural testing and thermogravimetric analysis, respectively. The results showed that the interactions between MCC particles, cement particles, hydration products and water, decreased the workability and delayed the hydration reaction; however, these interactions increased temperature during curing process and increased the hydration degree of cement composites (Hoyos C. et al., 2013).
Further study on cementitious composites reinforced with MCC has shown a reduction in weight as well as an increase in compressive strength. In addition, lower ratios of MCC have shown better results at early ages of hydration and reported higher compressive strength than plain cement mortar.
No interaction was reported between the fibres and cement constituents based on the performed analysis (Mohammed M. et al., 2014).
Chapter 3 -
M
ATERIALS ANDM
ETHODS3.1. Materials
All the materials used in this research work were provided by the civil engineering construction materials laboratory of University of Minho, Fibrenamic International Platform, chemical department and the Institute of Science and Innovation for Bio-Sustainability (IB-S). The preparation of the cementitious composites, as well as the mechanical testing, was done in the civil engineering construction materials laboratory of University of Minho.
3.1.1. Bonding Agent
The bonding agent used was Portland Limestone-Cement CEM II / A-L 42,5 R produced by SECIL, certified in accordance with NP EN 197-1. According to the SECIL catalogue, this product has great versatility, good workability and high strengths. This cement is grey and has lower hydration temperature and better workability than cement CEM I of the same strength class. One of the main characteristics is the quick development of strength (high early strength). Further characteristics of this material can be found in Attachment 1 (SECIL, 2004). The Portland cement used was provided by the civil engineering construction materials laboratory of University of Minho.
3.1.2. Aggregates
The aggregate used was standard sand marketed by SOCIETE NOUVELLE DU LITTORAL (SNL), from France. The sand is CEN certified in accordance with EN 196-1, conforming to ISO 679:2009. It is a natural sand, siliceous, clean and its particles are generally isometric and rounded in shape. It is dried, screened and prepared in a modern workshop which offers every guarantee in terms of quality and consistency. The sand is packaged in polyethylene bags each containing 1350 ± 5 g. Further characteristics of this material can be found in Attachment 2 (SOCIETE NOUVELLE DU LITTORAL, 2016). The sand used was provided by the Fibrenamic International Platform.
3.1.3. Water
Distilled water was used to develop the cementitious composite. The water was provided by the chemical department.
3.1.4. Microcrystalline Cellulose
The MCC used, in all experiments depicted in this thesis, was from cotton linters marketed by Avicel®. This is a high purity cellulose powder (approximately 50 µm particle size).
Figure 2 - Structural Formula of MCC [Avicel]
Figure 2 shows the chemical structure of MCC. The MCC used was provided by the Fibrenamic International Platform. Further characteristics of this material can be found in Attachment 3 (Avicel, 2008).
3.1.5. Sisal
The sisal fibres used were provided by the Fibrenamic International Platform. The fibres consisted of long strands with varying dimensions.
3.1.6. Other materials
In the development of the cementitious composites, chemicals were used to disperse the MCC (surfactants), as foam inhibitors and to increase fluidity in the cementitious composites (superplasticizer). The chemicals used were provided by the Fibrenamic International Platform.
3.1.6.1. Surfactants
The surfactants used were Pluronic F-127 and Cetyltrimethylammonium Bromide (C19H42BrN), also known as CTAB. Pluronic F-127 is a non-ionic surfactant and was marketed by SIGMA-ALDRICH. CTAB is a cationic surfactant and was marketed by Applichem Panreac. Figures 3 and 4 show the chemical structure of Pluronic F-127 and CTAB, respectively.
Figure 3 - Chemical Structure of Pluronic F-127 (SIGMA)
Figure 4 - Chemical Structure of CTAB (Ana Maria Carmona-Ribeiro et al., 2013)
3.1.6.2. Foam Inhibitor
The foam inhibitor used was Tributyl Phosphate (TBP) marketed by Chem-Lab.
3.2. Methods
All the methods used throughout this research work are described below.
3.2.1. Optical Analysis
An Olympus BH-2 microscope was used to perform the optical analysis. Both MCC and sisal fibres were subjected to optical analysis.
3.2.1.1. MCC without Surfactant
The percentages of MCC analysed were 0.4%, 1.0% and 1.5% MCC w.r.t. 10 ml of water. The quantities of MCC were calculated and are presented on Table 3.
Table 3 - Amount of MCC
Percentage of MCC Quantity in 10 ml of water
0.4% 0.04 g
1.0% 0.1 g
1.5% 0.15 g
The three samples were prepared 48 hours in advance to allow the MCC time to settle. The quantities shown above were weighed and introduced into test tubes along with 10 ml of water, sealed and lightly shaken. Before optical analysis, all samples were placed in ultrasonic cleaner for 30 minutes. A drop from each sample (0.4% MCC, 1.0% MCC and 1.5% MCC w.r.t. water) were put on microscope slides and analysed with the microscope.
3.2.1.2. MCC with Pluronic F-127
The percentage of Pluronic F127 used was 20% w.r.t. MCC. The quantities of Pluronic F127 were calculated and are presented on Table 4.
Table 4 - Amount of MCC and Pluronic F127 Percentage of MCC Quantity of MCC w.r.t. 10 ml of water Quantity of 20% Pluronic F-127 w.r.t. MCC 0.4% 0.04 g 0.008 g 1.0% 0.1 g 0.02 g 1.5% 0.15 g 0.03 g
The quantities of MCC shown above were weighed and introduced into test tubes along with 10 ml of water, sealed and lightly shaken. After 48 hours, the corresponding quantities of Pluronic F127 were added to the test tubes, sealed and lightly shaken. Before optical analysis, all samples were placed in ultrasonic cleaner for 30 minutes. A drop from each sample were placed on microscope slides and viewed with the microscope.
3.2.1.3. MCC with CTAB
As there was not sufficient information on the optimal percentages of CTAB to MCC, the optical analysis of MCC with CTAB was done in three phases (Table 5):
Table 5 - Three phases analysed
Phase 1 Percentage of CTAB constant (20% CTAB w.r.t. MCC) and three different percentages of MCC (0.4%, 1.0% and 1.5% w.r.t. water)
Phase 2 Percentage of MCC constant (1.0% MCC w.r.t. water) and four different percentages of CTAB (40%, 60%, 80% and 100% w.r.t. MCC)
Phase 3 Percentage of CTAB constant (40% CTAB w.r.t. MCC) and three different percentages of MCC (0.4%, 1.0% and 1.5% w.r.t. water)
Phase 1 – Varying MCC + 20% CTAB
The percentage of CTAB used was 20% w.r.t. MCC. The quantities of CTAB were calculated and are presented on Table 6.
Table 6 - Amount of MCC and CTAB
Percentage of MCC Quantity of MCC Quantity of CTAB
0.4% 0.08 g 0.016 g
1.0% 0.2 g 0.04 g
1.5% 0.3 g 0.06 g
The quantities of MCC shown above were weighed and introduced into test tubes along with 20 ml of water, sealed and lightly shaken. After 48 hours, the corresponding quantities of CTAB were added to the test tubes, sealed and lightly shaken. Before optical analysis, all samples were placed in ultrasonic cleaner for 30 minutes. A drop from each sample were placed on microscope slides and viewed with the microscope.
Phase 2 – 1% MCC + Varying CTAB
The percentage of MCC used was 1.0% w.r.t. water (0.1 g). The quantities of CTAB were calculated and are presented on Table 7.
Table 7 - Amount of CTAB
Percentage of CTAB Quantity of CTAB
40% 0.04 g
60% 0.06 g
80% 0.08 g
100% 0.1 g
The quantity of MCC, 0.1 g, was weighed and introduced into four test tubes along with 10 ml of water, sealed and lightly shaken. After 48 hours, the quantities of CTAB shown on the table above were added to the test tubes, sealed and lightly shaken. Before optical analysis, all samples were placed in ultrasonic cleaner for 30 minutes. A drop from each sample were placed on microscope slides and viewed with the microscope.
Phase 3 – Varying MCC + 40% CTAB
The percentage of CTAB used was 40% w.r.t. MCC. The quantities of CTAB were calculated and are presented on Table 8.
Table 8 - Amount of MCC and CTAB Percentage of MCC Quantity of MCC w.r.t. 10 ml of water Quantity of CTAB w.r.t. MCC 0.4% 0.04 g 0.016 g 1.5% 0.15 g 0.06 g
The quantities of MCC shown above were weighed and introduced into test tubes along with 10 ml of water, sealed and lightly shaken. After 48 hours, the corresponding quantities of CTAB were added to the test tubes, sealed and lightly shaken. Before optical analysis, all samples were placed in ultrasonic cleaner for 30 minutes. A drop from each sample were placed on microscope slides and viewed with the microscope.
3.2.1.4. Sisal Fibres
The sisal fibres were cut into lengths of 20 mm in order to facilitate viewing. The fibres were placed on microscope slides and viewed with the microscope.
3.2.2. UV Analysis of MCC
The UV-VISIBLE Recording Spectrophotometer (UV-2401PC) was used to perform the UV analysis of MCC.
In addition to the samples, to perform this analysis it is necessary to make reference samples. The reference samples are aqueous solutions containing the same concentration of surfactant used to disperse the MCC in order to remove any peak generated by the reference samples during UV-Vis analysis. These reference samples were made 48 hours before UV analysis. In the case were no surfactant was used, the reference sample was distilled water.
After all the system checks were concluded, the type of experiment mode was chosen (Spectrum). Spectrum mode is used for wavelength scanning over a continuous wide range. Mode chosen it was necessary to set up the acquisition patterns, such as wavelength range (1000 to 190 nm) and measuring mode (Absorption). Next the baseline was created by filling the two cells with the reference samples, putting the cells in the respective holders and clicking Baseline on the computer (Figure 5).
Figure 5 - Print from UV-2401PC
Baseline done, the sample cell was filled (Figure 6) with the first sample (reference cell was not touched) and by clicking on Start, the spectrum started getting collected. This process, creating baseline then spectrum, was repeated every time a reference sample was changed.
3.2.3. Tensile Behaviour of Sisal Fibres
To determine the tensile behaviour of sisal fibre three steps were followed: Step 1 – Sample preparation;
Step 2 – Determination of the linear mass; Step 3 – Tensile testing.
Step 1 – Sample preparation
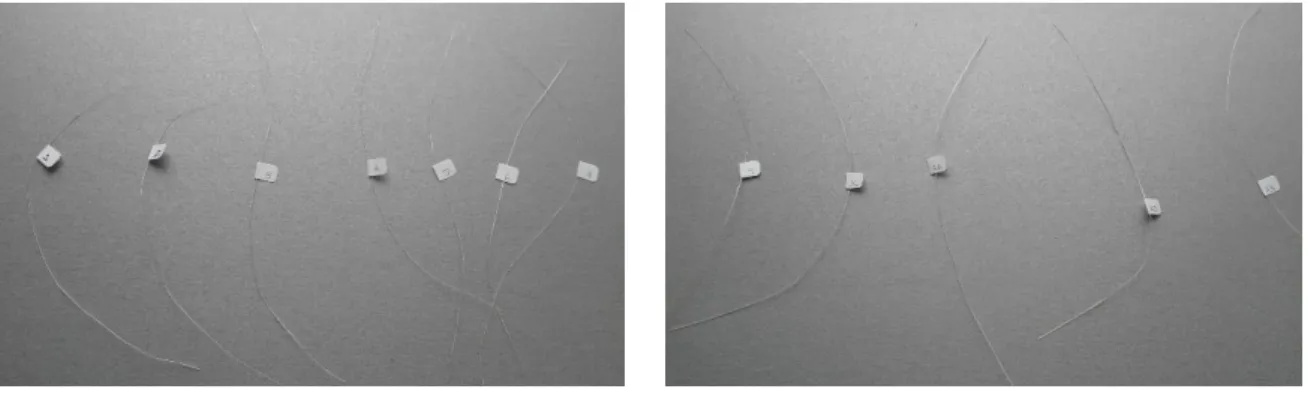
50 samples of sisal fibres were cut into 20 cm lengths. Each sample was labelled, from 1 to 50, as presented in figures 7 and 8.
Figure 7 - Samples 1 to 7 Figure 8 - Samples 9 to 13
Step 2 - Linear Mass Determination
Having prepared the samples, the next step was to determine the linear mass (LM) of each fibre (Eq. 1). For that reason, each fibre was weighed and had its length in tension measured. The length of the fibre in tension was obtained with the use of a measuring in tension equipment (Figure 9).
𝐿𝑀 (𝑇𝑒𝑥) = 𝐹𝑖𝑏𝑟𝑒 𝑤𝑒𝑖𝑔ℎ𝑡 (𝑔)
Figure 9 – Equipment used to measure in tension
Linear mass of the samples was determined considering the results obtained. Linear mass was determined because it is one of the parameters needed, to introduce in the software, in order to obtain tensile strength of the fibres.
Step 3 - Tensile testing
The equipment used for tensile testing was the H100KS Hounsfield Universal Testing Instrument (Figure 10). The samples were placed, one by one, in the clamps (Figure 11 and 12) and after the introduction of the linear mass of the particular sample, the testing began.
Figure 10 - Tensile strength testing machine Figure 11 - Sample in use
3.2.4. Development of Cementitious Composites
The objective of this research work was to analyse if the addition of MCC and sisal fibres into a cementitious composite would show improvement over a plain cementitious composite. In order to do so three types of cementitious composites were analysed, ones containing MCC, others containing sisal and still others containing sisal and MCC. The intension was to study which samples had the best results and try to understand why.
Several percentages of MCC (0.2%, 0.5% and 0.75% w.r.t. cement) and sisal (0.25% and 0.5% w.r.t. cement) were studied, as well as different surfactants. Because MCC is insoluble in water the use of a surfactant came into question. So, for each cementitious composite combination used there were three different samples, one containing Pluronic F-127, one containing CTAB and another with no surfactant. Sisal fibres were cut into segments with 20 mm of length.
Therefore, twenty-seven samples were analysed. One plain mortar, eight without surfactant, eight with Pluronic F-127 and ten with CTAB. 20% of Pluronic F-127 w.r.t. MCC was used as it is the optimal percentage according to literature. The percentage of CTAB required some analysis as there does not exist sufficient literature on the matter. 100% CTAB was used before optical and UV analysis could be accomplished and as the cementitious composites (with 100% CTAB) appeared visually very porous, when 40% CTAB showed the best results in UV analysis, the percentage of CTAB was altered from 100% to 40%. Tables 9, 10, 11 and 12 contain the samples studied according to surfactant use and percentage combination used of MCC and sisal.
Table 9 - Samples studied without surfactant No Surfactant
01. Plain cementitious mortar
02. Cementitious mortar reinforced with 0.2% MCC w.r.t. cement 03. Cementitious mortar reinforced with 0.5% MCC w.r.t. cement 04. Cementitious mortar reinforced with 0.75% MCC w.r.t. cement 05. Cementitious mortar reinforced with 0.25% Sisal w.r.t. cement 06. Cementitious mortar reinforced with 0.5% Sisal w.r.t. cement
07. Cementitious mortar reinforced with 0.25% Sisal w.r.t. cement + 0.2% MCC w.r.t. cement 08. Cementitious mortar reinforced with 0.25% Sisal w.r.t. cement + 0.5% MCC w.r.t. cement 09. Cementitious mortar reinforced with 0.25% Sisal w.r.t. cement + 0.75% MCC w.r.t. cement
Table 10 - Samples studied with 20% Pluronic F-127 20% Pluronic F-127 w.r.t. MCC
01. Cementitious mortar reinforced with 0.2% MCC w.r.t. cement 02. Cementitious mortar reinforced with 0.5% MCC w.r.t. cement 03. Cementitious mortar reinforced with 0.75% MCC w.r.t. cement 04. Cementitious mortar reinforced with 0.25% Sisal w.r.t. cement 05. Cementitious mortar reinforced with 0.5% Sisal w.r.t. cement
06. Cementitious mortar reinforced with 0.25% Sisal w.r.t. cement + 0.2% MCC w.r.t. cement 07. Cementitious mortar reinforced with 0.25% Sisal w.r.t. cement + 0.5% MCC w.r.t. cement 08. Cementitious mortar reinforced with 0.25% Sisal w.r.t. cement + 0.75% MCC w.r.t. cement
Table 11 - Samples studied with 100% CTAB 100% CTAB w.r.t. MCC
01. Cementitious mortar reinforced with 0.25% Sisal w.r.t. cement + 0.2% MCC w.r.t. cement 02. Cementitious mortar reinforced with 0.25% Sisal w.r.t. cement + 0.5% MCC w.r.t. cement
Table 12 - Samples studied with 40% CTAB 40% CTAB w.r.t. MCC
01. Cementitious mortar reinforced with 0.2% MCC w.r.t. cement 02. Cementitious mortar reinforced with 0.5% MCC w.r.t. cement 03. Cementitious mortar reinforced with 0.75% MCC w.r.t. cement 04. Cementitious mortar reinforced with 0.25% Sisal w.r.t. cement 05. Cementitious mortar reinforced with 0.5% Sisal w.r.t. cement
06. Cementitious mortar reinforced with 0.25% Sisal w.r.t. cement + 0.2% MCC w.r.t. cement 07. Cementitious mortar reinforced with 0.25% Sisal w.r.t. cement + 0.5% MCC w.r.t. cement 08. Cementitious mortar reinforced with 0.25% Sisal w.r.t. cement + 0.75% MCC w.r.t. cement
3.2.4.1. Cementitious Composites without Surfactant
The materials used to develop this part of the work include: Portland cement, sand, water, MCC and sisal fibres. The ratio used for cement/sand/water was 1/3/0.5.
Table 13 contains the quantities of the materials used in the samples. The sisal fibres used had 20 mm of length.
Table 13 - Quantities of each material for sample preparation
Description Quantity Description Quantity w.r.t. cement
Cement 450 g 0.2% MCC 0.9 g
Water 225 ml 0.5% MCC 2.25 g
Sand 1350 g 0.75% MCC 3.375 g
0.25% Sisal w.r.t. cement 1.125 g 0.5% Sisal 2.25 g
Dispersion of MCC in water
Samples containing MCC had to be prepared 48 hours in advance, in order to allow MCC particles to swell in the water. Accordingly, the quantities of MCC required were added to the distilled water (225 ml), sealed and mixed in the magnetic stirrer for 15 minutes.
If the sample contained MCC, before mixing the mortar, the water containing MCC previously prepared, was mixed with the magnetic stirrer for fifteen minutes followed by fifteen minutes in the ultra-sonication machine. Subsequently, the water was kept on the magnetic stirrer until it was time to add to cement.
Preparation of cementitious composites
All the samples were prepared in a similar manner, differing only in the use or not of MCC and sisal fibres. Using a Hobart mixer, the cement was mixed with the water (containing or not MCC, according to the sample being made), after which the sand was added, followed by the sisal fibre if required in the sample. The mortar was mixed for 3 minutes. Figure13 shows an image of the Hobart mixer used throughout this work.
3.2.4.2. Cementitious Composites with Pluronic F-127
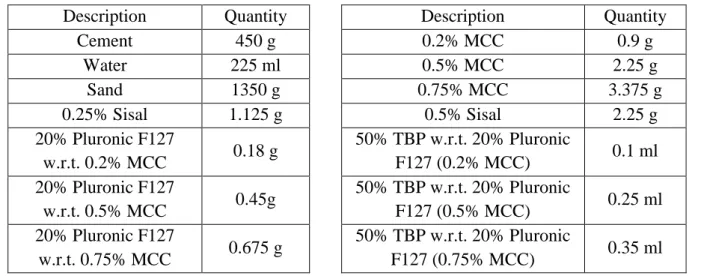
The materials used to develop this part of the work include: Portland cement, sand, water, MCC, sisal fibres, Pluronic F-127 and TBP. The ratio used for cement/sand/water was 1/3/0.5.
Table 14 contains the quantities of the materials used in the samples. The sisal fibres used had 20 mm of length.
Table 14 - Quantities of each material for sample preparation
Description Quantity Description Quantity
Cement 450 g 0.2% MCC 0.9 g Water 225 ml 0.5% MCC 2.25 g Sand 1350 g 0.75% MCC 3.375 g 0.25% Sisal 1.125 g 0.5% Sisal 2.25 g 20% Pluronic F127 w.r.t. 0.2% MCC 0.18 g 50% TBP w.r.t. 20% Pluronic F127 (0.2% MCC) 0.1 ml 20% Pluronic F127 w.r.t. 0.5% MCC 0.45g 50% TBP w.r.t. 20% Pluronic F127 (0.5% MCC) 0.25 ml 20% Pluronic F127 w.r.t. 0.75% MCC 0.675 g 50% TBP w.r.t. 20% Pluronic F127 (0.75% MCC) 0.35 ml
Dispersion of MCC/Pluronic F-127 in water
The samples that contained MCC had to be prepared in advance in order to allow the MCC particles to swell in the water. Accordingly, 96 hours before making the samples the quantities of MCC required were added to the distilled water (225 ml), sealed and mixed in the magnetic stirrer for 15 minutes. After 48 hours, the required quantities of Pluronic F-127 and TBP were added to the MCC infused water and mixed in the magnetic stirrer for fifteen minutes.
If the sample contained MCC, before mixing the mortar, the water containing MCC previously prepared, was stirred with the magnetic stirrer for fifteen minutes followed by fifteen minutes in the sonication machine. Subsequently, the water was kept on the magnetic stirrer until it was time to add to cement.
If the sample did not contain MCC, 48 hours before making them, Pluronic F-127 and TBP were added to the water (225 ml) and mixed in the magnetic stirrer for fifteen minutes. This process was done in order to create consistency in the samples.
Preparation of cementitious composites
All the samples were prepared in a similar manner, differing only in the use or not of MCC and sisal fibres. Using a Hobart mixer, the cement was mixed with the water (containing or not MCC and Pluronic F127, according to the sample being made), after which the sand was added, followed by the sisal fibre if required in the sample. The mortar was mixed for 3 minutes.
3.2.4.3. Cementitious Composites with CTAB
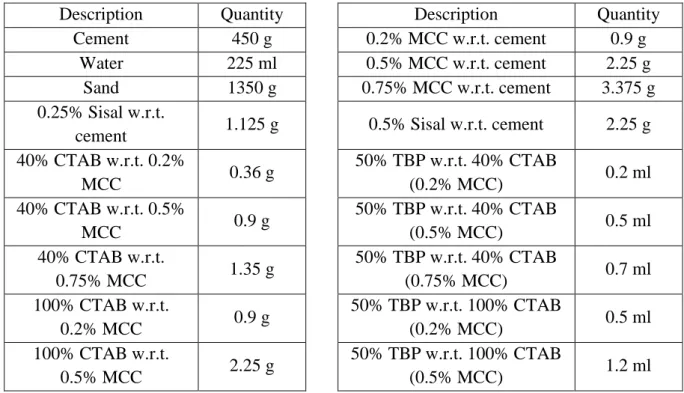
The materials used to develop this part of the work include: Portland cement, sand, water, MCC, sisal fibres, CTAB and TBP. The ratio used for cement/sand/water was 1/3/0.5.
Table 15 contains the quantities of the materials used in the samples. The sisal fibres used had 20 mm of length.
Table 15 - Quantities of each material for sample preparation
Description Quantity Description Quantity
Cement 450 g 0.2% MCC w.r.t. cement 0.9 g
Water 225 ml 0.5% MCC w.r.t. cement 2.25 g
Sand 1350 g 0.75% MCC w.r.t. cement 3.375 g
0.25% Sisal w.r.t.
cement 1.125 g 0.5% Sisal w.r.t. cement 2.25 g 40% CTAB w.r.t. 0.2% MCC 0.36 g 50% TBP w.r.t. 40% CTAB (0.2% MCC) 0.2 ml 40% CTAB w.r.t. 0.5% MCC 0.9 g 50% TBP w.r.t. 40% CTAB (0.5% MCC) 0.5 ml 40% CTAB w.r.t. 0.75% MCC 1.35 g 50% TBP w.r.t. 40% CTAB (0.75% MCC) 0.7 ml 100% CTAB w.r.t. 0.2% MCC 0.9 g 50% TBP w.r.t. 100% CTAB (0.2% MCC) 0.5 ml 100% CTAB w.r.t. 0.5% MCC 2.25 g 50% TBP w.r.t. 100% CTAB (0.5% MCC) 1.2 ml
Dispersion of MCC/CTAB in water
The samples that contained MCC had to be prepared in advance in order to allow the MCC particles to swell in the water. Accordingly, 96 hours before making the samples the quantities of MCC required were added to the distilled water (225 ml), sealed and mixed in the magnetic
stirrer for 15 minutes. After 48 hours, the required quantities of CTAB and TBP were added to the MCC infused water and mixed in the magnetic stirrer for fifteen minutes (Figure 14 and 15).
Figure 14 – Sample 1 on magnetic stirrer [0,4% MCC w.r.t. water]
Figure 15 – Sample 2 on magnetic stirrer [1,0% MCC w.r.t. water]
If the sample contained MCC, before mixing the mortar, the water containing MCC previously prepared, was mixed with the magnetic stirrer for fifteen minutes followed by fifteen minutes in the sonication machine. Subsequently, the water was kept on the magnetic stirrer until it was time to add to cement.
If the sample did not contain MCC, 48 hours before making them, CTAB and TBP were added to the water (225 ml) and mixed in the magnetic stirrer for fifteen minutes. This process was done in order to create consistency in the samples. The percentages of CTAB and TBP used were the lowest percentages used in the MCC samples (40% CTAB in regards to 0,2% MCC).
Preparation of cementitious composites
All the samples were prepared in a similar manner, differing only in the use or not of MCC and sisal fibres. Using a Hobart mixer, the cement was mixed with the water (containing or not MCC and CTAB, according to the sample being made), after which the sand was added, followed by the sisal fibre if required in the sample. The mortar was mixed for 3 minutes.
3.2.5. Flow Table Test
This test was done according to the norm EN 1015-3 with the objective of measuring the workability of the cement past. After well mixed the workability of the mortar was tested using the flow table test. The cementitious mixture was placed into the cylindrical mould in two layers taped ten times with a cylindrical rod. When the top layer was level with the top of the mould any excess was cleaned off. After lifting the cylinder, the mixture was allowed to spread on the table and, following fifteen lifts and drops of the table, the diameter of the cementitious mixture was measured twice, according to figures 16, 17, 18 and 19.
Figure 16 - Workability test Figure 17 - Workability test
Figure 18 – Measuring workability
Some samples obtained less than 165 mm in the fluidity test so superplasticizer (SP) was added to increase fluidity. 0.5 ml of superplasticizer were added to the samples until fluidity was above 165 mm.
The fluidity test done, the mixtures were placed in moulds with 160x40x40 mm3. The filled moulds were subjected to sixty blows in order to compact the mixture (Figure 20).
Figure 20 - Compacting machine
The samples were kept in a hydration chamber for 48 hours, after which they were demoulded (Figure 21 and 22) and placed in water for 26 days.
3.2.6. Flexural Strength Testing
A LLOYD LR50K Plus machine was used to perform the flexural testing of the samples. This testing was done according to the procedures described in the norm EN 1015-11 (1999). Before testing, samples were weighed and two lines were drawn on the bottom face of the samples, on each side, 3 cm from the edge, as shown in Figure 23.
Figure 23 - Sample
These lines were drawn in order to facilitate the placement of the samples in the machine. Each sample was placed in the machine, coinciding the lines drawn with the two knife-edge points (distanced 10 cm from each other), as shown in the figure bellow. After well placed (Figure 24), the samples were subjected to increasing loads at the midpoint of the sample until break occurred.
Figure 24 - Flexural testing
Maximum stress and strain were calculated on the incremental load applied. The results from the flexural testing were displayed in a graphical format with tabular results.
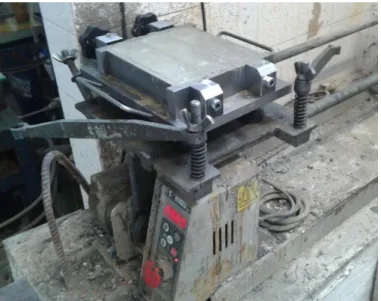
3.2.7. Compressive Strength Testing
The ELE AutoTest 2000 BS compression machine (Figure 25 and 26) was used to perform the compressive testing of the samples. This testing was also done according to the norm EN 1015-11 (1999), mentioned above.
Figure 25 - Compressive machine
Figure 26 - Compressive machine (close-up)
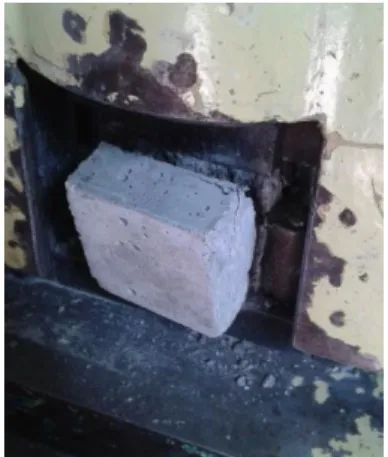
As the samples were already subjected to flexural testing, two parts of each sample (Figure 27) were available for compressive testing.
Figure 27 - Sample 2.2 after flexural testing
Each sample was placed in the compressive machine, as shown in Figure 28, and subjected to increasing loads until break occurred (Figure 29).
Chapter 4 -
R
ESULTS ANDB
EHAVIOURA
NALYSIS4.1. Optical Analysis
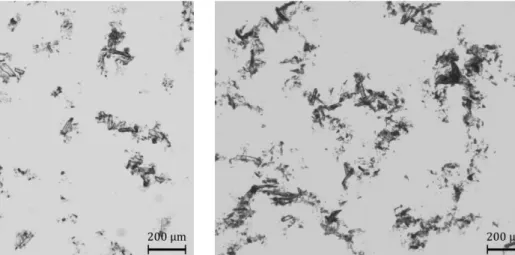
4.1.1. MCC without Surfactant
The analysis was done using the 3,3x eye piece and the objective at 4x. The results are shown in Figures 30, 31 and 32.
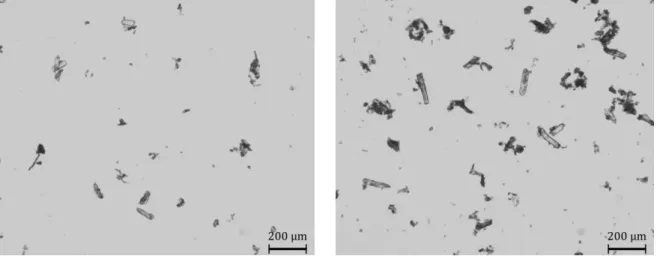
Figure 30 - 0.4% MCC Figure 31 – 1.0% MCC
According to the figures the sample containing 1.5% MCC has a higher agglomeration of MCC particles while 0.4% MCC has a more disperse distribution. The MCC particles in Figure 31 (1.0% MCC w.r.t. water) seem more evenly distributed within the solution than the particles in Figure 32 (1.5% MCC w.r.t. water).
4.1.2. MCC with Pluronic F-127
The analysis was done using the 3,3x eye piece and the objective at 4x. The results can be viewed in figures 33, 34 and 35.
Figure 33 - 0.4% MCC + Pluronic F127 Figure 34 - 1.0% MCC + Pluronic F127
Figure 35 - 1.5% MCC + Pluronic F127
According to the figures, the samples containing 1.5% MCC have the highest agglomeration of MCC, although the sample containing 1.0% also has a high agglomeration, not much lower
than the 1.5% sample. Furthermore, Figure 35 (1.5% MCC) also has the higher number of disperse MCC particles.
4.1.3. MCC with CTAB
Phase 1 – Varying MCC + 20% CTAB
The analysis was done using the 1.67x eye piece and the objective at 10x. The results can be viewed in figures 36, 37 and 38.
Figure 36 – 0.4% MCC + CTAB Figure 37 – 1.0% MCC + CTAB
Figure 38 – 1.5% MCC + CTAB
Figure 36 (0.4% MCC) shows very disperse MCC particles. Higher concentrations (1.0% and 1.5% MCC) obtained bigger and more intact MCC particles (less break of the particles). 1.0% MCC have less dispersion than 0.4% and 1.5% MCC.
Phase 2 – 1% MCC + Varying CTAB
The analysis was done using the 3,3x eye piece and the objective at 4x. The results can be viewed in figures 39 to 42.
Figure 39 – 1.0% MCC + 40% CTAB Figure 40 – 1.0% MCC + 60% CTAB
Figure 41 – 1.0% MCC + 80% CTAB Figure 42 – 1.0% MCC + 100% CTAB
The sample containing 80% CTAB appears to have a higher concentration of MCC, as well as more agglomerations, than the other percentages. The sample with 60% CTAB seems to its particles more evenly dispersed, few agglomerations (Figure 40). 40% CTAB present the least amount of agglomerations.
Phase 3 – Varying MCC + 40% CTAB
The analysis was done using the 3,3x eye piece and the objective at 4x. The results can be viewed in figures 43 and 44.
Figure 43 - 0.4% MCC +CTAB Figure 44 - 1.5% MCC + CTAB
According to the figures the MCC particles appear very disperse, although 1.5% MCC show some agglomerations. The sample with 1.5% MCC has more particles than 0.4%, which is expected.
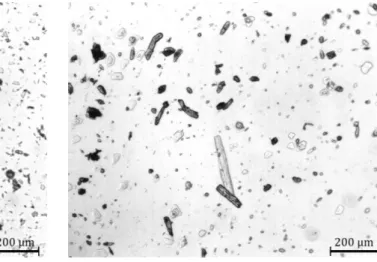
4.1.4. Sisal Fibres
Using the 1,67x eye piece and the objective at 4x, figures 45 to 47 were obtained.
Figure 45 – Sisal_1 Figure 46 – Sisal_2
Sisal fibres were also characterized by stereoscopic analysis. The eye piece used was 1,67 and the objective was at 2x.
Figure 48 – Sisal_4 Figure 49 – Sisal_5
Figure 50 – Sisal_6 Figure 51 – Sisal_7
From the images obtained, it is clear that the thickness of sisal fibres varies greatly which is expected in natural fibres. The surface texture of these fibres vary as some appear smooth while others show irregularities. Through the stereoscopic images (Figures 48, 49, 50 and 51) it can be seen that these fibres are quite fibril.
These variations found in sisal fibres could affect the results when incorporated into the cementitious composite.
4.2. UV Analysis
4.2.1. MCC without Surfactant
The objective of this analysis was learn which percentage of MCC had the best absorption results in water because it is expected that percentage will lead to a more evenly distribution of MCC in the cementitious matrix.
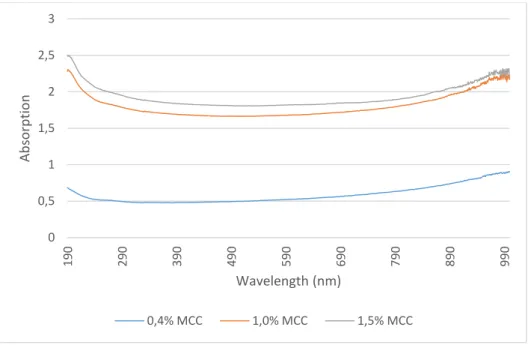
Figure 52 shows the results obtained from the UV analysis of three different percentages of MCC, 0.4%, 1.0% and 1.5%, without surfactant.
Figure 52 - Spectrum obtained for Varying Percentages of MCC
According to the figure, 0.4% MCC obtained the lowest values for absorption. The percentage of MCC that shows the best results is 1.5%, although 1.0% showed very close results. This was the expected result because as MCC is insoluble in water, the best result would be the sample with the highest percentage.
4.2.2. MCC with Pluronic F-127
The purpose of this analysis was learn which percentage of MCC had the optimal result when used combined with Pluronic F-127. In order to do so three different percentages of MCC,
0 0,5 1 1,5 2 2,5 3 190 290 390 490 590 690 790 890 990 Ab so rp tio n Wavelength (nm) 0,4% MCC 1,0% MCC 1,5% MCC
0.4%, 1.0% and 1.5% w.r.t. water, with 20% of the surfactant Pluronic F127 were analysed. Figure 53 shows the results obtained.
Figure 53 - Spectrum obtained for Varying Percentages of MCC + 20% Pluronic F127
According to Figure 53, 0.4% MCC obtained the lowest absorption values. 1.0% and 1.5% MCC show similar results, which indicates the use of higher percentages than 1.0% MCC is not advantageous. The optimal percentage of MCC for 20% Pluronic F-127 is 1.0%.
4.2.3. MCC with CTAB
In order to evaluate the best percentage of CTAB to add to MCC, four different percentages of CTAB (40%, 60%, 80%, 100%) were analysed with regards to 1.0% of MCC (0.1 g). Figure 54 shows the results obtained from the UV analysis.
2 2,5 3 3,5 4 4,5 5 5,5 190 290 390 490 590 690 790 890 990 Ab so rp tio n Wavelength (nm) 0,4% MCC 1,0% MCC 1,5% MCC
Figure 54 - Spectrum obtained for 1.0% MCC + Varying Percentages of CTAB
Through Figure 54 it can be concluded that the sample with 40% CTAB shows the highest absorption. This being the case, 40% CTAB was then analysed with three different percentages of MCC, 0.4%, 1.0% and 1.5%, in order to obtain the optimal percentage mix of MCC and CTAB. Figure 55 shows the results obtained from the UV analysis.
Figure 55 - - Spectrum obtained for Varying Percentages of MCC + 40% CTAB
According to the figure, 0.4% MCC shows the overall best result which means that 0.4% MCC is the optimal percentage to use with 40% of the surfactant CTAB.
-0,4 -0,3 -0,2 -0,1 0 0,1 0,2 0,3 0,4 0,5 0,6 190 290 390 490 590 690 790 890 990 Ab so rp tio n Wavelength (nm)
40% CTAB 60% CTAB 80% CTAB 100% CTAB
-0,5 0 0,5 1 1,5 2 2,5 3 190 290 390 490 590 690 790 890 990 Ab so rp tio n Wavelength (nm) 0,4% MCC 1,0% MCC 1,5% MCC
4.3. Tensile Behaviour of Sisal Fibres
Tensile strength is the maximum stress that a material can handle before breaking.
Doing an average of the maximum load acquired from the testing of the 50 samples, the average tensile stress attained is 0.325 N/Tex. The coefficient of variation obtained was 25%.
The maximum load obtained was 33.60 N with an average of 13.01 N.
The average elongation at break was 4.08% and the maximum elongation at break was 10.90%.
More detailed information on the results obtained for tensile testing of the sisal fibres can be found in Attachment 4.
4.4. Flow Table Test
4.4.1. Cementitious Composites without Surfactant
Table 16 contains the results obtained from the workability test.
Table 16 - Results from workability test (without surfactant)
Sample Measurement 1 Measurement 2
Plain Mortar 189 mm 187 mm 0.2% MCC + 0.5 ml of SP 168 mm 167 mm 0.5% MCC + 1.0 ml of SP 169 mm 169 mm 0.75% MCC + 0.5 ml of SP 169 mm 174 mm 0.25% Sisal 170 mm 170 mm 0.5% Sisal 169 mm 170 mm 0.25% Sisal + 0.2% MCC 168 mm 168 mm 0.25% Sisal + 0.5% MCC + 1.0 ml of SP 177 mm 181 mm 0.25% Sisal + 0.75% MCC + 0.5 ml of SP 166 mm 165 mm
The inclusion of MCC in the cementitious matrix led to a decrease in the flow parameter, whether it was in the cementitious composites containing only MCC or the ones containing both sisal and MCC. The addition of sisal fibres did not cause any major changes in the workability of the reinforced cementitious matrix.
4.4.2. Cementitious Composites with Pluronic F-127
After well mixed the workability of the mortar was tested, using the same method previously described. Table 17 contains the results from the test.
Table 17 - Results from workability test (with Pluronic F-127)
Sample Measurement 1 Measurement 2
Plain Mortar 189 mm 187 mm 0.2% MCC + 0.5 ml of SP 198 mm 197 mm 0.5% MCC + 0.5 ml of SP 170 mm 170 mm 0.75% MCC + 0.5 ml of SP 170 mm 169 mm 0.25% Sisal 181 mm 179 mm 0.5% Sisal 172 mm 169 mm 0.25% Sisal + 0.2% MCC 178 mm 171 mm 0.25% Sisal + 0.5% MCC 175 mm 171 mm 0.25% Sisal + 0.75% MCC 172 mm 171 mm
The addition of MCC in the cementitious matrix led to a decrease of workability when used individually but did not affect majorly when added with sisal. Also, the use of Pluronic F-127 seems to have led to an increase in the flow parameter. Again, there were no major changes in the workability when sisal is added to the cementitious matrix.
4.4.3. Cementitious Composites with CTAB
After well mixed the workability of the mortar was tested, using the same method previously described. Tables 18 and 19 contain the results from the workability test using 40% and 100% CTAB, respectively.
Table 18 - Results from workability test (with 40% CTAB)
Sample Measurement 1 Measurement 2
Plain Mortar 189 mm 187 mm 0.2% MCC 188 mm 189 mm 0.5% MCC 167 mm 166 mm 0.75% MCC 185 mm 190 mm 0.25% Sisal 181 mm 186 mm 0.5% Sisal 192 mm 188 mm 0.25% Sisal + 0.2% MCC 174 mm 173 mm 0.25% Sisal + 0.5% MCC 178 mm 182 mm 0.25% Sisal + 0.75% MCC 172 mm 177 mm
Table 19 - Results from workability test (with 100% CTAB)
Sample Measurement 1 Measurement 2
Plain Mortar 189 mm 187 mm
0.25% Sisal + 0.2% MCC 169 mm 170 mm
0.25% Sisal + 0.5% MCC 183 mm 187 mm
The use of CTAB appears to have led to an increase in the flow parameter, which means the use of superplasticizer was not required in any of the cementitious composites.
The composites containing MCC, for the most part have increased but curiously the one with 0.5% MCC did not increase as greatly when compared to lower and higher percentages (0.2% and 0.75% MCC w.r.t. cement).
4.5. Flexural Strength Testing
4.5.1. Cementitious Composites Reinforced without Surfactant
Figure 56 and Table 20 contain the results of the flexural strength testing of the samples made without use of surfactant.
Figure 56 - Flexural strength of reinforced mortar without surfactant
-1 0 1 2 3 4 5 6 7 8 9 -0,002 0 0,002 0,004 0,006 0,008 0,01 0,012 0,014 0,016 Stre ss (M Pa) Strain (%) Plain Mortar 0,2% MCC 0,5% MCC 0,75% MCC 0,25% Sisal 0,5% Sisal
Table 20 - Flexural strength of reinforced mortar without surfactant
Sample Maximum Load
(N) Maximum Stress (MPa) % Improv. Strain (%) Plain Mortar 3082.66 7.22 0.00 0.0134 0.2% MCC 2953.19 6.92 -4.20 0.0060 0.5% MCC 3432.27 8.04 11.34 0.0081 0.75% MCC 2883.17 6.76 -6.47 0.0055 0.25% Sisal 2754.96 6.46 -10.63 0.0078 0.5% Sisal 3156.02 7.40 2.38 0.0101 0.25% Sisal + 0.2% MCC 2611.53 6.12 -15.28 0.0063 0.25% Sisal + 0.5% MCC 2677.03 6.27 -13.16 0.0059 0.25% Sisal + 0.75% MCC 2598.54 6.09 -15.70 0.0142
The figure clearly shows that the sample containing 0.5% MCC obtained the highest flexural stress (8.04 MPa). The addition of MCC in the cementitious composites has led to an increase of stiffness.
0.5% sisal also obtained a good stress result when compared with the plain mortar. The addition of sisal fibres achieved higher ductility of the cementitious matrix when compared with MCC reinforced cementitious composites. Moreover, it is enhancing the post peak load bearing capacity of cementitious matrix.
The cementitious composite reinforced with 0.25% sisal and 0.75% MCC w.r.t. cement (multiscale cementitious composite) resulted in a highly ductile cementitious composite with a similar curve to the plain cement mortar (reference sample) but with lower strength values.
4.5.2. Cementitious Composites Reinforced with Pluronic F-127
Figure 57 and Table 21 contain the results obtained for flexural strength of the samples made using the surfactant Pluronic F-127.
Figure 57 - Flexural strength of reinforced mortar with Pluronic F127
Table 21 - Flexural strength of reinforced mortar with Pluronic F127
Sample Maximum Load
(N) Maximum Stress (MPa) % Improv. Strain (%) Plain Mortar 3082.66 7.22 0.00 0.0134 0.2% MCC 2809.26 6.58 -8.87 0.0059 0.5% MCC 4061.87 9.52 31.74 0.0068 0.75% MCC 2644.53 6.20 -14.21 0.0064 0.25% Sisal 2942.68 6.90 -4.54 0.0070 0.5% Sisal 2799.36 6.56 -9.19 0.0088 0.25% Sisal + 0.2% MCC 2832.35 6.64 -8.12 0.0126 0.25% Sisal + 0.5% MCC 2735.79 6.41 -11.25 0.0126 0.25% Sisal + 0.75% MCC 2505.19 5.87 -18.73 0.0108
Stiffness has increased with the addition of MCC in all MCC reinforced cementitious composites. 0.5% MCC has the highest stress with 9.52 MPa.
Again, the cementitious composites with sisal fibres have higher ductility than MCC reinforced cementitious composites. -1 1 3 5 7 9 -0,002 0 0,002 0,004 0,006 0,008 0,01 0,012 0,014 0,016 0,018 0,02 Stres s (MPa) Strain (%) Plain Mortar 0,2% MCC 0,5% MCC 0,75% MCC 0,25% Sisal 0,5% Sisal
4.5.3. Cementitious Composites Reinforced with 100% CTAB
Figure 58 and Table 22 display the results for flexural strength for the samples made using the 100% of the surfactant CTAB.
Figure 58 - Flexural strength of reinforced mortar with 100% CTAB
Table 22 - Flexural strength of reinforced mortar with 100% CTAB
Sample Maximum Load
(N) Maximum Stress (MPa) % Improv. Strain (%) Plain Mortar 3082.66 7.22 0.00 0.0134 0.25% Sisal + 0.2% MCC 2078.33 4.87 -32.58 0.0057 0.25% Sisal + 0.5% MCC 2349.74 5.51 -23.78 0.0061
The results for flexural strength obtained for the samples made using 100% CTAB are significantly lower than the results for the plain mortar. There is a significant increase of stiffness and therefore an increase in the flexural modulus.
Due to the low results, the next samples studied contained 40% CTAB (percentage that showed the best absorption in the UV testing of MCC).
-1 0 1 2 3 4 5 6 7 8 -0,002 0 0,002 0,004 0,006 0,008 0,01 0,012 0,014 0,016 Stre ss (M Pa) Strain (%)