Different Metabolizable Energy and Balanced
Protein Concentrations
Mail Address
Keywords Author(s)
Arrived: June/2009 Approved: August/2009
ABSTRACT
Experiment was conducted to study the effect of Metabolizable Energy (ME) and Balanced Protein (BP) on the performance of 1- to 35-day-old male and female Hubbard x Hubbard broilers. Set in a factorial arrangement, dietary treatments involved 3 levels of ME (2650, 2750, or 2850 kcal per kg diet) and 4 levels of Balanced Protein (expressed as 8.4, 9.0, 9.6, or 10.2 g Standardized Ileal Digestible lysine per kg). Each diet was fed to 5 replicate pens of 17 chicks. Dietary ME and BP did not interact for any of the parameters studied (p>0.05). The main effect of ME was significant (p<0.05) for feed intake, body weight, and feed conversion ratio at all ages. Highest ME (2850 kcal) resulted in 35 day feed intake and feed conversion ratio that was significantly (p<0.05) low compared with those fed on lower levels of ME; while 35 day body weight was significantly (p<0.05) high at 2850 kcal compared with 2650 kcal ME. Feed intake and body weight improved linearly (p<0.05) with increasing BP from 8.4 to 10.2 g per kg, while the BP did not have any effect on feed conversion ratio. Dietary combinations of ME and BP to optimize body weight and feed conversion ratio are suggested on weekly basis.
INTRODUCTION
Broilers have a remarkable capacity to achieve certain weight gain according to age by modifying voluntary feed intake when offered an array of dietary energy contents (ME; NRC 1994; Leeson et al., 1996).
In this context, the decision regarding 'optimum' dietary level of ME seems merely a function of the price of energy sources and the premium achieved for improved Feed Conversion Ratio (FCR).
The requirements of broilers for various amino acids during different growout phases have been extensively studied. In general, two methodologies have been used to study the responses to individual amino acids: graded supplementation (Mack et al., 1999; Baker et al., 2002; Aftab et al., 2007) and diet dilution (Gous & Morris 1985). The common
aspect between these two techniques is that, except for the amino acid under investigation, amino acids are supplied in large excess. In commercial feed formulation, the luxury of oversupplying amino acids is not justified. For instance, a typical broiler diet formulated with crystalline methionine, lysine, and threonine with no minimum Crude Protein (CP) often contains a balance, suggesting that the four or five most 'critical amino acids' are equally limiting. In current study, the response of amino acids in terms of Balanced Protein (BP) was evaluated with an idea that it conforms more closely to the commercial dietary conditions where large excess of essential and non-essential amino acids is avoided.
Aftab U
Sadiq Poultry (Pvt) Ltd. Rawalpindi, Pakistan
Usama Aftab
E-mail: [email protected]
MATERIALS AND METHODS
General
A total of 2000 male and female day-old chicks (Hubbard x Hubbard) were obtained from a commercial hatchery. After provided free access to drinking water for four hours, chicks were individually weighed and distributed into three weight categories. Out of the intermediate-weight category, discarding the lower and higher weight groups, a total of 1020 chicks were randomly distributed to 60 floor pens (17 chicks per pen), maintaining similar cumulative body weight and range among all pens. Rice husks were used as litter (2-inche depth). Each pen was equipped with a bell drinker and a tube feeder. Feed and water were supplied ad libitum, and 24 hours of light was provided throughout the experimental period. All birds were submitted to a vaccination program (New Castle Disease, Infectious Bronchitis, Infectious Bursal Disease,
and Hydropericardium Syndrome) scheduled according to the local practice.
Diets and experimental design
Experimental diets were least-cost formulated using current ingredient prices (November 2008). Each feed ingredient was individually mixed in a batch mixer (2 tons) in order to ensure constant quality of the ingredients across experimental diets. Two basal diets were formulated to contain BP levels of 8.4 (low) or 10.2 (high) Standardized Ileal Digestible (SID) lysine and 2650 kcal ME per kg. All other EAA (essential amino acids) were set to meet or exceed the Ideal Ratios relative to lysine (Baker & Han 1994). Higher ME levels (2750 and 2850 kcal) were achieved by a two-step replacement of half or all wheat bran by sunflower oil (on weight basis), resulting in six diets (Table 1). Within each ME level, intermediate levels of BP (9.0 and 9.6 g) were prepared by blending 8.4 and 10.2 g BP diets
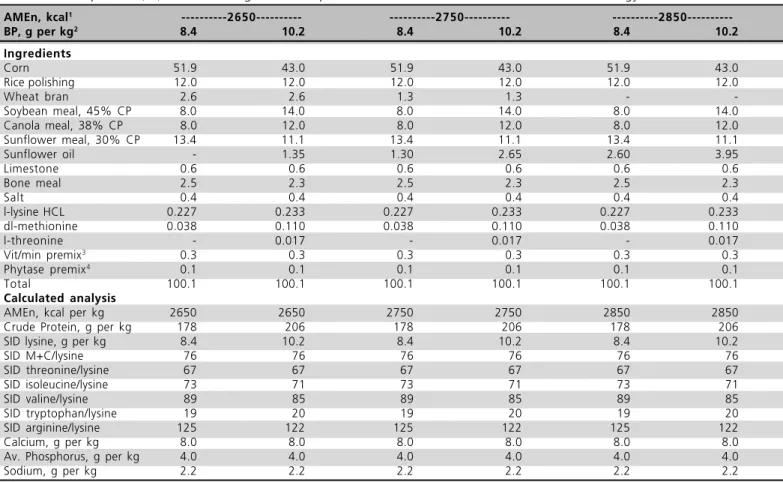
Table 1 - Composition (%) of low and high balanced protein diets at different levels of metabolizable energy.
AMEn, kcal1 ---2650--- ---2750---
---2850---BP, g per kg2 8.4 10.2 8.4 10.2 8.4 10.2
Ingredients
Corn 51.9 43.0 51.9 43.0 51.9 43.0
Rice polishing 12.0 12.0 12.0 12.0 12.0 12.0
Wheat bran 2.6 2.6 1.3 1.3 -
-Soybean meal, 45% CP 8.0 14.0 8.0 14.0 8.0 14.0 Canola meal, 38% CP 8.0 12.0 8.0 12.0 8.0 12.0 Sunflower meal, 30% CP 13.4 11.1 13.4 11.1 13.4 11.1
Sunflower oil - 1.35 1.30 2.65 2.60 3.95
Limestone 0.6 0.6 0.6 0.6 0.6 0.6
Bone meal 2.5 2.3 2.5 2.3 2.5 2.3
Salt 0.4 0.4 0.4 0.4 0.4 0.4
l-lysine HCL 0.227 0.233 0.227 0.233 0.227 0.233 dl-methionine 0.038 0.110 0.038 0.110 0.038 0.110
l-threonine - 0.017 - 0.017 - 0.017
Vit/min premix3
0.3 0.3 0.3 0.3 0.3 0.3
Phytase premix4
0.1 0.1 0.1 0.1 0.1 0.1
Total 100.1 100.1 100.1 100.1 100.1 100.1
Calculated analysis
AMEn, kcal per kg 2650 2650 2750 2750 2850 2850 Crude Protein, g per kg 178 206 178 206 178 206 SID lysine, g per kg 8.4 10.2 8.4 10.2 8.4 10.2
SID M+C/lysine 76 76 76 76 76 76
SID threonine/lysine 67 67 67 67 67 67
SID isoleucine/lysine 73 71 73 71 73 71
SID valine/lysine 89 85 89 85 89 85
SID tryptophan/lysine 19 20 19 20 19 20
SID arginine/lysine 125 122 125 122 125 122
Calcium, g per kg 8.0 8.0 8.0 8.0 8.0 8.0
Av. Phosphorus, g per kg 4.0 4.0 4.0 4.0 4.0 4.0
Sodium, g per kg 2.2 2.2 2.2 2.2 2.2 2.2
in 67:33 and 33:67 (W/W) proportions, respectively. Each diet was fed as coarse mash to 5 replicate pens of 17 chicks from 1 to 35 days posthatch. Feed intake (FI) and Body weight (BW) were recorded weekly on pen basis, and the data was used to calculate FCR (feed conversion ratio). Mortality was recorded on daily basis, and dead weight recorded to correct FCR. The obtained live performance parameters were analyzed by the General Linear Model procedures, using MINITAB release 11.12. Means were compared using Tukey's test.
RESULTS AND DISCUSSION
Dietary ME and BP interaction had no effect on any
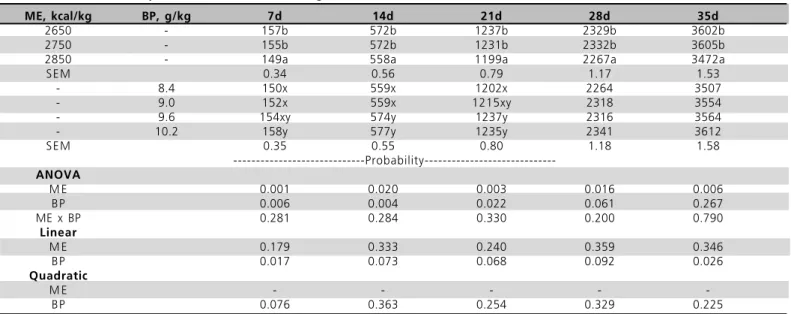
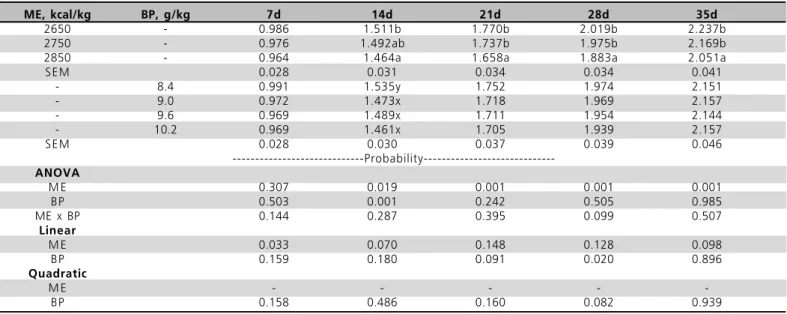
of the parameters studied (p>0.05). Main effect of ME was significant (p<0.05) for FI, BW, and FCR at all ages. High ME (2850 kcal) resulted in significantly lower 35-day FI and FCR (p<0.05) as compared with low ME level, while 35-day BW was significantly (p<0.05) higher when 2850 kcal was fed as compared with 2650 kcal ME. FI linearly responded to BP increase, where the total difference between BP extremes was about 3% in this phase. BW linearly improved up to the highest level of BP and this effect was consistent across all ages, although the magnitude of effect seemed to decrease with age (Table 3). No effect of BP was apparent on FCR (Table 4). Mortality was lower than 2.6% in all treatments, and no appreciable treatment effect was observed (data not presented).
Table 2 - Effect of dietary treatments on feed intake (g/b) of broilers, 1-35d.
ME, kcal/kg BP, g/kg 7d 14d 21d 28d 35d
2650 - 157b 572b 1237b 2329b 3602b
2750 - 155b 572b 1231b 2332b 3605b
2850 - 149a 558a 1199a 2267a 3472a
SEM 0.34 0.56 0.79 1.17 1.53
- 8.4 150x 559x 1202x 2264 3507
- 9.0 152x 559x 1215xy 2318 3554
- 9.6 154xy 574y 1237y 2316 3564
- 10.2 158y 577y 1235y 2341 3612
SEM 0.35 0.55 0.80 1.18 1.58
---Probability---ANOVA
M E 0.001 0.020 0.003 0.016 0.006
BP 0.006 0.004 0.022 0.061 0.267
ME x BP 0.281 0.284 0.330 0.200 0.790
Linear
M E 0.179 0.333 0.240 0.359 0.346
BP 0.017 0.073 0.068 0.092 0.026
Quadratic
M E - - - -
-BP 0.076 0.363 0.254 0.329 0.225
a-z - Means within row for ME and BP with no common superscript differ significantly (p<0.05).
Table 3 - Effect of dietary treatments on body weight (g/b) of broilers, 1-35d.
ME, kcal/kg BP, g/kg 7d 14d 21d 28d 35d
2650 - 159b 379 699a 1154a 1612a
2750 - 159b 384 710ab 1182b 1665ab
2850 - 155a 382 724b 1205b 1694b
SEM 0.33 0.52 0.72 0.81 1.08
- 8.4 152x 364x 687x 1149x 1633
- 9.0 156xy 380y 708xy 1178xy 1652
- 9.6 158y 386yz 725y 1185y 1664
- 10.2 164z 396z 725y 1208y 1678
SEM 0.30 0.43 0.69 0.81 1.13
---Probability---ANOVA
M E 0.015 0.379 0.014 0.001 0.002
BP 0.001 0.001 0.001 0.001 0.362
ME x BP 0.868 0.595 0.153 0.492 0.512
Linear
M E 0.333 0.593 0.044 0.036 0.107
BP 0.019 0.018 0.063 0.023 0.005
Quadratic
M E - - - -
-BP 0.155 0.135 0.093 0.202 0.061
In general, the data presented herein suggest that the effect of ME and BP on BW was age dependent, as the requirement of ME tended to increase and that of BP to decrease with age. High ME (2850 kcal per kg) resulted in the lowest BW at 7 days posthatch, followed by no effect of ME on BW at 14 days posthatch, and a reverse situation at 35 days of age, when 2850 kcal EM resulted in approximately 5% higher BW as compared with that promoted by 2650 kcal (p<0.01). In contrast, the effect of BP on BW was very pronounced during the first two weeks of age (e.g. about 8.4% difference between 10.2 vs. 8.4 g
BP). This effect, however, tended to decrease at 21 and 28 days posthatch (about 5.2%) and was further reduced to 2.8% at 35 days posthatch. Increasing BP caused a significant linear increase in FI, an observation that contrasts with the reports demonstrating a slight depression in FI, and hence an improved FCR, in response to increased levels of dietary BP and/or amino acids (Mack et al., 1999; Baker et al., 2002; Wijtten et al., 2004; Lemme et al., 2006). Differences in the inclusion of dietary ingredients between diets containing different BP concentrations in our study may partly explain this apparent anomaly.
The results of present study demonstrated that the impact of BP on BW was strictly linear, and no apparent plateau was reached up to the highest BP level, suggesting that the 'requirement' of broilers for BP could have been even higher than those observed in the current study. Conversely, our previous experiments using similarly low ME basal diets, but making use of
the conventional graded-supplementation approach, suggested that digestible lysine requirement for BW was 0.85 and 0.75% of diet, respectively during the starter and grower/finisher phase (Aftab et al., 2007).
In this respect, findings of the current study seems to agree with those reported by Wijtten et al. (2004), who demonstrated that broiler weight gain broilers responded to higher dietary Ideal Protein (or BP) levels than would be expected from single lysine requirement studies in literature. In contrast, when comparing graded-supplementation (only the concentration of amino acid in question is changed) vs. diet-dilution
techniques (complete range of essential and non-essential amino acids is changed), D'Mello (1982) concluded that amino acid requirements were independent of the methodology used. It is, however, worthy noting that the diet-dilution technique makes use of large excesses of amino acids (other than one under study), and thus do not supply BP.
The comparison of the response to the 8.4 g digestible lysine treatment in our study with that of 8.5 g digestible lysine in the study of Plumstead et al.
(2007) suggests that the efficiency of lysine utilization for weight gain was markedly high when offered as a fairly balanced protein (17.8% CP in our study) vs. when
the same dietary concentration of lysine was fed in the presence of 'excessive/imbalanced' protein (22% CP in Plumstead et al., 2007). This finding seems to be
consistent with earlier reports suggesting that the efficiency of utilization of first limiting amino acid was depressed in the presence of surplus CP (Morris et al.,
Table 4 - Effect of dietary treatments on feed conversion ratio (g:g) of broilers, 1-35d.
ME, kcal/kg BP, g/kg 7d 14d 21d 28d 35d
2650 - 0.986 1.511b 1.770b 2.019b 2.237b
2750 - 0.976 1.492ab 1.737b 1.975b 2.169b
2850 - 0.964 1.464a 1.658a 1.883a 2.051a
SEM 0.028 0.031 0.034 0.034 0.041
- 8.4 0.991 1.535y 1.752 1.974 2.151
- 9.0 0.972 1.473x 1.718 1.969 2.157
- 9.6 0.969 1.489x 1.711 1.954 2.144
- 10.2 0.969 1.461x 1.705 1.939 2.157
SEM 0.028 0.030 0.037 0.039 0.046
---Probability---ANOVA
M E 0.307 0.019 0.001 0.001 0.001
BP 0.503 0.001 0.242 0.505 0.985
ME x BP 0.144 0.287 0.395 0.099 0.507
Linear
M E 0.033 0.070 0.148 0.128 0.098
BP 0.159 0.180 0.091 0.020 0.896
Quadratic
M E - - - -
-BP 0.158 0.486 0.160 0.082 0.939
1999). In view of the arguments presented above, as well as for the purpose of practical applications, it seems more defendable to study the amino acid responses in terms of BP rather than using a graded-supplementation or diet dilution techniques.
CONCLUSION
Dietary ME and BP interaction did not influence any of the studied parameters, and the main effect of ME and BP on BW and FCR was age dependent. Optimum dietary combinations of ME and BP for BW seems to be 2650/10.2, 2650/9.6, 2750/9.0, and 2750/8.4, respectively, for the periods of 1-7, 8-14, 15-21, and 22-35 days of age, whereas for FCR, these combinations are, 2650/8.4, 2750/9.0, and 2850/8.4, respectively, for the periods of 1-7, 8-14, and 15-35 days of age.
REFERENCES
Aftab U, Ashraf M, Mumtaz AS, Jiang Z. Lysine requirement of broiler chickens fed low-density diets under tropical conditions. Asian-Australasian Journal of Animal Science 2007; 20:939-943.
Baker DH, Batal AB, Parr TM, Augspurger NR, Parsons CM. Ideal ratio (relative to lysine) of tryptophan, threonine, isoleucine, and valine for chicks during the second and third weeks posthatch. Poultry Science 2002; 81:485-494.
Baker DH, Han Y. Ideal amino acid profile for chicks during the first three weeks posthatching. Poultry Science 1999; 73:1441-1447.
D'Mello JPF. A comparison of two empirical methods of determining amino acid requirements. World's Poultry Science Journal 1982; 38:114-119.
Gous MR, Morris TR. Evaluation of a diet dilution technique for measuring the response of broiler chickens to increasing concentration of lysine. British Poultry Science 1985; 26:147-161.
Lemme A, Wijtten PJA, van Wichen, Petri A, Langhout DJ. Responses of male growing broilers to increasing levels of balanced protein offered as coarse mash or pellets of varying quality. Poultry Science 2006; 85:721-730.
Lesson S, Caston L, Summers JD. Broiler response to energy or protein dilution in finisher diet. Poultry Science 1996; 75:522-528.
Mack S, Bercovici D, De Groote G, Leclercq B, Lippens M, Pack M, Schutte JB, van Cauwenberghe. Ideal amino acid profile and dietary lysine specification for broiler chickens of 20 to 40 days of age. British Poultry Science 1999; 40:257-265.
Morris TR, Gous RM, Fisher C. An analysis of the hypothesis that amino acid requirements for chicks should be stated as proportion of dietary protein. World's Poultry Science Journal 1999; 55:7-22.
National Research Council. Nutrient requirements of poultry. 9th ed. Washington DC; 1994.
Plumstead PW, Romero-Sanchez H, Paton ND, Spears JW, Brake J. Effects of dietary metabolizable energy and protein on early growth responses of broilers to dietary lysine. Poultry Science 2007; 86: 2639-2648.