Rev. Caatinga
MORPHOPHYSIOLOGICAL RESPONSES OF COWPEA GENOTYPES TO
IRRIGATION WATER SALINITY
1JOÃO PEDRO ALVES DE AQUINO2, ANTÔNIO AÉCIO DE CARVALHO BEZERRA3*, FRANCISCO DE ALCÂNTARA NETO4, CARLOS JOSÉ GONCALVES DE SOUZA LIMA5, RAYLSON RODRIGUES DE SOUSA2
ABSTRACT- Cowpea is broadly cultivated worldwide, especially in semi-arid or arid regions where soil or
irrigation water salt contents can negatively influence the species’ productive capacity. The objective of this study was to evaluate the morphophysiological responses of cowpea genotypes to irrigation water salinity. The experiment was conducted in a greenhouse, under a completely randomized design with nine replications and
in a 5x3 factorial scheme. Treatments consisted of five levels of irrigation water electrical conductivity - EC
(EC0: 0.55; EC1: 1.60; EC2: 3.20; EC3: 4.80 and EC4: 6.40 dS m-1), applied from the 15th day after sowing
(DAS), and three cowpea genotypes (G1: BRS Imponente; G2: MNC04-795F-168 and G3: MNC04-795F-159).
EC increases at 35 DAS promoted stem diameter reductions of 8.0% (G1), 11.4% (G2), and 7.7% (G3), indicating different resistance to salinity by each genotype. Leaf area reductions at 25 and 38 DAS were 30.9%
and 38.8% for EC0 and EC4, respectively. The BRS Imponente cultivar presented a performance superior to
those of G2 and G3 in relation to stem diameter and stem dry matter at 25 DAS, and root-shoot and root-leaf
ratios at 38 DAS.
Keywords: Vigna unguiculata. Saline stress. Plant growth.
RESPOSTAS MORFOFISIOLÓGICAS DE GENÓTIPOS DE FEIJÃO-CAUPI À SALINIDADE DA ÁGUA DE IRRIGAÇÃO
RESUMO - O feijão-caupi é bastante cultivado no mundo, principalmente em regiões semiáridas ou áridas
onde o teor de sais presentes no solo ou na água de irrigação pode influenciar negativamente na capacidade
produtiva da espécie. Objetivou-se com o presente trabalho, avaliar as respostas morfofisiológicas de genótipos
de feijão-caupi à salinidade da água de irrigação. O experimento foi conduzido em casa de vegetação no
delineamento inteiramente casualizado com nove repetições, em esquema fatorial 5x3, sendo cinco níveis de condutividade elétrica da água de irrigação - CE (CE0: 0,55; CE1: 1,60; CE2: 3,20; CE3: 4,80 e CE4:
6,40 dS m-1) aplicados a partir do 15º dia após a semeadura (DAS) e três genótipos de feijão
-caupi (G1: BRS
Imponente; G2: MNC04-795F-168 e G3: MNC04-795F-159). Aumentos nas CE aos 35 DAS, promoveram
reduções no diâmetro do caule de 8,0% (G1), 11,4% (G2) e 7,7% (G3) indicando resistências diferenciadas dos genótipos aos efeitos da salinidade. Entre CE0 e CE4 as reduções na área foliar aos 25 e 38 DAS foram de
30,9% e 38,8%, respectivamente. Os efeitos negativos da salinidade foram mais intensos nas matérias secas da
raiz e da haste, aos 20 DAS e na matéria seca das folhas, aos 30 DAS. A cultivar BRS Imponente apresenta desempenho superior a G2 e G3 em relação ao diâmetro do caule e matéria seca da haste, aos 25 DAS, e razão parte aérea raiz e folha raiz, aos 38 DAS.
Palavras-chave: Vigna unguiculata. Estresse salino. Crescimento da planta.
____________________
*Corresponding author
1Received for publication in 08/07/2016; accepted in 03/06/2017.
Paper approved from IV CONAC 2016.
Paper extracted from the master's thesis of the first author, supported by CAPES.
2Universidade Federal do Piauí, Teresina, PI, Brazil; aquinojpa.agro@gmail.com, rayr-80@hotmail.com.
3Department of Agricultural Policy and Planning, Universidade Federal do Piauí, Teresina, PI, Brazil; aecio@ufpi.edu.br. 4Department of Plant Science, Universidade Federal do Piauí, Teresina, PI, Brazil; fneto@ufpi.edu.br.
INTRODUCTION
The cowpea [Vigna unguiculata (L.) Walp.]
tends to play an increasingly important role in the food security of the peoples from tropical and subtropical regions with high pluviometric instability, and low technological level. It is considered of high nutritional value, easy to produce, and accessible. Therefore the cowpea is one of the
main food crops, especially for low-income
populations historically characterized by the
deficiency of energy-protein and minerals
(BEZERRA et al., 2014).
Cowpea is cultivated predominantly in the
semi-arid in Brazil, where edaphoclimatic and water
conditions are very favorable to the occurrence of soil salinization and/or irrigation water. Abiotic factors such as drought and salinity are major plant stressors and can cause significant damage to crop development and yield. According to Coelho et al. (2014), salinity in soil or water negatively influences the plants’ ability to absorb water and causes metabolic changes similar to those of water deficit.
Chaum et al. (2013) evaluated tolerance levels to saline stress in legumes and highlighted the negative effects of salinity on height, dry matter of shoots and roots, leaf area, and efficient water use in cowpea. Assis Júnior et al. (2007) and Calvet et al. (2013) emphasize that excess of salts can compromise the plants’ physiological and biochemical functions, causing osmotic stress, which results in disturbed water relations, absorption alterations, essential nutrients usage, and toxic ions accumulation.
Dantas et al. (2002) reported that this tolerance degree to salinity may vary according to the cultivar, the plant development stage, the exposure time to saline stress, the edaphoclimatic conditions, and the irrigation management. They also point out that 6.0 dS m-1 is the water salinity level
most suitable for comparative evaluations among cowpea genotypes. Almeida et al. (2011) identified cowpea genotypes moderately tolerant and moderately susceptible to various levels of irrigation water salinity, indicating the existence of genetic variability and the possibility of selecting tolerant genotypes.
This study aims to evaluate the morphophysiological responses of cowpea genotypes to irrigation water salinity.
MATERIAL AND METHODS
The experiment was conducted from June to August 2015, in a greenhouse in the Experimental Area of the Plant Science Department, Agricultural Sciences Research Center, Federal University of
Piauí. The area is located in the city of Teresina-PI,
at 05º 04' 35" South, 42º 78' 38" West, and altitude of 72 m. According to Thornthwaite and Mather (1955), the local climate is C1sA'a', characterized as dry sub humid, megathermal, with moderate water surplus in the summer. The average annual rainfall is 1,343.4 mm, concentrated between January and April, with an average temperature of 28.2 °C, and the mean relative air humidity is 69.7% (BASTOS, ANDRADE JÚNIOR, 2014).
Cultivation was carried out in 3.8 dm3 plastic
pots filled with eutrophic Red-Yellow Ultisol, with
sandy texture, collected in the layer of 0.00 to 0.20 m, and according to its chemical
characterization (Table 1), fertilization with
ammonium sulfate (20 kg of N ha-1), triple
superphosphate (60 kg of P2O5 ha-1), and potassium
chloride (70 kg of K2O ha-1) was performed. Pots
were arranged in three rows with 15 pots each, on galvanized steel benches 1.2 m wide, 5.0 m long and 0.8 m high. The spacing between and within rows was 0.30 and 0.22 m, respectively.
Table 1. Chemical characterization of the soil used for pot filling.
Source: UFPI Laboratory of Soil Analyses.
Seeds were treated with fipronil + methyl thiophanate + pyraclostrobin at a dosage of 200 mL for 100 kg of seeds. The sowing was done on June 22nd, 2015 with five seeds per pot and the thinning
ten days after sowing (DAS), leaving only one plant per pot. At 15 DAS, cover fertilization with ammonium sulfate was carried out at a dosage of 10 kg of N ha-1.
A completely randomized design with nine
replicates in the 5x3 factorial scheme was used, with
five levels of irrigation water electrical conductivity - EC (EC0: 0.55; EC1: 1.60; EC2: 3.20;
EC3:4.80 and EC4: 6.40 dS m-1), and three elite
northern Embrapa cowpea genotypes (G1: BRS
Imponente; G2: MNC04-795F-168 and G3:
MNC04-795F-159). Water from the Department of
Phytotechnology was used in the experiment, and it
presented EC of 0.55 dS m-1, corresponding to EC
0 pH
H2O
OM %
P K Na Mg+2 Ca+2 Al+3 H+Al SB CTC V
% --- mg dm-3 --- --- cmolc dm
-3
---
Rev. Caatinga
level.
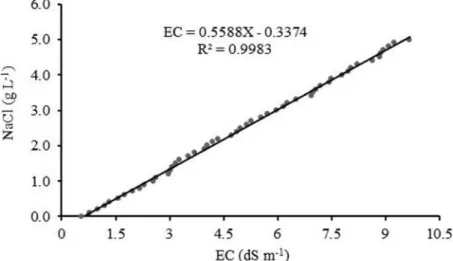
A salinity curve was constructed
from dilutions of 0.1 to 5.0 g NaCl in 1 L water, with an addition interval of 0.1 g NaCl, totaling 50 concentrations. The electrical conductivity of
solutions (dS m-1) was used to adjust the salinity
curve equation (Figure 1). The amount of NaCl to be diluted per liter of water to obtain the five pre-established levels of irrigation water electrical
conductivity was determined from this equation.
Figure 1. Salinization curve as a function of NaCl concentration. Before planting, water was added to the soil
until it reached its field capacity. Irrigations were performed manually by using a graduated cylinder, and 100% of the evapotranspiration water was replenished in two daily applications, 60% in the morning and 40% in the afternoon. The water mass to be replenished was determined by the difference in the weighing of three pots per bench referring to
EC0 combined with each genotype, before and after
water application (Equation 1). Irrigation occurred in the period from 15 to 45 DAS, according to the specified salinity levels.
In which,
DWM: daily water mass to be replaced, in kg. PMB: pot mass, in kg, before irrigation. PMA: pot mass, in kg, after irrigation.
The following non-destructive samples were
evaluated at 25 and 35 DAS: stem diameter (SD, in mm), which was measured with a digital caliper immediately below the cotyledon node; plant height (PH, in cm), measured between the cotyledon node and the apical bud and number of nodes in the main branch (NNMB).
Three randomly selected plants of each treatment were separated into leaves, stems, and roots in the destructive samples at 25 and 38 DAS, to
determine the characteristics: leaf area (LA, in cm2),
DWM = PMB - PMA (1)
obtained with leaf area integrator LICOR, model
LI-3100; dry matter of leaves (DML), stems (DMS),
and roots (DMR) in grams; root shoot ratio
(RSR - Equation 2), and root leaf ratio
(RLR - Equation 3). To determine the dry matter, the
parts were individually packed in paper bags and dried in an oven with forced air circulation at 65 °C until reaching constant dry matter, and then weighed in precision scales (0.01 g).
The data were submitted to analysis of variance with polynomial regression for the water salinity levels and the genotypes’ means were compared by the Tukey test (5%). The analyses were performed using the ASSISTAT statistical software (version 7.7).
RESULTS AND DISCUSSION
The results of the Tukey test for the genotypes’ means when the interaction between
factors was non-significant (p>0.05) are presented in
Figure 2.
RSR = DML + DMS DMR (g g
-1)
(2)
RFR = DML DMR (g g
-1)
Figure 2. Means by genotype1 for stem diameter (SD), plant height (PH), number of nodes in the main branch (NNMB) at
25 and/or 35 days after sowing (DAS), dry matter of leaves (DML), stems (DMS) and roots (DMR), root shoot ratio (RSR),
root leaf ratio (RLR) and leaf area (LA) at 25 and/or 38 DAS. Teresina, PI, 2016. 1G1: BRS Imponente; G2:
MNC04-795F-168 and G3: MNC04-795F-159. Genotypes with the same letter do not differ by Tukey test (p<0.05).
There was a significant difference between the genotypes for SD, and BRS Imponente (G1) presented the highest mean (4.49 mm). Greater SD, especially at the epicotyl level, may favor resistance to lodging since according to Bezerra et al. (2012), plants break in the epicotyl region in the occurrence of lodging.
At 25 DAS, G2 presented the highest PH and differed significantly from the other genotypes. Presenting a higher mean initial development under saline stress conditions may favor the genotype in the competition for environmental and technological
DMR at 38 DAS significantly higher than the other genotypes, and LA and DML higher than G2 at 25 and/or 38 DAS. Chaum et al. (2013) observed negative effects of salinity on plant height, leaf area and plant dry matter in cowpea.
At 38 DAS, BRS Imponente (G1) and G2 presented the highest DMS, showing better stem structure (stems), while G3’s root development (DMR) was higher than G1 and G2.
Rev. Caatinga
because it presents a greater photosynthetic structure. EC increases promoted significant linear
reductions of 7.9% in SD when compared to EC0 and
EC4 in the average of the three genotypes at 25 DAS.
At 35 DAS, the differentiated SD reductions by genotypes were 8.0% (G1), 11.4% (G2) and 7.7% (G3), demonstrating that the negative influence of EC increases occurs in both development stages; however, at 35 DAS genotypes respond differently, and may indicate greater or lesser resistance to the negative effects of EC increases on SD (Figure 3).
PH and NNMB presented significant linear reductions of 5.12 and 14.9% for EC0 and EC4 at
25 DAS, respectively, being of 7.7 and 17.3%, respectively, at 35 DAS (Figure 3). The negative effects were observed to be intensified in 50.7% in PH and 16.1% in NNMB when compared at 25 and 35 DAS, indicating a tendency of cumulative
negative effect, which can become more drastic in the reproductive phase.
Brito et al. (2015) worked with different cowpea genotypes irrigated with saline water and obtained reductions of more than 20% for PH among genotypes irrigated with water supply, with a conductivity of 4.8 dS m-1. Andrade et al. (2013)
worked in a greenhouse with initial growth of cowpea genotypes and found a decrease in the SD of the plant undergoing saline stress at 35 DAS, with reductions above 21%. Dias and Blanco (2010) attributed the reductions in the growth parameters SD, NNMB and PH to the indirect effects caused by water absorption difficulty, specific ion toxicity, ion interference in the physiological processes and ions resulting from the excessive accumulation of water salts which were fixed in the more superficial layers of the soil with time, under low leaching rate.
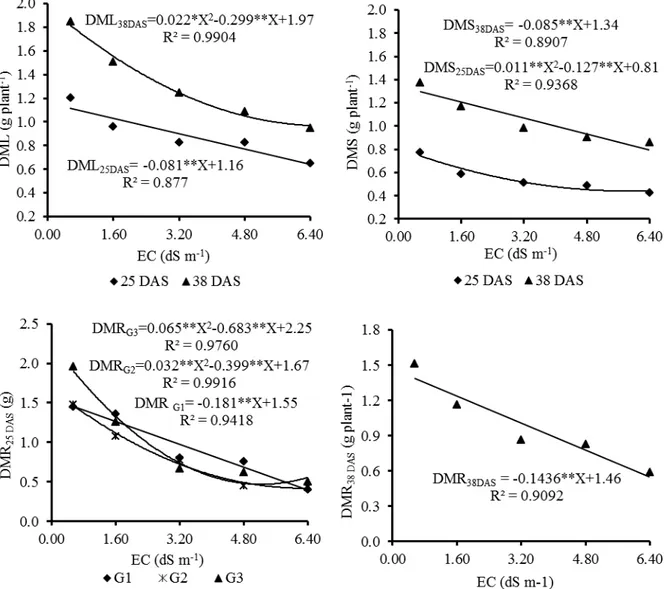
The dry matter of leaves (DML), stems (DMS) and roots (DMR) presented significant reductions in response to EC increases in both periods (25 and 38 DAS) (Figure 4). When
comparing the responses to EC0 and EC4 at 25 DAS,
the highest reductions were observed in DMR, being 70.1% in G1 and G2, and 77.6% in G3, while for DML and DMS the mean reductions in the three
genotypes were 45.8 and 44.2%, respectively. At 38 DAS, reductions were 60.9% (DMR), 48.7% (DML), and 37.2% (DMS). When comparing 25 and 38 DAS, there was a decrease in the intensity of DMR reductions of 16.1% and in DMS of 15.8%, while for DML there was an increase of 6.2 % in the intensity of reduction.
Figure 4. Dry matter of leaves (DML), stems (DMS) and roots (DMR) of the three cowpea genotypes submitted to five levels of irrigation water electrical conductivity (EC) at 25 and 38 days after sowing (DAS).
Silva et al. (2009) and Oliveira et al. (2013) worked with cowpea genotypes subjected to saline stress and verified a reduction in the dry matter of leaves, stem, root and total dry matter when submitted to EC increases. Sousa et al. (2010) evaluated the morphophysiological responses of
some saline-stressed crops, including cowpea, and
found reductions in dry matter of aerial part (69.0%)
and DMR (79.0%), with EC, increases up to 8.0 dS m-1.
There were significant linear increases in RSR (42.7%) and LSR (31.2%) in response to EC
increases confirm that the negative effects on biomass in response to EC increases occurred more intensely in the roots, which presented a mean reduction of 66.8% in DMR, while for DML and DMS the average reductions were respectively 47.2% and 40.7%, also considering 25 and 38 DAS.
Rev. Caatinga
Figure 5. Root shoot ratio (RSR), leaf root ratio (LSR) and leaf area (LA) of three cowpea genotypes at 25 and 38 days after sowing (DAS), submitted to five levels of irrigation water electrical conductivity (EC).
EC increases promoted linear decreases in LA at 25 DAS, and quadratic at 38 DAS. Considering
the interval between EC0 and EC4, the reductions in
LA at 25 and 38 DAS were 30.9% and 38.8%, respectively (Figure 5). From the total reduction at 38 DAS, 76.8% occurred when EC was increased from 0.55 (EC0) to 3.20 (EC3) dS m-1. This data
indicates an intensification of the negative effects of EC increases at more advanced stages of genotype development. The significant reductions in biomass and leaf area at 25 and 38 DAS in response to EC increases could negatively impact plant productive potential.
Xavier et al. (2014) evaluated cowpea submitted to irrigation with saline water and nitrogen fertilization and observed a 33.72% reduction in LA
at the level of 4.5 dS m-1 of irrigation water.
According to Oliveira et al. (2012) and Feitosa et al. (2015), there are morphological and anatomical alterations, and also leaf area reductions for the maintenance of high water potential in plants submitted to saline stress.
CONCLUSIONS
The increase in irrigation water salinity negatively influenced the morphophysiological characteristics evaluated, promoting significant reductions in stem diameter, plant height and number of nodes in the main branch at 25 and 35 days after sowing (DAS), and more intense reductions in the dry matter of roots than of shoots at 25 and 38 DAS. The BRS Imponente cultivar presented superior performance than G2 and G3 in relation to stem diameter and dry matter at 25 DAS, and root shoot ratio and root leaf ratio at 38 DAS.
REFERENCES
ALMEIDA, W. S. et al. Identificação de genótipos de feijão-caupi tolerantes a salinidade avaliado por
meio de método multivariado. Ciência Rural, Santa
Maria, v. 41, n. 11, p. 1884-1889, 2011.
ANDRADE, J. R. et al. Crescimento inicial de
genótipos de feijão-caupi submetidos a diferentes
níveis de água salina. Agropecuária Científica no
Semiárido, Patos, v. 9, n. 4, p. 38-43, 2013.
ASSIS JÚNIOR J. O. et al. Produtividade do
feijão-caupi e acúmulo de sais no solo em função da
fração de lixiviação e da salinidade da água de
irrigação. Revista Brasileira de Engenharia
Agrícola, Jaboticabal, v. 27, n. 3, p. 702-713, 2007.
BASTOS, E. A.; ANDRADE JÚNIOR, A. S.
Boletim Agrometeorológico do ano de 2013 para o município de Teresina, PI. Teresina: Embrapa
Meio-Norte, 2014. 39 p. (Documentos, 228).
BEZERRA, A. A. C. et al. Comportamento
morfoagronômico de feijão-caupi, cv. BRS Guariba,
sob diferentes densidades de plantas. Revista
Ciência Agrárias, Belém, v. 55, n. 3, p. 184-189, 2012.
BEZERRA, A. A. C. et al. Morfofisiologia e
produção de feijão-caupi, cultivar BRS Novaera, em
função da densidade de plantas. Revista Caatinga,
Mossoró, v. 27, n. 4, p. 135-141, 2014.
BRITO, K. Q. D. et al. Crescimento de genótipos de
feijão-caupi irrigados com água salina. Revista
CALVET, A. S. F. et al. Crescimento e acumulação
de solutos em feijão-caupi irrigado com águas de
salinidade crescente em diferentes fases de
desenvolvimento. Irriga, Botucatu, v. 18, n. 1, p.
148-159, 2013.
CHAUM, S. et al. Physiomorphological changes of
cowpea (Vigna unguiculata (L.) Walp.) and jack
bean (Canavalia ensiformis (L.) DC.) in responses to
soil salinity. Australian Journal of Crop Science,
Melbourne, v. 7, n. 13, p. 2128-2135, 2013.
COELHO, J. B. et al. Ponto de murcha permanente
fisiológico e potencial osmótico de feijão-caupi
cultivado em solos salinizados. Revista Brasileira
de Engenharia Agrícola e Ambiental, Campina
Grande, v. 18, n. 7, p. 708-713, 2014.
DANTAS, J. P. et al. Avaliação de genótipos de
caupi sob salinidade. Revista Brasileira de
Engenharia Agrícola e Ambiental, Campina
Grande, v. 6, n. 3, p. 425-430, 2002.
DIAS, N. S.; BLANCO, F. F. Efeitos dos sais no solo e na planta. In: GHEYI, H. R.; DIAS, N. S.;
LACERDA, C. F. (Eds.). Manejo da salinidade na
agricultura: estudos básicos e aplicados. Fortaleza:
INCTSal, 2010. v. 1, cap. 9, p. 129-141.
FEITOSA, S. O. et al. Crescimento do feijão-caupi
irrigado com efluente tratado e água salina sob
diferentes concentrações. Revista Agropecuária
Técnica, Areia, v. 36, n. 1, p. 146-155, 2015.
LIMA, C. J. G. S. et al. Resposta do feijão-caupi a
salinidade da água de irrigação. Revista verde de
agroecologia e desenvolvimento sustentável,
Pombal, v. 2, n. 2, p. 79-86, 2007.
LUTTS, S.; KINET, J. M.; BOUHARMONT, J. Effects of salt stress on growth, mineral nutrition and proline accumulation in relation to osmotic
adjustment in rice (Oryza sativa L.) cultivars
differing in salinity resistance. Plant Growth
Regulation, Amsterdam, v. 19, n. 3, p. 207-218,
1996.
OLIVEIRA, F. A. et al. Desenvolvimento inicial do maxixeiro irrigado com água de diferentes
salinidades. Agropecuária Científica no
Semiárido, Patos, v. 8, n. 2, p. 22-28, 2012.
OLIVEIRA, F. A. et al. Interação entre salinidade e
bioestimulante na cultura do feijão-caupi. Revista
Brasileira de Engenharia Agrícola e Ambiental,
Campina Grande, v. 17, n. 5, p. 465-471, 2013.
SILVA, F. E. O. et al. Desenvolvimento vegetativo
p. 156-159, 2009.
SOUSA, C. H. C. et al. Respostas morfofisiológicas de plantas de sorgo, feijão-de-corda e algodão sob
estresse salino. Revista Agropecuária Técnica,
Areia, v. 31, n. 2, p. 29-36, 2010.
SOUZA, R. A. et al. Crescimento e nutrição mineral
de feijão-de-corda em função da salinidade e da
composição iônica da água de irrigação. Revista
Brasileira de Ciências Agrárias, Recife, v. 2, n. 1,
p. 75-82, 2007.
THORNTHWAITE, C. W.; MATHER, J. R. The
water balance. Publications in Climatology. New
Jersey: Drexel Institute of Technology, 1955. 104 p.
XAVIER, D. A. et al. Irrigação com água salina e
adubação com nitrogênio no cultivo do feijão-caupi.