xx/xx
J. Aerosp. Technol. Manag., São José dos Campos, v10, e4518, 2018
doi: 10.5028/jatm.v10.954 ORIGINAL PAPER
1.Ferdowsi University of Mashhad – Faculty of Engineering – Mechanical Engineering Department – Mashhad – Iran.
Correspondence author: Mohammad Hassan Djavareshkian | Ferdowsi University of Mashhad – Faculty of Engineering – Mechanical Engineering Department | Azadi Square | 9177948974 – Mashhad – Iran | E-mail: javareshkian@um.ac.ir
Received: May 27, 2017 | Accepted: Nov. 22, 2017 Section Editor:T John Tharakan
ABSTRACT: In this research, viscous, laminar and steady flow around symmetric and non-symmetric airfoils is simulated at Low Reynolds Number (LRN). Navier-Stokes (N-S) equations are discretized by Finite Volume Method (FVM) and are solved by the SIMPLE algorithm in an open source software, namely OpenFOAM. The main objective of this paper is the introduction of the thermal camber phenomenon. This phenomenon is used to improve the aerodynamic performance. Hence, a symmetric airfoil, like NACA0012, with thermal camber is compared with the airfoils with the physical camber, including NACA2412 and NACA4412, to specify which camber type has more effects on the aerodynamic efficiency. Furthermore, various temperatures are tested in order to find the optimum condition. After validation, results indicated that cooling upper surface and heating lower surface, namely thermal camber, generate lift force and improve aerodynamic performance for symmetric airfoils at a 0° Angle of Attack (AOA). These improvements are more than the airfoils with physical camber. Also, when this method is applied to the NACA2412 and NACA4412 airfoils, lift to drag coefficient ratio will increase more than the condition with only cooling or heating the surfaces.
KEYWORDS: Thermal camber, Aerodynamic, CFD, Low Reynolds number.
INTRODUCTION
Due to the importance of Micro Aerial Vehicles (MAV), many studies have been done to develop this field of research. The motivation of recent attempts is to improve the aerodynamic performance in Low Reynolds Number (LRN) flows. In this range of Re, the adverse pressure gradient plays a destructive role in aerodynamic performance and consequently causes flow separation
over the airfoil. The separation happens either at leading edge or trailing edge. Finally, this separation increases the drag and reduces the lift (Febi Ponwin and Rajkumar 2015). Therefore, many methods, including optimization of airfoil shape, blowing and suction, have been used in those studies to overcome mentioned problems. On the other hand, the theory of using heat transfer based on the viscous boundary layer characteristics can also be utilized to improve the aerodynamic efficiency. Thermal effects on the flow can be clarified by investigation of the airfoils in steady conditions. Norton et al. (1973) performed analytical and
Improvement of Airfoils Aerodynamic
Efficiency by Thermal Camber
Phenomenon at Low Reynolds Number
Ahmad Samiee1, Mohammad Hassan Djavareshkian1, Behzad Forouzi Feshalami1, Esmaeil Esmaeilifar1
Samiee A; Djavareshkian MH; Fechalami BF; Esmaeilifar E (2018) Improvement of Airfoils Aerodynamic Efficiency by Thermal Camber Phenomenon at Low Reynolds Number. J Aerosp Technol Manag, 10: e4518. doi: 10.5028/jatm.v10.954.
How to cite
Samiee A http://orcid.org/0000-0002-3277-7338
Djavareshkian MH http://orcid.org/0000-0003-1766-1190
Feshalami BF http://orcid.org/0000-0002-4457-3674
J. Aerosp. Technol. Manag., São José dos Campos, v10, e4518, 2018
experimental studies to investigate the boundary layer of a NACA0012 airfoil at the Re of 105. Results of wind tunnel tests showed
that the drag increases by heating the surfaces. Landrum and Macha (1987) experimentally studied the effects of leading edge heating on two dimensions boundary layer characteristics. They found no alteration in lift force. Mabey (1990) studied the effects of the heat transfer on aerodynamic of different bodies at the Re of 106. He revealed that cooling the surfaces decreases Re and
delays the flow separation. By solving the N-S equations at the Re of 106, Longo and Radespiel (1995) found that the maximum lift,
the maximum lift to drag coefficient ratio and the lift curve slope of a NACA0012-64 airfoil are reduced by heating the surfaces. However, they showed that at low angles of attack, the heat transfer enhances lift to drag coefficient ratio. Navier-Stokes equations were used by Raghunathan and Mitchell (1995) to simulate the subsonic and transonic flows over a flat plate and a NACA0012 airfoil, respectively, in the presence of heat transfer. Results indicated that in a steady condition, cooling the surfaces thins boundary layer and increases its momentum. By performing numerical study on a DOAL3 airfoil at the Re of 106, Stock (2002) found that
the drag approximately doubles in the presence of the heating compared to the adiabatic condition. To summarize, it can be deduced that cooling the surfaces reduces the drag while it has no influence on the lift force of the symmetric airfoils. Kim et al.
(2003) revealed that for small-scale airfoils, cooling the upper surface and heating the lower surface enhance the lift and reduce the drag. However, they only focused on symmetric airfoils, and the simulation was accomplished at the Re of 104. Bekka et al.
(2009) concluded that thermal effects are more sensible in LRN range. Also, by simulation of flow around a NACA0012 airfoil, they showed that the results are approached to experimental data by using turbulence models. Using CFD methods and solving N-S equations at the Re of 3000, Hinz et al. (2013) investigated the impacts of the heat transfer on aerodynamic performance of
a flapping NACA0012 airfoil. The temperature on both surfaces of the airfoil in their simulations was kept hot or cold.
As is well known, one way to increase the lift force is physical camber. However, this method also enhances the drag force. The purpose of this research is to enhance the aerodynamic performance of the airfoil by thermal chamber phenomenon. The effects of thermal camber phenomenon on cambered airfoils have not been investigated yet. Therefore, the main objective of this research is to apply thermal camber on symmetric airfoils as well as cambered airfoils in order to weigh the influence of the thermal camber on the aerodynamic performance against the physical camber. Furthermore, various temperatures are tested to find optimum condition. In this simulation, although the flow velocity is in incompressible flow regime, it is considered as the compressible flow regime due to the temperature variations. Thus, the Compressible N-S equations are discretized by FVM and are solved by the compressible SIMPLE algorithm in an open source software, namely OpenFOAM (Open CFD Limited 2008).
NUMERICAL SIMULATION
Fluid properties are generally not constant with temperature alteration. Property variations with temperature are shown in Fig. 1. Therefore, the following relations are used in these studies (Eqs. 1-3) (Eucken 1940; Incropera and Dewitt 1990; Sutherland 1893):
(1)
(2)
(3)
× $%√'!" 𝑘𝑘)(𝑇𝑇) = 𝜇𝜇(𝑇𝑇)𝐶𝐶012345
𝜇𝜇(𝑇𝑇) = 𝐴𝐴7√𝑇𝑇 1 + )
𝐶𝐶012345= 𝑐𝑐; (1.32 +1.77 𝑅𝑅𝑐𝑐
; )
× $%√'!" 𝑘𝑘)(𝑇𝑇) = 𝜇𝜇(𝑇𝑇)𝐶𝐶012345
𝜇𝜇(𝑇𝑇) = 𝐴𝐴7√𝑇𝑇 1 + )
𝐶𝐶012345= 𝑐𝑐; (1.32 +1.77 𝑅𝑅𝑐𝑐
; )
Rf T
× $%√'!" 𝑘𝑘)(𝑇𝑇) = 𝜇𝜇(𝑇𝑇)𝐶𝐶012345
𝜇𝜇(𝑇𝑇) = 𝐴𝐴7√𝑇𝑇 1 + )
𝐶𝐶012345= 𝑐𝑐; (1.32 +1.77 𝑅𝑅𝑐𝑐
; )
where: kT, μ, cv and R denote thermal conductivity, dynamic viscosity, specific heat at constant volume and particular gas
J. Aerosp. Technol. Manag., São José dos Campos, v10, e4518, 2018 Improvement of Airfoils Aerodynamic Efficiency by Thermal Camber Phenomenon at Low Reynolds Number
xx/xx 03/13
are 1.497 × 10⁻⁶ kg/ms√K and 116 K, respectively.
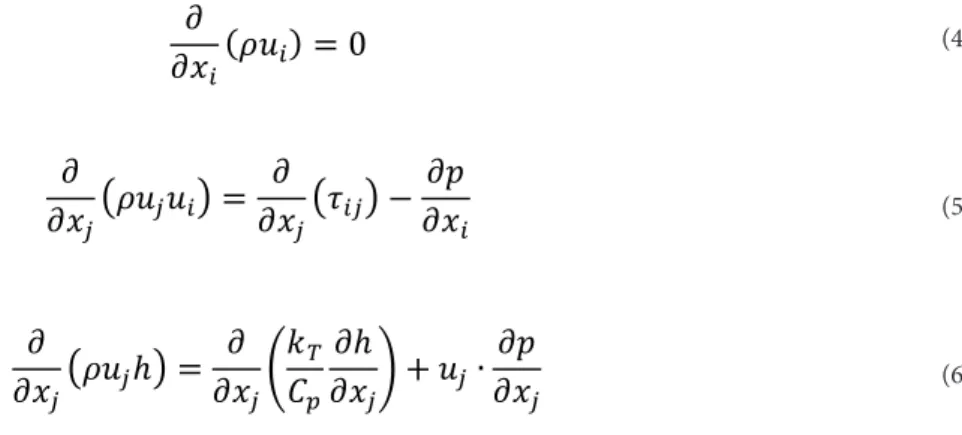
The governing equations, namely the conservation of mass, momentum and enthalpy are given in the Cartesian tensor form by (Eqs. 4-6):
(4) (5) (6) (7) (8)
ρ
τ
τ
δ
𝛻𝛻. (𝜌𝜌𝜌𝜌𝜌𝜌) = 𝛻𝛻. (𝛤𝛤𝛻𝛻𝜌𝜌 ) + 𝑆𝑆
Gφ
÷
÷
ø
ö
ç
ç
è
æ
-
d
t
𝜕𝜕
𝜕𝜕𝑥𝑥
J(𝜌𝜌𝑢𝑢
J) = 0
𝜕𝜕
𝜕𝜕𝑥𝑥
MN𝜌𝜌𝑢𝑢
M𝑢𝑢
JO =
𝜕𝜕
𝜕𝜕𝑥𝑥
MN𝜏𝜏
JMO −
𝜕𝜕𝜕𝜕
𝜕𝜕𝑥𝑥
J𝜕𝜕
𝜕𝜕𝑥𝑥
MN𝜌𝜌𝑢𝑢
MℎO =
𝜕𝜕
𝜕𝜕𝑥𝑥
MT
𝑘𝑘
)𝐶𝐶
U𝜕𝜕ℎ
𝜕𝜕𝑥𝑥
MV + 𝑢𝑢
M∙
𝜕𝜕𝜕𝜕
𝜕𝜕𝑥𝑥
Mρ
τ
τ
δ
𝛻𝛻. (𝜌𝜌𝜌𝜌𝜌𝜌) = 𝛻𝛻. (𝛤𝛤𝛻𝛻𝜌𝜌 ) + 𝑆𝑆
Gφ
÷
÷
ø
ö
ç
ç
è
æ
-
d
t
𝜕𝜕
𝜕𝜕𝑥𝑥
J(𝜌𝜌𝑢𝑢
J) = 0
𝜕𝜕
𝜕𝜕𝑥𝑥
MN𝜌𝜌𝑢𝑢
M𝑢𝑢
JO =
𝜕𝜕
𝜕𝜕𝑥𝑥
MN𝜏𝜏
JMO −
𝜕𝜕𝜕𝜕
𝜕𝜕𝑥𝑥
J𝜕𝜕
𝜕𝜕𝑥𝑥
MN𝜌𝜌𝑢𝑢
MℎO =
𝜕𝜕
𝜕𝜕𝑥𝑥
MT
𝑘𝑘
)𝐶𝐶
U𝜕𝜕ℎ
𝜕𝜕𝑥𝑥
MV + 𝑢𝑢
M∙
𝜕𝜕𝜕𝜕
𝜕𝜕𝑥𝑥
Mρ
τ
τ
δ
𝛻𝛻. (𝜌𝜌𝜌𝜌𝜌𝜌) = 𝛻𝛻. (𝛤𝛤𝛻𝛻𝜌𝜌 ) + 𝑆𝑆
Gφ
÷
÷
ø
ö
ç
ç
è
æ
-
d
t
𝜕𝜕
𝜕𝜕𝑥𝑥
J(𝜌𝜌𝑢𝑢
J) = 0
𝜕𝜕
𝜕𝜕𝑥𝑥
MN𝜌𝜌𝑢𝑢
M𝑢𝑢
JO =
𝜕𝜕
𝜕𝜕𝑥𝑥
MN𝜏𝜏
JMO −
𝜕𝜕𝜕𝜕
𝜕𝜕𝑥𝑥
J𝜕𝜕
𝜕𝜕𝑥𝑥
MN𝜌𝜌𝑢𝑢
MℎO =
𝜕𝜕
𝜕𝜕𝑥𝑥
MT
𝑘𝑘
)𝐶𝐶
U𝜕𝜕ℎ
𝜕𝜕𝑥𝑥
MV + 𝑢𝑢
M∙
𝜕𝜕𝜕𝜕
𝜕𝜕𝑥𝑥
Mρ
τ
τ
δ
𝛻𝛻. (𝜌𝜌𝜌𝜌𝜌𝜌) = 𝛻𝛻. (𝛤𝛤𝛻𝛻𝜌𝜌 ) + 𝑆𝑆
Gφ
÷
÷
ø
ö
ç
ç
è
æ
-
+
=
k k ij i j j i ijx
u
x
u
x
u
d
µ
t
3
2
𝜕𝜕
𝜕𝜕𝑥𝑥
J(𝜌𝜌𝑢𝑢
J) = 0
𝜕𝜕
𝜕𝜕𝑥𝑥
MN𝜌𝜌𝑢𝑢
M𝑢𝑢
JO =
𝜕𝜕
𝜕𝜕𝑥𝑥
MN𝜏𝜏
JMO −
𝜕𝜕𝜕𝜕
𝜕𝜕𝑥𝑥
J𝜕𝜕
𝜕𝜕𝑥𝑥
MN𝜌𝜌𝑢𝑢
MℎO =
𝜕𝜕
𝜕𝜕𝑥𝑥
MT
𝑘𝑘
)𝐶𝐶
U𝜕𝜕ℎ
𝜕𝜕𝑥𝑥
MV + 𝑢𝑢
M∙
𝜕𝜕𝜕𝜕
𝜕𝜕𝑥𝑥
Mρ
τ
τ
δ
𝛻𝛻. (𝜌𝜌𝜌𝜌𝜌𝜌) = 𝛻𝛻. (𝛤𝛤𝛻𝛻𝜌𝜌 ) + 𝑆𝑆
Gφ
÷
÷
ø
ö
ç
ç
è
æ
-
d
t
𝜕𝜕
𝜕𝜕𝑥𝑥
J(𝜌𝜌𝑢𝑢
J) = 0
𝜕𝜕
𝜕𝜕𝑥𝑥
MN𝜌𝜌𝑢𝑢
M𝑢𝑢
JO =
𝜕𝜕
𝜕𝜕𝑥𝑥
MN𝜏𝜏
JMO −
𝜕𝜕𝜕𝜕
𝜕𝜕𝑥𝑥
J𝜕𝜕
𝜕𝜕𝑥𝑥
MN𝜌𝜌𝑢𝑢
MℎO =
𝜕𝜕
𝜕𝜕𝑥𝑥
MT
𝑘𝑘
)𝐶𝐶
U𝜕𝜕ℎ
𝜕𝜕𝑥𝑥
MV + 𝑢𝑢
M∙
𝜕𝜕𝜕𝜕
𝜕𝜕𝑥𝑥
Mwhere: ρ is density; p is pressure; h is enthalpy; τ is stress tensor and u is velocity. Also, subscripts of i and j denote coordinate
direction.
The stress tensor is usually expressed by basic dependent variables. Flow is assumed Newtonian and fully laminar viscous tensor of stress, τij, is given by (Eq. 7) (Hinz et al. 2013):
where: δ is Kronecker symbol. Governing equations in the form of vector and independent of coordinates are shown as follows
(Eq. 8):
where: φ is variable and can be ui, uj and h. Equation 8 is discretized by FVM and is solved by pressure based algorithm.
A Preconditioned Conjugate Gradient (PCG) solver is used in this paper to solve pressure equation systems. Also, rhoSIMPLEFOAM
solver is considered in order to simulate the present study.
Figure 1. Variation of fluid property with temperature (Hinz et al. 2013).
--- …… *
o 2 1.5 1 0.5 0
200 250 300 350 400
ρ/ρ0 isobar
μ/μ0 Sutherland μ/μ0 Incropera υ/υ0 Sutherland υ/υ0 Incropera Cp/Cp0 Incropera kT/kT0 Eucken kT/kT0 Incropera αT/αT0 Incropera PrT/Pr0 Incropera Ts (k)
RESULTS
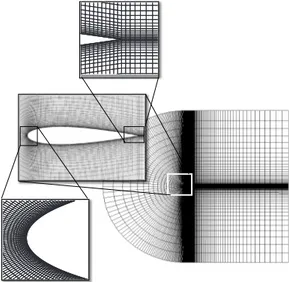
As shown in Fig. 2, a C-type mesh is used to model the flow around the airfoil. The computational area that is depicted in Fig. 3 is far enough from the airfoil where normal and back distances from the airfoil are set to 20 c and 25 c, respectively. The boundary conditions of non-slip velocity, zero-gradient pressure and isothermal temperature are considered on the airfoil surfaces. At the inlet, the free stream velocity and the zero-gradient pressure are chosen as the physical and numerical boundary conditions, respectively. In other words, pressure is determined by extrapolating inside of the computational area. Conversely, the boundary conditions of the pressure outlet and the zero-gradient velocity are used for the outlet. Velocity is computed by extrapolating inside of the computational area. Also, the slip boundary condition is used for the top and bottom boundaries. Velocity, pressure and temperature in these boundaries are the same as the first cells of the boundary.
Figure 3. Computational region.
Figure 2. C-Type mesh around NACA0012 airfoil.
25 c 20 c
20 c
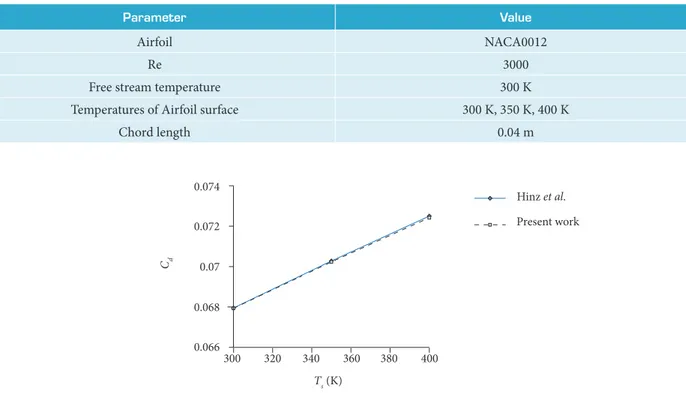
Mesh independency is done in Reynolds number, Re, of 3000, free stream temperature of 300 K and airfoil surface temperatures, TS, of 300 K, 350 K and 400 K. Various mesh numbers of 2000, 3000, 6000, 18000 and 25000 are considered to study the mesh
independency. Drag coefficients, Cd, of these mesh numbers are shown in Fig. 4. By raising mesh numbers from 18000 to 25000,
although computational cost increases, the accuracy is almost constant. Therefore, the mesh number of 18000 is employed. In order to validate current results, the drag coefficient of the present research is compared with that of Hinz et al. (2013).
J. Aerosp. Technol. Manag., São José dos Campos, v10, e4518, 2018 Improvement of Airfoils Aerodynamic Efficiency by Thermal Camber Phenomenon at Low Reynolds Number
xx/xx 05/13
Sutherland and Eucken’s relations are used to compute the dynamic viscosity and the thermal conductivity, respectively. According to Fig. 1, the dynamic viscosity increases with temperature increment. For Newtonian fluids, the viscous shear stress is proportional to dynamic viscosity and velocity gradient normal to the wall. As a result, the drag coefficient increases when the dynamic viscosity enhances. Drag enhancement increment is not desired from the aerodynamic point of view. Variation of the drag coefficient with surface temperatures between 200 K and 400 K are illustrated in Fig. 6. As shown in Fig. 6, temperature increment from 300 K to 400 K causes dynamic viscosity to be increased by 24.6%. However, dynamic viscosity is reduced by 28.2% as a result of reduction in temperature from 300 K to 200 K. Therefore, variation of drag in cooling is more than of heating and the diagram has become slightly non-linear. According to Kim et al. (2003) and this research results, cooling the upper surface, Tu,and heating the lower surface, Tl, can significantly enhance the aerodynamic efficiency. In other words, lift can be produced in
0.078 2,000
3,000 6,000 18,000 25,000 0.076
0.074
0.072
0.07
0.068
0.066
300 325 350 375 400
Ts(k)
Cd
(–)
0.074
Hinz et al.
Present work 0.072
0.068
0.066
300 320 340 360 380 400
Ts (K)
Cd 0.07
Table 1. Geometrical characteristics and flow of Hinz et al. (2013).
Value Parameter
NACA0012 Airfoil
3000 Re
300 K Free stream temperature
300 K, 350 K, 400 K Temperatures of Airfoil surface
0.04 m Chord length
Figure 4. Mesh independency for NACA0012 airfoil at Re = 3000 and various cell numbers.
Figure 5. Comparison between drag coefficient of present simulation and that of Hinz et al. (2013)
aforementioned condition even at a 0° AOA for a symmetric airfoil like NACA0012. This influence is introduced as thermal camber
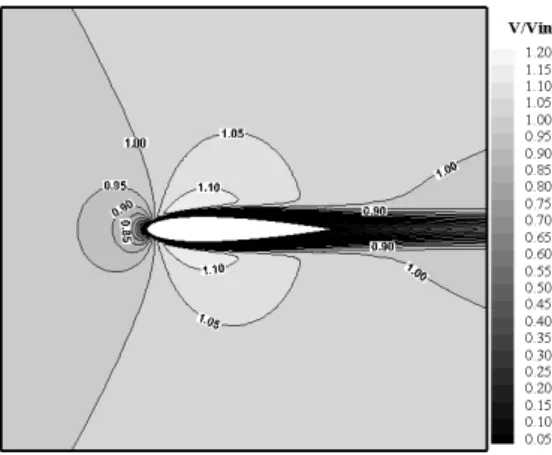
phenomenon. Hence, the upper and lower surface temperatures of a NACA0012 airfoil are set to 200 K and 400 K, respectively. Cooling the upper surface causes acceleration of the flow and subsequently decreases the pressure. This procedure is reversed for the lower surface. Consequently, pressure difference is created in order to generate lift force. Velocity and pressure contours for a NACA0012 airfoil at the surface temperature being equal to the free stream temperature are reported in Figs. 7 and 8. Figures 9 and 10 represent the velocity and the pressure contours of the flow around the airfoil with upper surface temperature of 200 K
0.064
0.062 0.068
0.066 0.07 0.074
0.072
200 250 300 350 400
Ts (K)
Cd
Figure 7. Velocity contour around NACA0012 airfoil at Re = 3000 and surface temperature of 300 K.
Figure 6. Variation of drag coefficient with surface temperature for NACA0012 airfoil at Re = 3000.
J. Aerosp. Technol. Manag., São José dos Campos, v10, e4518, 2018 Improvement of Airfoils Aerodynamic Efficiency by Thermal Camber Phenomenon at Low Reynolds Number
xx/xx 07/13
Cp
(–)
X (m) 1
0.75
0.5
0.26
0
–0.25
–0.5
0 0.01 0.02
NACA0012, Tup & Tdown = 300k NACA0012, Tup = 200k, Tdown = 400k
0.03 0.04
Figure 9. Velocity contour around NACA0012 airfoil at Re = 3000 and T
u = 200 K and Tl = 400 K.
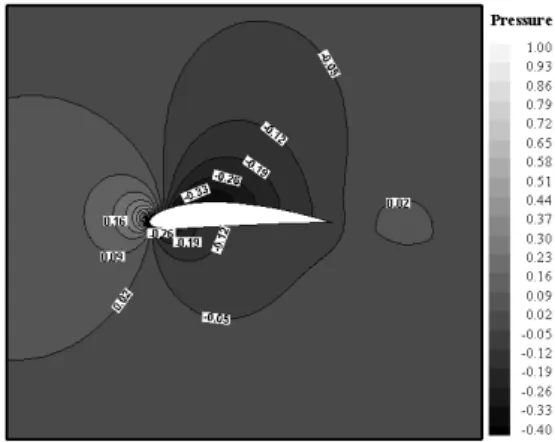
Figure 10. Pressure contour around NACA0012 airfoil at Re = 3000 and T
u = 200 K and Tl = 400 K.
Figure 11. Pressure coefficient for NACA0012 airfoil at Re = 3000.
Herein, two airfoils with physical camber, including NACA2412 and NACA4412 airfoils, are analyzed at a 0° AOA for the
surface temperature of the airfoils being equal to the free stream temperature. To validate the simulations of non-symmetric airfoils, the results of present simulations are compared with those of Abbott and Von Doenhoff (1959). Simulation is conducted in high Re. It is worth mentioning that using of turbulence model is unavoidable in this condition. Therefore, two turbulence
models, Spalart-Allmaras (S-A) and SST k – w, are considered to do simulation. Validation results are listed in Table 2. It is clear
that the obtained results have a good agreement with those of Abbott and Von Doenhoff (1959) especially by using SST k – ω and S – A models for NACA2412 and NACA4412 airfoils, respectively. Static pressure contour of NACA2412 and NACA4412 airfoils
are shown, respectively, in Figs. 12 and 13 at Re = 3000, c = 4 cm and for the surface temperature of the airfoils being equal to the
free stream temperature. According to these figures, pressure has the same behavior with that of NACA0012 airfoil in Fig. 10. The pressure coefficients for three airfoils are presented in Fig. 14. The upper and lower surface temperatures of NACA0012 airfoil are set to 200 K and 400 K, respectively. However, the two other airfoils are at a surface temperature similar to the free stream temperature. As shown in Fig. 14, NACA0012 airfoil with the help of thermal camber creates pressure difference in order
Table 2. Validation of NACA2412 and NACA4412 airfoils with experimental data of Abbott and Von Doenhoff (1959).
Lift coefficient of Abbott and Von Doenhoff (1959) Lift coefficient of present study
Airfoil
4.0 S-A model = 0.44
SST k – w model = 0.43
NACA4412 at Re = 3 × 10⁶
24.0 S-A model = 0.22
SST k – w model = 0.21
NACA2412 at Re = 3.1 × 10⁶
Figure 12. Pressure contour of NACA2412 airfoil in free stream temperature.
J. Aerosp. Technol. Manag., São José dos Campos, v10, e4518, 2018 Improvement of Airfoils Aerodynamic Efficiency by Thermal Camber Phenomenon at Low Reynolds Number
xx/xx 09/13
Cp
(–)
X (m) 1
0.75
0.5
0.25
0
–0.25
–0.5
0 0.01 0.02 0.03 0.04
NACA0012 NACA2412 NACA4412
Figure 14. Pressure coefficient of NACA2412 and NACA4412 airfoils in free stream temperature and
NACA0012 airfoil with T
u = 200 K and Tl = 400 K.
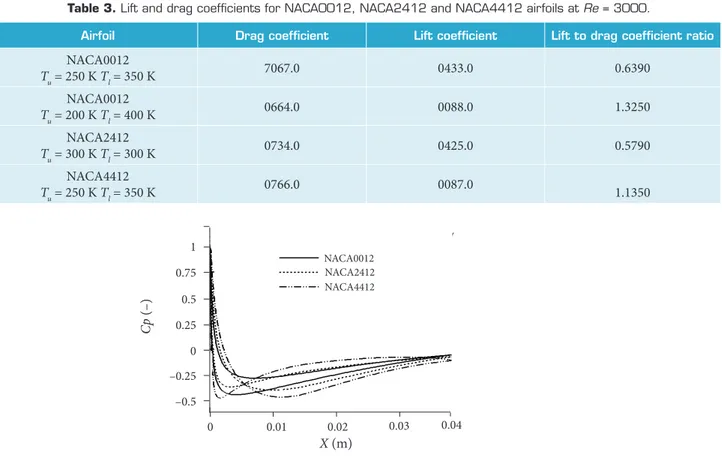
to produce positive lift. Drag and lift coefficients of these airfoils are shown in Table 3 at the conditions of Fig. 14. As shown in this Table, the lift coefficient, Cl, is reduced to almost 0.2 of the validation result because the Re is low in this research and this
point causes large growth of laminar boundary layer in comparison with the condition with high Re. In high Re, the boundary
layer will be attached strongly to the airfoil due to the great momentum of the flow but in LRN flow, high growth of laminar boundary layer on the airfoil can reduce the influence of the thermal camber. It can be deduced from Table 3 that in this Re,
the NACA0012 airfoil can produce the lift coefficient almost equal to the NACA4412 airfoil when the upper and lower surfaces are cooled and heated to 200 K and 400 K, respectively. Furthermore, it has less drag coefficient than the NACA4412 airfoil. Consequently, the lift to drag coefficient ratio of NACA0012 airfoil is more than that of NACA4412 airfoil. In addition, it can be concluded that thermal camber has more influence than physical camber on the aerodynamic coefficients. Additionally, when the upper and lower surfaces of NACA0012 airfoil are cooled and heated, respectively, to 250 K and 350 K, the lift coefficient of the NACA0012 airfoil can be reached to almost the NACA2412 airfoil. Also in this condition, the lift to drag coefficient ratio of the NACA0012 airfoil is more than that of the NACA2412 airfoil.
Herein, the NACA2412 and NACA4412 airfoils are analyzed in various conditions of cooling, heating and cooling-heating. Lift and drag coefficient variations of the NACA2412 and NACA4412 airfoils are shown in Figs. 15 and 16, respectively. Also, the lift to drag coefficient ratio of NACA2412 and NACA4412 airfoils are represented in Fig. 17. According to these figures, the drag coefficient has same trends with the NACA0012 airfoil. But cooling or heating the NACA0012 airfoil surfaces only affects the drag coefficient and, due to the symmetric geometry of the airfoil, the lift coefficient does not change considerably. However, cooling both surfaces of the non-symmetric airfoils leads to lift production because cooling has more influence on the upper surface of the non-symmetric airfoil than the other surface. These effects enhance the flow velocity on the upper surface and cause more pressure reduction on this surface. Consequently, more lift is produced than the condition with the surface temperature of the airfoil being
Table 3. Lift and drag coefficients for NACA0012, NACA2412 and NACA4412 airfoils at Re = 3000.
Lift to drag coefficient ratio Lift coefficient
Drag coefficient Airfoil
0.6390 0433.0
7067.0 NACA0012
Tu = 250 K Tl = 350 K
1.3250 0088.0
0664.0 NACA0012
Tu = 200 K Tl = 400 K
0.5790 0425.0
0734.0 NACA2412
Tu = 300 K Tl = 300 K
1.1350 0087.0
0766.0 NACA4412
equal to the free stream temperature. The reversed condition happens for heating. It seems that in order to reach the maximum aerodynamic efficiency, cooling the upper surface and heating the lower surface have better results. These outcomes for two airfoils are listed in Table 4. A similar trend as the NACA0012 airfoil in Table 3 is seen for the NACA2412 and NACA4412 airfoils in
0.09
0.08
0.07
0.06
0.05
0.04
0.03
200 250 300
Ts(K)
350 400
Cd
Cl
Fo
rce co
efficien
t (–)
0.11
0.1
0.09
0.08
0.07
0.06
200 250 300
Ts(K)
350 400
Cd
Cl
F
o
rce co
efficien
t (–)
1.8
1.6
1.2 1.4
0.8 1
0.6
0.4
0.2
200 250 300
Ts(K)
350 400
NACA2412
NACA4412
Cl
/
Cd
Figure 15. Variation of lift and drag coefficients with surface.
Figure 16. Variation of lift and drag coefficient with surface temperature for NACA4412 airfoil.
J. Aerosp. Technol. Manag., São José dos Campos, v10, e4518, 2018 Improvement of Airfoils Aerodynamic Efficiency by Thermal Camber Phenomenon at Low Reynolds Number
xx/xx 11/13
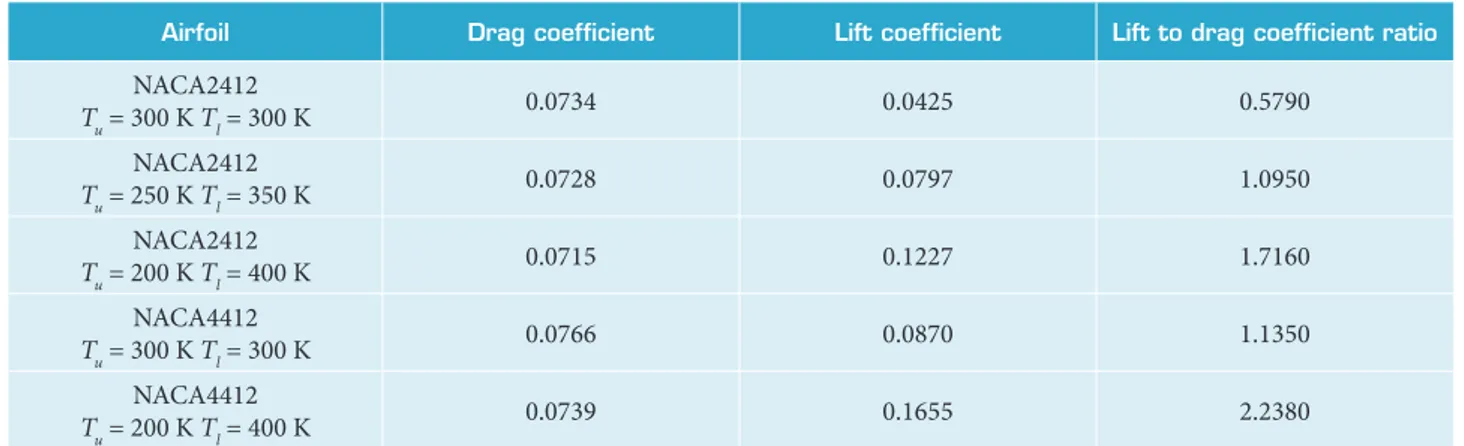
Table 4. In other words, by choosing specific temperature to cool and heat, respectively, the upper and lower surfaces of the NACA2412 airfoil, its efficiency can be raised to the value of NACA4412 airfoil. For instance, the same lift to drag coefficient ratio with the NACA4412 airfoil can be achieved by the NACA2412 airfoil with the upper surface temperature of 250 K and the lower surface temperature of 350 K. As explained before, this is because of the acceleration of the velocity at the upper surface and reduction of the lower surface velocity. This can cause pressure difference, which causes the lift force to be increased. This pressure difference is more than the condition when both surface of the airfoil is cooled. Additionally, according to Table 4 and Fig. 17, decreasing temperature of both NACA2412 airfoil surfaces from free stream temperature to 200 K causes a 36% increase in the lift to drag coefficient ratio. However, when the upper and lower surface temperatures are considered 250 K and 350 K, this improvement reaches 89%. Also, this value rises to 196% when the upper and lower surface temperatures are 200 K and 400 K, respectively. This improvement for the NACA4412 airfoil is less than the NACA2412 airfoil. For instance, when both surfaces of the NACA4412 airfoil are cooled from 300 K to 200 K, the lift to drag coefficient ratio increases by 33%, that is 3% less than of the NACA2412 airfoil. When the upper and lower surface temperatures of the NACA4412 airfoil are set, respectively, to 200 K and 400 K,improvement of the lift to drag coefficient ratio is 97%, which is 99% less than the NACA2412 airfoil in the same condition. Generally, it can be concluded that cooling the upper surface and heating the lower surface have more advantages than equal cooling of both surfaces.
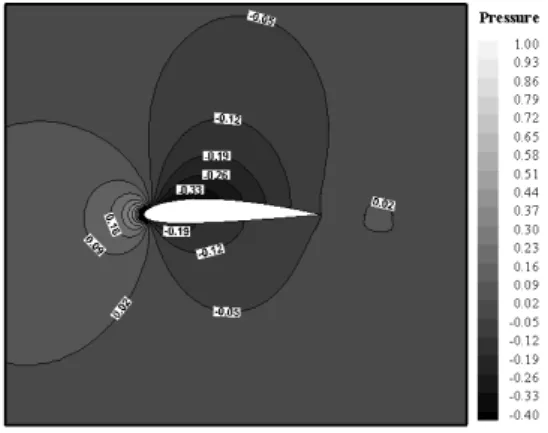
Pressure coefficient diagram for the NACA2412 airfoil is demonstrated in Fig. 18. Increment and decrement of the pressure, respectively, on lower and upper surfaces by thermal effects, can be seen in this figure. Figure 19 represents the static pressure contour of the NACA2412 airfoil with the upper surface temperature of 200 K and lower surface temperature of 400 K. In comparison with Fig. 12, increment and decrement of the pressure, respectively, on lower and upper surfaces can be justified. Also, in comparison with Fig. 13, the aerodynamic improvement of the NACA2412 airfoil against the NACA4412 airfoil without thermal effects is clear.
1
0.75
0.25 0.5
–0.25 0
–0.5
0 0.01 0.02
X (m) 0.03
Cp
NACA2412, Tup & Tdown = 300k
NACA2412, Tup = 200k, Tdown = 400k
Figure 18. Pressure coefficient contour for NACA2412 airfoil at Re = 3000.
Table 4. Lift and drag coefficients for NACA2412 and NACA4412 airfoils at Re = 3000.
Lift to drag coefficient ratio Lift coefficient
Drag coefficient Airfoil
0.5790 0.0425
0.0734 NACA2412
Tu = 300 K Tl = 300 K
1.0950 0.0797
0.0728 NACA2412
Tu = 250 K Tl = 350 K
1.7160 0.1227
0.0715 NACA2412
Tu = 200 K Tl = 400 K
1.1350 0.0870
0.0766 NACA4412
Tu = 300 K Tl = 300 K
2.2380 0.1655
0.0739 NACA4412
Figure 19. Pressure contour around NACA2412 airfoil at Re = 3000 and T
u = 200 K and Tl = 400 K.
CONCLUSION
The aim of this research was to investigate the effects of the thermal camber phenomenon on the aerodynamic performance of airfoils. Due to this, steady, laminar and compressible flow around the NACA0012, NACA2412 and NACA4412 airfoils were simulated numerically. The main findings of the present study can be summarized as follows:
• Cooling or heating the surfaces of the NACA0012 airfoil only affects the drag coefficient due to its symmetric geometry and the lift coefficient does not change significantly. However, the lift can be produced by cooling the upper surface and heating the lower surface. Furthermore, the lift to drag coefficient ratio increases by this method.
• When the upper and lower surface temperatures of the NACA0012 airfoil are set, respectively, to 250 K and 350 K, its aerodynamic efficiency will be 10.36% higher than the NACA2412 airfoil.
• When the upper and lower surface temperatures of the NACA0012 airfoil are set, respectively, to 200 K and 400 K, its aerodynamic efficiency will be 16.74% higher than that of NACA4412 airfoil.
• Cooling the upper surface and heating the lower surface of the NACA2412 airfoil can increase the aerodynamic efficiency up to the NACA4412 airfoil.
• Cooling the upper surface and heating the lower surface have more influence on the improvement of aerodynamic efficiency than only cooling or heating the surfaces. It should be noted that this research has been done at a 0° AOA, and
thermal camber in higher AOA can still be important.
AUTHOR’S CONTRIBUTION
Conceptualization, Samiee A and Djavareshkian MH; Methodology, Samiee A and Djavareshkian MH; Investigation, Samiee
A, Djavareshkian MH, Feshalami BF and Esmaeilifar E; Writing – Original Draft, Feshalami BF; Writing – Review and Editing,
Esmaeilifar E; Supervision, Djavareshkian MH.
Abbott IH, Von Doenhoff AE (1959) Theory of wing sections, including a summary of airfoil data. New York: Dover Publications.
Bekka N, Bessaih R, Sellam M, Chpoun A (2009) Numerical study of heat transfer around the small scale airfoil using various turbulence models. Numer Heat Transfer, Part A 56(12):946-969. doi: 10.1080/10407780903508005
J. Aerosp. Technol. Manag., São José dos Campos, v10, e4518, 2018 Improvement of Airfoils Aerodynamic Efficiency by Thermal Camber Phenomenon at Low Reynolds Number
xx/xx 13/13
Eucken A (1940) Allgemeine gesetzmäßigkeiten für das wärmeleitvermögen verschiedener stoffarten und aggregatzustände. Forschung auf dem Gebiet des Ingenieurwesens A 11(1):6-20. doi: 10.1007/BF02584103
Febi Ponwin S, Rajkumar S (2015) Methods for improving lift force of wind turbine aerofoil blades during low wind speed conditions – a review. Appl Mech Mater 787:134-137. doi: 10.4028/www.scientific.net/AMM.787.134
Hinz DF, Alighanbari H, Breitsamter C (2013) Influence of heat transfer on the aerodynamic performance of a plunging and pitching NACA0012 airfoil at low Reynolds numbers. J. Fluids Struct 37:88-99. doi: 10.1016/j.jfluidstructs.2012.08.012
Incropera FP, Dewitt DP (1990) Introduction to Heat Transfer. 2nd ed. New York: John Wiley and Sons.
Kim J, Rusak Z, Koratkar N (2003) Small-scale airfoil aerodynamic efficiency improvement by surface temperature and heat transfer. AIAA J 41(11):2105-2113. doi: 10.2514/2.6829
Landrum D, Macha J (1987) Influence of a heated leading edge on boundary layer growth, stability, and transition. Presented at: 19th AIAA, Fluid Dynamics, Plasma Dynamics, and Lasers Conference; Honolulu, USA. doi: 10.2514/6.1987-1259
Longo J, Radespiel R (1995) Numerical simulation of heat transfer effects on 2-D steady subsonic flows. Presented at: 26th Fluid Dynamics Conference; San Diego, USA. doi: 10.2514/6.1995-2298
Mabey DG (1990) Effects of heat transfer on aerodynamics and possible implications for wind tunnel tests. Prog Aerosp Sci 27(4):267-303. doi: 10.1016/0376-0421(90)90001-Z
Norton DJ, Macha JM, Young JC (1973) Surface temperature effect on subsonic stall. J Spacecr Rockets 10(9):581-587. doi: 10.2514/3.61929
Open CFD Limited (2008) OpenFOAM – the open source CFD toolbox user guide, version 1.5.
Raghunathan S, Mitchell D (1995) Computed effects of heat transfer on the transonic flow over an aerofoil. AIAA J 33(11):2120-2127. doi: 10.2514/3.12956
Stock HW (2002) Wind tunnel–flight correlation for laminar wings in adiabatic and heating flow conditions. Aerosp Sci Technol 6(4):245-257. doi: 10.1016/S1270-9638(02)01166-5