ACCEPTED
JMB Papers in Press. First Published online Jan 15, 2015DOI: 10.4014/jmb.1408.08015 Manuscript Number: JMB14-08015
Title: Kinetic and energetic parameters of carob wastes fermentation by Saccharomyces cerevisiae: Crabtree effect, ethanol toxicity and invertase repression.
Article Type: Research article
Keywords: Bioethanol, Carob pod, Fermentation, Invertase synthesis, Saccharomyces, 2nd generation biofuels
ACCEPTED
1Kinetic and energetic parameters of carob wastes fermentation by Saccharomyces 1
cerevisiae: Crabtree effect, ethanol toxicity and invertase repression.
2 3
B. Rodrigues1, J. M. Peinado2, S. Raposo1, A. Constantino1, C. Quintas3, 4
M. E. Lima-Costa1* 5
6
(1)
Centre for Marine and Environmental Research – CIMA - Faculty of Sciences and
7
Technology - University of Algarve - Campus de Gambelas, 8005-139 Faro. Portugal
8
(2)
Faculty of Biology, Department of Microbiology III, Universidad Complutense, 28040
9
Madrid. Spain
10
(3)
Institute of Engineering, University of Algarve, 8005-139 Faro. Portugal. 11
12
*Correspondence author: 13
Maria Emília Lima Costa 14
Centre for Marine and Environmental Research - CIMA - Faculty of Sciences and 15
Technology - University of Algarve - Campus de Gambelas, 8005-139 Faro. Portugal 16
E-mail: [email protected] 17
Phone number: +351.289.800992, ext 7992. 18
Fax: +351.289.818419 19
20
Brief running title: Carob wastes fermentation by Saccharomyces cerevisiae. 21
22 23 24 25
ACCEPTED
2Abstract
26
Carob wastes are useful raw material for 2nd generation ethanol because 50% of its dry 27
weight is sucrose, glucose and fructose. To optimize the process, we have studied the 28
influence of the initial concentration of sugars on the fermentation performance of 29
Saccharomyces cerevisiae. With initial sugar concentrations (S0) of 20 g/l the yeasts were
30
derepressed and the ethanol produced during the exponential phase was consumed in a 31
diauxic phase. The rate of ethanol consumption decreased with increasing S0 and disappeared
32
at 250 g/l when the Crabtree effect was complete and almost all the sugar consumed was 33
transformed into ethanol with a yield factor of 0.42 g/g. Sucrose hydrolysis was delayed at 34
high S0 because of glucose repression of invertase synthesis, that was triggered at
35
concentrations above 40 g/l. At S0 higher than 250 g/l, even when glucose had been exhausted,
36
sucrose was hydrolyzed very slowly, probably due to an inhibition at this low water activity. 37
Although with lower metabolic rates and longer times of fermentation, 250 g/l is considered 38
the optimal initial concentration because it avoids the diauxic consumption of ethanol, it 39
maintains enough invertase activity to consume all the sucrose and also avoids the inhibitions 40
due to lower water activities at higher S0.
41 42
Keywords Bioethanol, Carob pod, Fermentation, Invertase synthesis, Saccharomyces, 2nd 43 generation biofuels. 44 45 46 47 48 49 50
ACCEPTED
3Introduction
51
One of the challenges of this century is the progressive shift from fossil energy to 52
renewable fuels. Biofuels are one of the solutions to the continuous rising of oil prices, 53
exhaustion of fossil sources, greenhouse gas emissions reduction and dependence of the 54
Middle East volatile politics. The requirements of the Kyoto Protocol and Bali Action Plan 55
encouraged the search for renewable feedstock, as sources for biofuels. Fermentation 56
processes stand out in bioethanol production since they transform simple raw materials into 57
products with aggregated value [4]. The answer to these problems could be found in second 58
generation bioethanol produced by agro-industrial residues, since its use does not compete 59
with food resources; it also allows the exploitation of raw materials with low commercial 60
value and arranges an alternative to their disposal. A wide variety of these raw materials are 61
used as carbon sources for bioethanol production, namely, sugarcane molasses, beet molasses, 62
pineapple, orange and sweet lime residues or carob industrial wastes [4, 12, 8, 6]. 63
Carob tree (Ceratonia siliqua L.) grows in the Mediterranean region and southwest 64
Asia. Approximately 50,000 tons of carob pod are produced each year in Algarve, south 65
region of Portugal [6]. 66
The carob pod pulp exhibits a sugar content higher than sugar cane and the analysis of 67
some Turkish carob varieties showed that the most abundant sugar is sucrose with 29.9-38.4 % 68
(w/w), followed by fructose with 10.2–11.5 % (w/w) and the less abundant is glucose with 69
3.30-3.68 % (w/w) [17, 18]. 70
The high-level of sugar content combined with low prices makes the carob-based 71
nutrient medium an advantageous alternative to carbon sources for ethanol production. 72
Many research groups developed intensive studies to obtain efficient fermentative 73
organisms, low-cost substrates and optimal conditions for fermentation [6,17]. The persistent 74
search for different low-cost carbon sources brings as a consequence, a large variability of 75
ACCEPTED
4complex polysaccharides and increases the need of understanding the hydrolysis processes 76
and how the resultant sugars are metabolized and converted in ethanol. 77
To accomplish a high ethanol yield and increased productivity the optimal 78
fermentation conditions have been subjected to substantial improvements like the integration 79
of very high-gravity (VHG) technology, by using heavily concentrated substrate. However, 80
several problems are associated to VHG technology. One of these is the incomplete 81
fermentation process caused by several stress conditions, in particular and most important, the 82
osmotic effect of the high sugar concentration on the initial stage and the ethanol inhibition 83
during the production stage. These stress conditions would result in loss of cell viability, 84
growth and weak fermentation performance [19]. 85
Saccharomyces cerevisiae, is a microorganism predominantly selected, since it has a
86
good fermentative capacity as well as high tolerance to ethanol and other inhibitors [10]. At 87
high glucose concentration of the medium, catabolite repression occurs [7] as both the 88
expression of the specific genes involved in tricarboxilic acid cycle, oxidative 89
phosphorylation, glyoxylate cycle, gluconeogenesis and the metabolism of the other sugars 90
are repressed. Simultaneously, the expression of genes involved in alcoholic fermentation is 91
induced and will result in the preferential consumption of glucose over the other carbon 92
sources [11]. 93
Molecular transport is a determining factor of cellular metabolism, mainly when the 94
carbon source is not the preferential one, as in the fructose and sucrose case in Saccharomyces 95
cerevisiae. Glucose and fructose use the same facilitated diffusion system but glucose has a
96
prevailing affinity, inhibiting competitively fructose transport. Invertase hydrolysis should 97
balance the monosaccharides’ supply of the medium and their yeast consumption, in a way 98
that the medium osmolality remains at a minimum value during the fermentation [16]. It was 99
also shown, in the same work that regulation of the invertase activity could result in a more 100
ACCEPTED
5efficient alcoholic fermentation. The glucose in carob residue substrate, at a concentration 101
above at threshold value, represses invertase synthesis and sucrose hydrolysis does not occur 102
until the glucose concentration reaches values below the threshold [6]. 103
In general, the lower affinity of hexose transporters for fructose, when comparing to 104
glucose, explains the residual fructose prevalence at the end of fermentation. However, the 105
role of sugar transport systems in efficient fermentation processes remains unsolved [14]. 106
In this work, carob waste fermentations with low and high initial sugar concentrations 107
were performed and the kinetic and energetic parameters of cell growth, as well as the 108
consumption rates of glucose, fructose and sucrose hydrolysis were calculated in each of the 109
media with different initial sugar concentrations. 110
The establishment of the best technological conditions to achieve the highest ethanol 111
productivities and yields for 2nd generation biofuel production, using carob industrial wastes 112
as raw-material, was a major goal of the present work. In order to identify the factors that 113
limit the fermentation efficiency, Crabtree effect, invertase repression and ethanol toxicity 114
were studied in the present work, using kinetics and energetic approaches. 115
116
Materials and Methods
117
Microorganism 118
An industrial winery strain of Saccharomyces cerevisiae F13A was used [13]. This 119
strain has been widely used in our previous works due to its ethanol tolerance [6]. 120
121
Culture media and preculture conditions 122
The strain was maintained on solid YEPD medium (peptone 20 g/l, yeast extract 10 g/l, 123
glucose 20 g/l, agar 15 g/l). Inocula were made in 250 ml shake flasks, containing 50 ml of 124
liquid YEP medium (yeast extract 5 g/l, peptone 10 g/l) supplemented with carob extract. 125
ACCEPTED
6The cultures were incubated in an orbital shaker (NeifoPentlab, Portugal), at 150 rpm and 126
30ºC, until it reach late exponential growth phase. These cultures were used as inocula to get 127
a initial cell concentrations of about 1 x 10⁷ cells/ml. 128
129
Aqueous carob extraction 130
The carob residue extract was prepared as described in Lima-Costa et al. [6]. The 131
carob kibbles were dried to constant weight, ground, and the powder was suspended in 132
distilled water at solid/liquid ratio 30 % (w/v). This mixture was homogenized at 150 rpm, 25 133
ºC for 1 h. After this period, to clarify the carob extract, the mixtures were centrifuged at 134
22000 g, at 4 ºC for 25 min (Beckman Instruments, E.U.A), filtered through a 11 µm 135
membrane. Aqueous carob extract had a concentration of approximately 140 g/l total sugars. 136
For the assays at higher sugar concentrations the carob extract was concentrated using a rotary 137
evaporator (Heidolph 94200, Germany) at a temperature of 70 °C. The carob extract 138
concentrate is stored at a temperature of -20 ° C [7]. 139
140 141
Culture conditions 142
Batch fermentations were performed at laboratory scale, in 250 ml shake flasks 143
containing 100 ml of YEP medium, supplemented with different concentrations of carob pulp 144
extract at an initial fresh cells concentration of 1 x 10⁷ cells/ml. Fermentations were 145
performed at different initial carbon concentrations of 20, 50, 100, 150, 200, 250 and 300 g/l 146
of carob pod extract (CPE). The initial pH was 6.5 for all assays. Flasks were incubated in an 147
orbital shaker (NeifoPentlab, Portugal) at 150 rpm, 30 ºC for 96 h. Samples were collected for 148
analysis at the beginning of the experiments and every 2 hours. Absorbance at 590 nm, dry 149
weight (DW), pH, sugar consumption, and ethanol production were measured in the broth as 150
ACCEPTED
7described in ‘‘Analytical methods’’. Each assay was conducted in three replicates and 151 repeated twice. 152 153 Analytical methods 154
Absorbance was measured spectrophotometrically (Cintra 202 GBC DBUV 155
instrument, Australia) at 590 nm. Nutrient medium was used as a blank. Absorbance values at 156
590nm were converted into biomass concentration (g DW/l), using a standard curve. DW was 157
determined by centrifuging the cultures (Hettrich Zentrifugen Universal 320), as described 158
previously in Lima-Costa et al. [6]. Sugars and ethanol analyses were performed by high 159
performance liquid chromatography (HPLC) using samples previously centrifuged at 13400 g 160
for 10 min. Analyses were performed on a Beckman System Gold HPLC (Beckman, USA) 161
equipped with a Jasco 1530 refractive index detector (Jasco, Japan). To analyze sugar 162
concentrations, a Purospher STAR NH2 column (Merck KGaA, Germany) was used with an
163
isocratic elution of acetonitrile:water (75:25) at 35ºC. Ethanol determinations were performed 164
on an OH AY column (Merck KGaA, Germany), at room temperature with an isocratic 165
elution of 0.002 N H2SO4 at 0.5 ml/min.
166
Determination of kinetics and energetics parameters of growth 167
The specific growth rates (h-1) were calculated using the DMFIT modeling tool 168
(http://modelling.combase.cc) [2]. The biomass yield YX/S (grams of biomass produced per
169
gram of sugar consumed) and ethanol yield YE/S (grams of ethanol produced per gram of
170
sugar consumed) were calculated as the slope, fitted by linear regression, of the corresponding 171
values of biomass or ethanol produced versus total sugar consumed at the corresponding time 172
intervals. 173
The rates of sucrose hydrolysis, measured as grams of sucrose per hour per gram of dry 174
weight, were calculated as the slope, fitted by linear regression, of the values of sucrose 175
ACCEPTED
8concentration versus time, during the first 3 to 6 hours of fermentation, divided by the cell dry 176
weight corresponding to the middle time of the interval. The specific rates of ethanol 177
production, qEth, during the exponential phase were calculated as:
178
=
/ (1)
179
and the specific rate of production or consumption during the stationary phase were calculated 180
as the slope of ethanol concentration versus time, divided by the constant biomass 181
concentration at that growth phase, Xmax:
182 = ⁄ (2) 183 184 185 186 187 188 189 190 191 192 193 194 195 196 197 198
ACCEPTED
9Results and Discussion
199
Influence of the initial carob sugars concentration on biomass growth kinetics 200
To analyze if the sugars present in carob waste triggered a Crabtree effect in S. 201
cerevisiae, fermentations runs were performed at eight different initial sugar concentrations
202
from 20 to 350 g/l. The corresponding values of biomass, ethanol production and total sugar 203
consumption, at these different concentrations, performed as described in Methods, are 204
displayed in Fig.1. At any initial sugar concentration, except at the lowest one (20 g/l), cell 205
growth presented a biphasic kinetics with an exponential phase and a stationary phase. In 206
contrast, at 20 g/l a diauxic growth could be observed and, instead of the stationary phase, a 207
second growth phase, consuming ethanol as carbon source could be measured, with a µ of 208
0.0049 h-1 (Table 1). Between 20 and 100 g/l, transitions between the exponential and the 209
stationary phases were very abrupt and correspond to the exhaustion of sugar in the culture 210
(Fig. 1, A, B and C). At the highest tested concentrations (250 to 350 g/l), the sugars were no 211
longer the limiting factor when the stationary phase was reached, because at this point there 212
were still sugars available in the medium (Fig. 1, F, G and H). In these cases, we submit that 213
ethanol was the factor limiting growth. At concentrations higher than 250 g/l the cells were 214
not even able to consume all the sugars added and, consequently, the final biomass decreased. 215
In relation to specific growth rates (µ), longer exponential growth phases were found with 216
increased sugar concentrations (Fig. 1), but with decreasing µ values (Table 1). Several 217
physiological mechanisms, underlying this decrease, were identified. The initial sugar 218
concentration affected the biomass yield factor, i.e., less biomass was produced per gram of 219
sugar consumed, due probably to the osmotic stress (Table 1). 220
The energetic efficiency of the sugar catabolism affected also the value of µ. During 221
the first 3 hours of culture, for S0 below 150 g/l, there was sugar consumption but no ethanol
222
was produced (Fig. 1), which indicates that oxygen was available and the catabolism was 223
ACCEPTED
10completely oxidative. After that time ethanol begun to be produced and the catabolism was 224
progressively fermentative. This change in the efficiency of energy metabolism determined 225
the decrease in the yield factor biomass/sugar from 0.13 to 0.02 g/g (Table 1). To analyze 226
more deeply the effect of the initial sugar concentration on the yeast fermentation 227
performance, the data on the different sugars consumption and biomass and ethanol 228
production were analyzed quantitatively and the corresponding rates of sugars consumption 229
and ethanol production in the different growth phases were calculated. 230
231
Kinetics of ethanol production and consumption during the growth and stationary 232
phases, depending on the different initial carob sugar concentrations. 233
Ethanol profiles at the different initial sugar concentrations were determined along the 234
whole growth curve. From these values, the specific rates of ethanol production or 235
consumption (qE) were calculated, as described in Material and Methods, and the values are
236
included in Table 1. In this table, a positive sign was added to qE when there was net
237
production of ethanol, and a negative one, when there was net consumption. As mentioned 238
before, ethanol was always produced during the growth phase, at any initial sugar 239
concentration. From 20 to 100 g/l of initial total sugar an increase of qE, from 0.4 to 1.0 g of
240
ethanol per g of biomass per hour was observed. That was the maximal production rate 241
reached because at higher initial sugar concentrations the rate decreased (Table 1). The 242
increase of qE can be explained by the Crabtree effect that occurs in these species, which
243
consists in the repression of the synthesis of some components of the respiratory chain 244
(cytochromes) at high external glucose concentrations, enhancing fermentation process [7]. 245
This Crabtree effect hypothesis was supported by the yeasts behavior because, when all the 246
glucose had been consumed, cytochromes synthesis was derepressed, and ethanol was in fact 247
oxidized. At 20 g/l of initial sugar, after glucose exhaustion, the yeasts were completely 248
ACCEPTED
11derepressed and were able to perform a diauxic growth, consuming all the ethanol that has 249
been produced (Fig. 1A). A similar pattern could be observed at 50 up to 200 g/l of initial 250
sugars, but with an apparent lower derepression, as measured by the specific rates of ethanol 251
consumption, that decreased from 26 mg of ethanol per gram of biomass per hour at an initial 252
glucose concentration of 6.1 g/l (Fig. 2A) to 10 mg of ethanol per gram of biomass per hour at 253
an initial glucose concentration of 44.8 g/l. (Fig. 2C, Table1). Apparently, this low 254
consumption did not provide energy enough to synthesize new biomass and, although ethanol 255
consumption could be measured, no increase in biomass could be detected (Fig. 1 B, C, D, E, 256
Table 1). It may be argued that, once glucose was exhausted, derepression should take place 257
completely. An alternative hypothesis to explain the differences observed with increasing S0
258
values may be based on the action of the ethanol accumulated, that would inhibit both the 259
synthesis of new biomass and the synthesis of the components of the respiratory chain, e.g., 260
the derepression of respiratory chain [6]. 261
At concentrations higher than 200 g/l of initial sugar, none of the accumulated ethanol 262
was consumed during the stationary phase (Fig. 1 and Table 1). On the contrary, at these high 263
concentrations the alcohol continued to be produced by the metabolically uncoupled cells, 264
unable to grow but yet able to ferment (Table 1). However, the specific ethanol production 265
rates were much lower (0.11 to 0.13 g/g.h) than those of the exponential phase (0.67 to 266
0.84g/g.h) (Table 1), indicating that the accumulated ethanol was partially inhibiting the 267
fermentation. 268
From a stoichiometric point of view, it can be concluded that the initial sugar 269
concentration showed a strong effect on the final amount of ethanol accumulated in the 270
culture (see Table 2). Up to 200 g/l total sugar, all the ethanol was produced during the 271
exponential phase. However, at these low sugar concentrations, after glucose exhaustion, 272
ethanol was completely consumed when S0 was 20 g/l and in significant amounts at 50 and
ACCEPTED
12100 g/l. This behavior changed at S0 concentrations higher than 250 g/l, at which ethanol was
274
not consumed but produced by the uncoupled stationary cells, in an amount similar or even 275
higher than that produced by the exponential cells (Table 1 and 2). It must be remarked that at 276
these high S0 values, the stoichiometric relation between sugar consumed and ethanol
277
produced (Ethnet), which included the alcohol produced by both exponential and stationary
278
cells, showed values near to the maximal theoretical value that can be obtained if all the sugar 279
was fermented: 0.51 g of ethanol per g of sugar (Table 2). The highest ethanol/sugar yield, 280
0.42 g/g was obtained with an initial sugar concentration of 250 g/l. 281
282
Regulation of sugars consumption: Repression of invertase synthesis and inhibition of its 283
activity. 284
As the most abundant sugar in carob pulp is sucrose and, in Saccharomyces cerevisiae, 285
sucrose is not transported inside the cell but hydrolyzed extracellularly, the observed sucrose 286
concentration decrease is a direct measurement of invertase activity [9]. Although the 287
consumption of the three sugars present in the carob pulp (sucrose, glucose, fructose) was 288
measured along time, in the eight S0 values assayed in this work, only four of them, those
289
corresponding to 20, 100, 250 and 350 g/l, are displayed in Fig 2. 290
It can be observed that sucrose concentration decreased immediately after inoculation 291
at the lowest initial sugar concentration (20 g/l), indicating that active invertase was present. 292
The invertase activity was so high in this condition that the concentration of glucose in the 293
culture increased, because its production by sucrose hydrolysis was higher that its 294
consumption by the cells (see Fig. 2A). This immediate sucrose hydrolysis was also present at 295
100 g/l fermentation, although at a lower rate, as shown by the rate of sucrose disappearance 296
and by the fact that the concentration of glucose did not increase. However, at fermentations 297
performed at higher S0 (see the case of 250 g/l in Fig. 2C) sucrose was not immediately
ACCEPTED
13hydrolyzed and only when glucose had been consumed, sucrose hydrolysis showed a high rate. 299
Anyway, at this sugar concentration the invertase activity was enough to hydrolyze all the 300
added sucrose (Fig. 2C). At even higher S0 concentrations, 350g/l (Fig. 2D), it was observed
301
that invertase activity increased very slowly, even when glucose concentration was very low, 302
indicating that, although derepression may have taken place, either the enzyme was not being 303
synthetized, due to the action of the accumulated ethanol (about 40 g/l) and/or its activity was 304
being inhibited by the high osmolality of the medium (water activity, aw of 0.964) value [3,6].
305
This dependence of invertase activity on the water activity of the culture has been previously 306
reported [17]. In any case, with S0 equal to 350 g/l the invertase activity was so low that
307
sucrose was not completely hydrolyzed and 52 % of the initial sucrose concentration 308
remained in the culture, even after 96 hours of fermentation. 309
As mentioned, invertase activity could be quantified as the specific rate of sucrose 310
hydrolysis, calculated as described in Material and Methods, and this rate was taken as a 311
indirect measure of the amount of enzyme synthesized. When these rates were related with the 312
corresponding glucose concentrations in the culture, as depicted in Fig. 3, it could be 313
observed that, whatever is the initial concentration of total sugar in medium, invertase 314
synthesis seems to be repressed at glucose concentrations higher than 40 g/l (Fig. 3). 315
316
Technological consequences of initial sugars concentration on ethanol net production: 317
Crabtree effect and invertase repression and inhibition 318
Taking in consideration the data of Table 2 it can be concluded that, from all the sugar 319
concentrations assayed, 250 g/l is the best concentration to be used in industrial processes for 320
ethanol production from carob wastes sugars. At this sugar concentration the diauxic behavior 321
is not present at all and ethanol is not consumed during the stationary phase (Fig. 1F). 322
Crabtree effect may be at its maximum, glucose respiration is almost completely repressed 323
ACCEPTED
14and, therefore, catabolism is completely fermentative, with an ethanol/sugar yield of 0.42 g/g, 324
near the maximum (Table 2). Working at this S0 concentration had another advantage, ethanol
325
is produced by both cells, exponential (82 %) and stationary (18 %). Although invertase is 326
initially repressed, the complete glucose consumption enables its derepression. The 327
determined water activity (aw)of 0.964 is not low enough to inhibit strongly the hydrolysis of
328
sucrose, as happens at higher concentrations, and sucrose can be completely consumed. At 329
this optimal concentration of 250 g/l, the metabolic rates are slower than at lower S0 values,
330
due to physiological reasons that have been analyzed above, and the ethanol productivity, 331
although not the highest, is close to the maximal obtained (Table 2). Another remarkable 332
advantage is the high final concentration of ethanol attained, close to 100 g/l in these assayed 333 conditions. 334 335 Acknowledgments 336
This research was financially supported by Project Alfaetílico, as part of the Portuguese 337
National Program QREN-POAlgarve21. We also thank to AGRUPA - Industrial Cooperative 338
of Carob and Almond Producers for the supply of carob kibbles. We thank the donation of 339
the Saccharomyces cerevisiae F13A strain by Prof Célia Quintas. 340
341
References 342
1. Avallone R, Plessi M, Baraldi M, Monzani A. 1997. Determination of chemical 343
composition of carob (Ceratonia siliqua): protein, fat, carbohydrates and tannins. J. Food 344
Compos. Analysis. 10 :166-172.
345
2. Baranyi J, Roberts TA. 1994. A dynamic approach to predicting bacterial growth in food. 346
International Journal of Food Microbiology 23 :277-294.
ACCEPTED
153. Brown SW, Oliver SG, Harrison DEF, Righelato RC. 1981. Ethanol inhibition of yeast 348
growth and fermentation: differences in the magnitude and complexity of the effect. 349
European J. App. Microbiol. Biotechnol. 11: 151-155.
350
4. Cazetta ML, Celligoi MAPC, Buzato JB, Scarmino IS. 2007. Fermentation of molasses by 351
Zymomonas mobilis: effects of temperature and sugar concentration on ethanol production.
352
Bioresour Technol, 98: 2824–2828.
353
5. Forbes C, O’Reilly C, McLaughlin L, Gilleran G, Tuohy M, Colleran E. 2009. Application 354
of high rate, high temperature anaerobic digestion to fungal thermozyme hydrolysates from 355
carbohydrate wastes. Water research. 43: 2531–2539. 356
6. Lima-Costa ME, Tavares C, Raposo S, Rodrigues B, Peinado JM. 2012. Kinetics of sugars 357
consumption and ethanol inhibition in carob pulp fermentation by Saccharomyces cerevisiae 358
in batch and fed-batch cultures. J Ind Microbiol Biotechnol. 39: 789-797. 359
7. Meijer MM, Boonstra J, Verkleij AJ, Verrips CT. 1998. Glucose repression in 360
Saccharomyces cerevisiae is related to the glucose concentration rather than the glucose flux.
361
J. Biol. Chem. 273: 24102-24107.
362
8. Mishra J, Kumar D, Samanta S, Vishwakarma MK. 2012. A comparative study of etanol 363
production from various agro residues by using Saccharomyces cerevisiae and Candida 364
albicans. Journal of Yeast and Fungal Research. 3: 12-17.
365
9. Mormeneo S and Sentandreu R. 1982. Regulation of invertase synthesis by glucose in 366
Saccharomyces cerevisiae. The Federation of European Biochemical Societies Journal. 152:
367
14-18. 368
10. Mussato SI, Dragone G, Guimarães PMR, Silva JPA, Carneiro LM, Roberto IC, Vicente 369
A, Domingues L, Teixeira JA. 2010. Technological trends, global market, and challenges of 370
bio-ethanol production. Biotechnology Advances. 28: 817-830. 371
ACCEPTED
1611. Raamsdonk LM, Diderich JA, Kuiper A, Gaalen M, Kruckberg AL, Berden JA, Dam K. 372
2001. Co-consumption of sugars or ethanol and glucose in a Saccharomyces cerevisiae strain 373
deleted in the HXK2 gene. Yeast. 18: 1023–1033 . 374
12. Raposo S, Pardão JM, Díaz I, Lima-Costa ME. 2009. Kinetic modelling of bioethanol 375
production using agro-industrial by-products. International Journal of Energy and 376
Environment. 3: 1-8.
377
13. Santo DE, Galego L, Gonçalves T, Quintas C. 2012. Yeast diversity in the Mediterranean 378
strawberry tree (Arbutus unedo L.) fruits' fermentations. Food Research International. 47: 379
45–50. 380
14. Santos J, Sousa MJ, Cardoso H, Inácio J, Silva S, Spencer-Martins I, Leão C. 2008. 381
Ethanol tolerance of sugar transport, and the rectification of stuck wine fermentations. 382
Microbiology. 154: 422-430.
383
15. Santos M, Teixeira J, Rodrigues A. 2005. Production of dextran and fructose from carob 384
extract and cheese whey by Leuconostoc mesenteroides NRRL B512(f). Biochem. Eng. J. 25: 385
1-6. 386
16. Takeshige K and Ouchi K. 1995. Effects of yeast invertase on ethanol production in 387
molasses. Journal of Fermentation and Bioengineering. 79: 513-515. 388
17. Thongchul N, Navankasattusas S, Yang ST. 2010. Production of lactic acid and ethanol 389
by Rhizopus oryzae integrated with cassava pulp hydrolysis. Bioprocess Biosyst Eng. 33: 407-390
416. 391
18. Vaheed H, Shojaosadati SA, Galip H. 2011. Evaluation and optimization of ethanol 392
production from carob pod extract by Zymomonas mobilis using response surface 393
methodology. J Ind Microbiol Biotechnol. 38: 101-111. 394
19. Zhao XQ, Bai FW. 2009. Mechanisms of yeast stress tolerance and its manipulation for 395
efficient fuel ethanol production. J. Biotechnol. 144: 23-30. 396
ACCEPTED
17Figure legends 397
Figure 1 - Fermentation profiles of yeast Saccharomyces cerevisiae F13A, using aqueous 398
carob residue extract as carbon source at different initial sugar concentrations. A – 20 g/l, B – 399
50 g/l, C – 100 g/l, D – 150 g/l, E – 200 g/l, F – 250 g/l, G – 300 g/l and H – 350 g/l. 400
logarithm Ln of DW (filled triangles) and DMFIT modeling predictions (line), ethanol 401
production (filled squares) and total sugar consumption (empty circles). The fermentation was 402
run for 96 h on an orbital shaker at 150 rpm and 30 °C. The experiments were performed 403
three times. Dry cell weight, sugar and ethanol data are average of three replicates. 404
Figure 2 – Glucose consumption and sucrose hydrolysis time-course in aqueous carob extract 405
fermentations, at different initial sugar concentrations. A – 20 g/l, B – 100 g/l, C – 250 g/l and 406
D – 350 g/l. Glucose consumption (empty squares) and sucrose hydrolysis (filled triangles). 407
The fermentation was run for 96 h on an orbital shaker at 150 rpm and 30 °C. The 408
experiments were performed three times. 409
Figure 3 – Variation of the initial specific rate of sucrose hydrolysis (moles per gram of DW 410
per hour) with glucose concentration, in the fermentation of aqueous carob extract. Culture 411
conditions were 30°C, 150 rpm during 96 h. Glucose concentrations were 7.5 g/l (empty 412
squares), 17 g/l (filled squares), 22 g/l (empty triangles), 41g/l (filled triangles), 45 g/l (filled 413
diamond), 64 g/l (filled circles) and 82 g/l (empty diamond and circles). An arbitrary linear 414
modeling of the data (line) was also plotted. 415 416 417 418 419 420 421 422 423 424 425 426 427 428
ACCEPTED
18Tables 429
Table 1- Kinetics and stoichiometric parameters for biomass, ethanol produced and total 430
sugar consumption for Saccharomyces cerevisiae F13A fermentations, with different initial 431
sugars concentration in the aqueous carob extract. Culture conditions were 30 °C, 150 rpm 432
during 96 h. 433
434
Values are mean ± SD of three replicates. S0- Initial total sugar concentration; µ- Specific growth rate; Yx/s- biomass yield, T - % sugar 435
consumed; qEth - Specific ethanol production rate; Eth – Ethanol concentration at the interval. 436 437 438 439 440 441 442 443 444 445 446 447 448 449 450 451
t interv T q Eth t interv T q Eth
(h) (%) (g/g h) (h) (%) (g/gh) 20 0-12 0.224 ± 0.022 0.131 ± 0.005 100.0 0.454 6.70 ± 0.03 12-96 0.0049 ± 0.0005 0.0 -0.016 -6.53 ± 0.80 50 0-12 0.226 ± 0.010 0.113 ± 0.017 100.0 0.816 18.84 ± 0.10 12-96 0.0 -0.026 -12.85 ± 1.60 100 0-12 0.207 ± 0.012 0.089 ± 0.006 92.0 1.068 40.55 ± 0.39 12-96 8.0 -0.014 -15.01 ± 3.28 150 0-15 0.164 ± 0.012 0.057 ± 0.003 90.5 0.812 41.56 ± 0.74 15-96 9.5 -0.013 -9.39 ± 1.42 200 0-15 0.125 ± 0.005 0.044 ± 0.002 58.3 0.881 81.30 ± 0.42 15-96 41.8 -0.010 -7.88 ± 0.54 250 0-20 0.076 ± 0.011 0.032 ± 0.002 56.2 0.670 82.56 ± 0.19 20-96 43.8 0.110 17.51 ± 0.19 300 0-24 0.070 ± 0.004 0.017 ± 0.001 50.5 0.685 42.10 ± 0.28 24-96 44.9 0.173 55.93 ± 1.84 350 0-32 0.054 ± 0.004 0.016 ± 0.001 44.9 - 47.30 ± 1.67 32-96 20.8 0.133
Growth parameters at exponential phase S0 (g/l) µ (1/h) Yx/s (g/g) Eth (g/l) -Eth (g/l) µ (1/h)
ACCEPTED
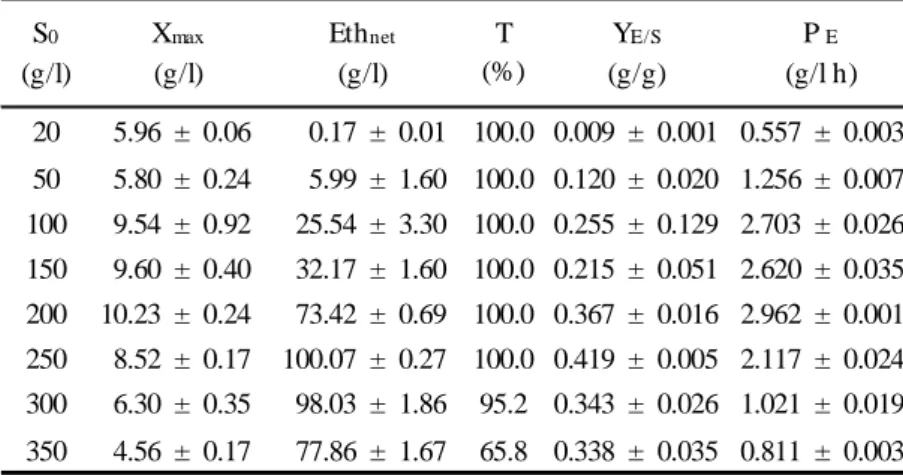
19Table 2- Final concentrations of biomass, net ethanol accumulated and ethanol/sugar yields, 452
for Saccharomyces cerevisiae F13A fermentations, using aqueous carob extract at different 453
sugar concentrations. Culture conditions were 30 °C, 150 rpm during 96 h. 454 455 456 457 458 459 460 461 462 463 464 465 466 467 468 469 470 471 472 473 474 20 5.96 ± 0.06 0.17 ± 0.01 100.0 0.009 ± 0.001 0.557 ± 0.003 50 5.80 ± 0.24 5.99 ± 1.60 100.0 0.120 ± 0.020 1.256 ± 0.007 100 9.54 ± 0.92 25.54 ± 3.30 100.0 0.255 ± 0.129 2.703 ± 0.026 150 9.60 ± 0.40 32.17 ± 1.60 100.0 0.215 ± 0.051 2.620 ± 0.035 200 10.23 ± 0.24 73.42 ± 0.69 100.0 0.367 ± 0.016 2.962 ± 0.001 250 8.52 ± 0.17 100.07 ± 0.27 100.0 0.419 ± 0.005 2.117 ± 0.024 300 6.30 ± 0.35 98.03 ± 1.86 95.2 0.343 ± 0.026 1.021 ± 0.019 350 4.56 ± 0.17 77.86 ± 1.67 65.8 0.338 ± 0.035 0.811 ± 0.003 T (%) S0 (g/l) YE/S (g/g) P E (g/l h) Xmax (g/l) Ethnet (g/l)
Values are mean ± SD of three replicates. S0- Initial total sugar concentration; Xmax
-maximum biomass dry weight; Eth net- Final ethanol, balance between the production and consumption of ethanol T - % sugar consumed; YE/S- ethanol yield, PE- ethanol